

Key Insights
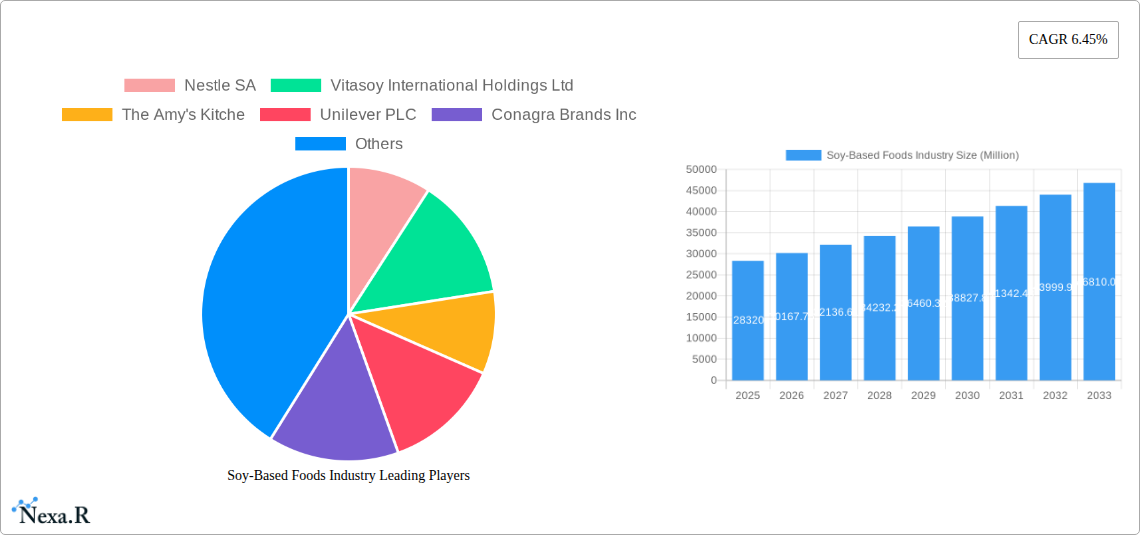
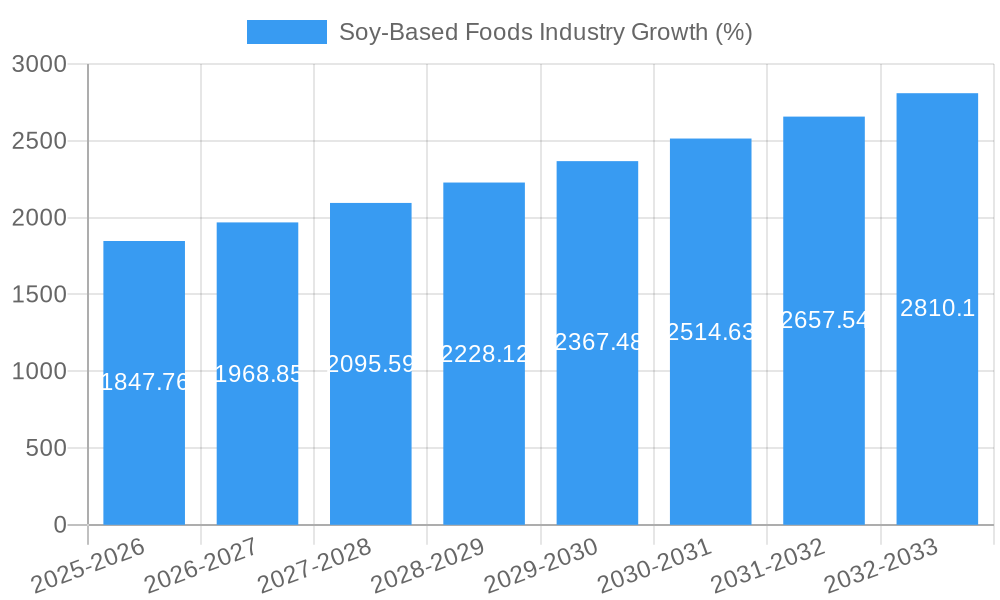
The soy-based foods industry, currently valued at $28.32 billion in 2025, is experiencing robust growth, projected to expand at a Compound Annual Growth Rate (CAGR) of 6.45% from 2025 to 2033. This growth is fueled by several key factors. The rising global population and increasing demand for plant-based protein sources are significant drivers. Consumers are increasingly adopting vegetarian, vegan, and flexitarian diets due to health concerns, ethical considerations regarding animal welfare, and environmental sustainability. This shift in dietary preferences is directly impacting the demand for soy-based alternatives to meat, dairy, and other traditional food products. Furthermore, the continuous innovation in product development, leading to improved taste, texture, and nutritional profiles of soy-based foods, is attracting a wider consumer base. The convenience and affordability of these products also contribute to their rising popularity. Market segmentation reveals strong growth in non-dairy ice cream, cheese, and yogurt segments, driven by the increasing demand for healthier and more sustainable alternatives. Online retail channels are also experiencing significant growth, reflecting the changing consumer behavior and increased accessibility through e-commerce platforms. Major players like Nestle, Unilever, and Danone, along with emerging innovative companies like Impossible Foods, are actively investing in research and development to enhance product quality and expand market reach.
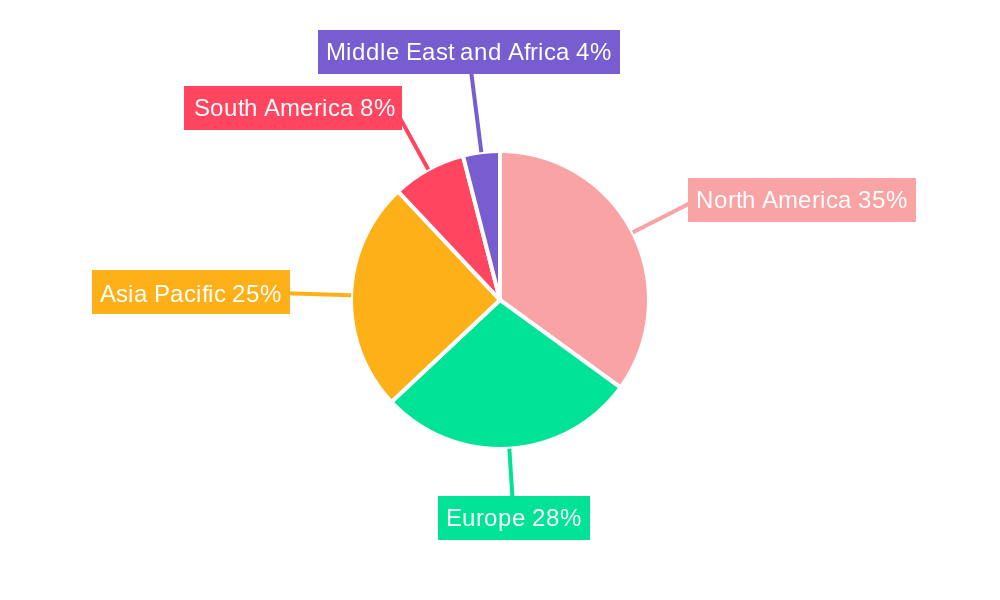
Geographic expansion is another significant element contributing to industry growth. While North America and Europe currently hold a substantial market share, the Asia-Pacific region, particularly China, is poised for significant expansion due to its large population and increasing disposable incomes. However, certain challenges remain. Concerns about the potential health effects of soy consumption, specifically related to phytoestrogens, and the need to address sustainability issues along the soy supply chain, represent areas requiring attention. Despite these restraints, the overall outlook for the soy-based foods industry remains overwhelmingly positive, with significant potential for continued growth and market expansion over the next decade. The industry's ability to address consumer concerns and adapt to evolving market trends will be crucial in sustaining its upward trajectory.
Soy-Based Foods Industry Market Report: 2019-2033
This comprehensive report provides a detailed analysis of the soy-based foods industry, encompassing market dynamics, growth trends, regional dominance, product landscape, and key players. The study period covers 2019-2033, with a focus on the base year 2025 and forecast period 2025-2033. The report utilizes data from the historical period 2019-2024 to predict future market trends. The report's findings are crucial for industry professionals, investors, and businesses seeking a deep understanding of this rapidly evolving market. The report delves into parent markets (plant-based foods) and child markets (specific soy-based products) to provide a complete market picture. Market values are presented in million units.
Soy-Based Foods Industry Market Dynamics & Structure
This section analyzes the competitive landscape, technological advancements, regulatory environment, and market trends within the soy-based foods industry. The market is characterized by a moderate level of concentration, with key players such as Nestle SA, Unilever PLC, and Danone SA holding significant market share. However, the emergence of smaller, innovative companies is also shaping the market.
- Market Concentration: The top 5 players hold an estimated xx% market share in 2025.
- Technological Innovation: Significant R&D investments are focused on improving the taste, texture, and nutritional profile of soy-based products. This includes advancements in protein extraction, fermentation techniques, and texturization technologies.
- Regulatory Frameworks: Government regulations regarding labeling, food safety, and sustainability are influencing product development and market access.
- Competitive Product Substitutes: Soy-based foods compete with other plant-based alternatives, such as pea protein and mycoprotein, as well as traditional animal-based products.
- End-User Demographics: The increasing adoption of vegan and vegetarian lifestyles, coupled with growing health consciousness, is a major driver of market growth. The target demographic is expanding beyond niche groups to encompass a broader consumer base.
- M&A Trends: The industry has witnessed xx M&A deals in the historical period, demonstrating strategic consolidation and expansion efforts among major players.
Soy-Based Foods Industry Growth Trends & Insights
The soy-based foods market is experiencing robust growth, driven by increasing consumer demand for plant-based alternatives and health-conscious eating habits. The market size reached xx million units in 2024 and is projected to reach xx million units by 2033, exhibiting a CAGR of xx% during the forecast period. This growth is fueled by technological advancements that are improving the taste, texture, and affordability of soy-based products. Furthermore, evolving consumer preferences and increased media attention on sustainable and ethical food choices are contributing to market expansion. Market penetration rates vary across different product categories, with meat substitutes showing the highest adoption rates and a projected penetration of xx% by 2033. Changes in consumer behavior, such as increased online shopping and a growing preference for convenience foods, further shape market trends.
Dominant Regions, Countries, or Segments in Soy-Based Foods Industry
North America and Europe currently dominate the soy-based foods market, primarily driven by high consumer awareness of plant-based alternatives and strong regulatory support. However, Asia-Pacific is expected to show significant growth in the coming years due to rising disposable incomes and changing dietary habits.
By Product Type:
- Meat Substitutes: This segment holds the largest market share, driven by increasing demand for environmentally friendly and ethical food choices. Growth is particularly strong in developed nations, with an anticipated CAGR of xx% in North America and xx% in Europe by 2033.
By Distribution Channel:
- Hypermarkets/Supermarkets: This channel maintains the largest market share. However, online retail channels are expected to show rapid growth driven by e-commerce expansion and consumer convenience.
By Tempeh Segment:
- Non-Dairy Yogurt: This segment has high growth potential, driven by increasing consumer awareness of dairy alternatives.
Key drivers include supportive government policies, strong infrastructure development, and a growing health-conscious population in leading regions and segments.
Soy-Based Foods Industry Product Landscape
The soy-based foods industry showcases continuous innovation, introducing new products with improved taste, texture, and nutritional profiles. Meat substitutes are seeing particularly rapid innovation, with advancements in protein extraction and texturization leading to products that closely mimic the taste and texture of animal-based counterparts. Other segments are focusing on clean label products and functional ingredients to appeal to specific health concerns. Companies are emphasizing unique selling propositions such as sustainability credentials, non-GMO ingredients, and organic certifications. Technological advancements, such as 3D printing for customized meat substitutes, are also shaping the landscape.
Key Drivers, Barriers & Challenges in Soy-Based Foods Industry
Key Drivers:
- Growing demand for plant-based foods due to ethical and environmental concerns.
- Increasing health consciousness among consumers driving the adoption of soy-based products.
- Technological advancements improving the taste, texture, and nutritional value of soy products.
Key Challenges and Restraints:
- High production costs and price sensitivity among consumers.
- Consumer perception and acceptance of soy products as a replacement for meat.
- Supply chain disruptions and regulatory hurdles in certain regions, potentially impacting production and distribution.
Emerging Opportunities in Soy-Based Foods Industry
- Untapped markets in developing countries present significant growth potential.
- Innovation in product applications—e.g., soy-based protein for sports nutrition, or advanced food technologies.
- Adapting product lines to satisfy diverse consumer preferences—e.g. organic options or gluten-free varieties.
Growth Accelerators in the Soy-Based Foods Industry Industry
Long-term growth will be accelerated by strategic partnerships between soy-based food producers and retailers. Technological breakthroughs in protein extraction and formulation will also enable new product innovations. Furthermore, aggressive marketing and education campaigns highlighting the health benefits and environmental advantages of soy-based foods will expand market penetration.
Key Players Shaping the Soy-Based Foods Industry Market
- Nestle SA
- Vitasoy International Holdings Ltd
- The Amy's Kitchen
- Unilever PLC
- Conagra Brands Inc
- Danone SA
- Monde Nissin Corporation
- Impossible Foods Inc
- Hain Celestial Group
- Good Catch Foods
Notable Milestones in Soy-Based Foods Industry Sector
- 2020: Impossible Foods launches a new generation of plant-based burger patties.
- 2022: Unilever acquires a significant stake in a leading soy-based food company.
- 2023: Nestle launches a line of organic soy-based yogurts.
In-Depth Soy-Based Foods Industry Market Outlook
The soy-based foods market exhibits substantial future potential. Continued innovation in product development, coupled with supportive government policies and increasing consumer awareness, will drive market expansion. Strategic partnerships among key players, including technology collaborations and M&A activities, are predicted to shape the industry further. The focus on sustainability and improved nutritional profiles will maintain the industry's growth momentum in the long term.
Soy-Based Foods Industry Segmentation
-
1. Product Type
-
1.1. Meat Substitutes
- 1.1.1. Textured Vegetable Protein
- 1.1.2. Tofu
- 1.1.3. Tempeh
- 1.2. Non-Dairy Ice Cream
- 1.3. Non-Dairy Cheese
- 1.4. Non-Dairy Yogurt
- 1.5. Non-Dairy Spread
-
1.1. Meat Substitutes
-
2. Distribution Channel
- 2.1. Hypermarkets/Supermarkets
- 2.2. Convenience Stores
- 2.3. Online Retail Stores
- 2.4. Other Distribution Channel
Soy-Based Foods Industry Segmentation By Geography
-
1. North America
- 1.1. United States
- 1.2. Canada
- 1.3. Mexico
- 1.4. Rest of North America
-
2. Europe
- 2.1. Germany
- 2.2. United Kingdom
- 2.3. France
- 2.4. Russia
- 2.5. Spain
- 2.6. Rest of Europe
-
3. Asia Pacific
- 3.1. China
- 3.2. Japan
- 3.3. Japan
- 3.4. Australia
- 3.5. Rest of Asia Pacific
-
4. South America
- 4.1. Brazil
- 4.2. Argentina
- 4.3. Rest of South America
-
5. Middle East and Africa
- 5.1. South Africa
- 5.2. Saudi Arabia
- 5.3. Rest of Middle East and Africa
Soy-Based Foods Industry REPORT HIGHLIGHTS
| Aspects | Details |
|---|---|
| Study Period | 2019-2033 |
| Base Year | 2024 |
| Estimated Year | 2025 |
| Forecast Period | 2025-2033 |
| Historical Period | 2019-2024 |
| Growth Rate | CAGR of 6.45% from 2019-2033 |
| Segmentation |
|
Table of Contents
- 1. Introduction
- 1.1. Research Scope
- 1.2. Market Segmentation
- 1.3. Research Methodology
- 1.4. Definitions and Assumptions
- 2. Executive Summary
- 2.1. Introduction
- 3. Market Dynamics
- 3.1. Introduction
- 3.2. Market Drivers
- 3.3. Market Restrains
- 3.4. Market Trends
- 3.4.1. Rising Prevalence of Lactose Intolerant Population
- 4. Market Factor Analysis
- 4.1. Porters Five Forces
- 4.2. Supply/Value Chain
- 4.3. PESTEL analysis
- 4.4. Market Entropy
- 4.5. Patent/Trademark Analysis
- 5. Global Soy-Based Foods Industry Analysis, Insights and Forecast, 2019-2031
- 5.1. Market Analysis, Insights and Forecast - by Product Type
- 5.1.1. Meat Substitutes
- 5.1.1.1. Textured Vegetable Protein
- 5.1.1.2. Tofu
- 5.1.1.3. Tempeh
- 5.1.2. Non-Dairy Ice Cream
- 5.1.3. Non-Dairy Cheese
- 5.1.4. Non-Dairy Yogurt
- 5.1.5. Non-Dairy Spread
- 5.1.1. Meat Substitutes
- 5.2. Market Analysis, Insights and Forecast - by Distribution Channel
- 5.2.1. Hypermarkets/Supermarkets
- 5.2.2. Convenience Stores
- 5.2.3. Online Retail Stores
- 5.2.4. Other Distribution Channel
- 5.3. Market Analysis, Insights and Forecast - by Region
- 5.3.1. North America
- 5.3.2. Europe
- 5.3.3. Asia Pacific
- 5.3.4. South America
- 5.3.5. Middle East and Africa
- 5.1. Market Analysis, Insights and Forecast - by Product Type
- 6. North America Soy-Based Foods Industry Analysis, Insights and Forecast, 2019-2031
- 6.1. Market Analysis, Insights and Forecast - by Product Type
- 6.1.1. Meat Substitutes
- 6.1.1.1. Textured Vegetable Protein
- 6.1.1.2. Tofu
- 6.1.1.3. Tempeh
- 6.1.2. Non-Dairy Ice Cream
- 6.1.3. Non-Dairy Cheese
- 6.1.4. Non-Dairy Yogurt
- 6.1.5. Non-Dairy Spread
- 6.1.1. Meat Substitutes
- 6.2. Market Analysis, Insights and Forecast - by Distribution Channel
- 6.2.1. Hypermarkets/Supermarkets
- 6.2.2. Convenience Stores
- 6.2.3. Online Retail Stores
- 6.2.4. Other Distribution Channel
- 6.1. Market Analysis, Insights and Forecast - by Product Type
- 7. Europe Soy-Based Foods Industry Analysis, Insights and Forecast, 2019-2031
- 7.1. Market Analysis, Insights and Forecast - by Product Type
- 7.1.1. Meat Substitutes
- 7.1.1.1. Textured Vegetable Protein
- 7.1.1.2. Tofu
- 7.1.1.3. Tempeh
- 7.1.2. Non-Dairy Ice Cream
- 7.1.3. Non-Dairy Cheese
- 7.1.4. Non-Dairy Yogurt
- 7.1.5. Non-Dairy Spread
- 7.1.1. Meat Substitutes
- 7.2. Market Analysis, Insights and Forecast - by Distribution Channel
- 7.2.1. Hypermarkets/Supermarkets
- 7.2.2. Convenience Stores
- 7.2.3. Online Retail Stores
- 7.2.4. Other Distribution Channel
- 7.1. Market Analysis, Insights and Forecast - by Product Type
- 8. Asia Pacific Soy-Based Foods Industry Analysis, Insights and Forecast, 2019-2031
- 8.1. Market Analysis, Insights and Forecast - by Product Type
- 8.1.1. Meat Substitutes
- 8.1.1.1. Textured Vegetable Protein
- 8.1.1.2. Tofu
- 8.1.1.3. Tempeh
- 8.1.2. Non-Dairy Ice Cream
- 8.1.3. Non-Dairy Cheese
- 8.1.4. Non-Dairy Yogurt
- 8.1.5. Non-Dairy Spread
- 8.1.1. Meat Substitutes
- 8.2. Market Analysis, Insights and Forecast - by Distribution Channel
- 8.2.1. Hypermarkets/Supermarkets
- 8.2.2. Convenience Stores
- 8.2.3. Online Retail Stores
- 8.2.4. Other Distribution Channel
- 8.1. Market Analysis, Insights and Forecast - by Product Type
- 9. South America Soy-Based Foods Industry Analysis, Insights and Forecast, 2019-2031
- 9.1. Market Analysis, Insights and Forecast - by Product Type
- 9.1.1. Meat Substitutes
- 9.1.1.1. Textured Vegetable Protein
- 9.1.1.2. Tofu
- 9.1.1.3. Tempeh
- 9.1.2. Non-Dairy Ice Cream
- 9.1.3. Non-Dairy Cheese
- 9.1.4. Non-Dairy Yogurt
- 9.1.5. Non-Dairy Spread
- 9.1.1. Meat Substitutes
- 9.2. Market Analysis, Insights and Forecast - by Distribution Channel
- 9.2.1. Hypermarkets/Supermarkets
- 9.2.2. Convenience Stores
- 9.2.3. Online Retail Stores
- 9.2.4. Other Distribution Channel
- 9.1. Market Analysis, Insights and Forecast - by Product Type
- 10. Middle East and Africa Soy-Based Foods Industry Analysis, Insights and Forecast, 2019-2031
- 10.1. Market Analysis, Insights and Forecast - by Product Type
- 10.1.1. Meat Substitutes
- 10.1.1.1. Textured Vegetable Protein
- 10.1.1.2. Tofu
- 10.1.1.3. Tempeh
- 10.1.2. Non-Dairy Ice Cream
- 10.1.3. Non-Dairy Cheese
- 10.1.4. Non-Dairy Yogurt
- 10.1.5. Non-Dairy Spread
- 10.1.1. Meat Substitutes
- 10.2. Market Analysis, Insights and Forecast - by Distribution Channel
- 10.2.1. Hypermarkets/Supermarkets
- 10.2.2. Convenience Stores
- 10.2.3. Online Retail Stores
- 10.2.4. Other Distribution Channel
- 10.1. Market Analysis, Insights and Forecast - by Product Type
- 11. North America Soy-Based Foods Industry Analysis, Insights and Forecast, 2019-2031
- 11.1. Market Analysis, Insights and Forecast - By Country/Sub-region
- 11.1.1 United States
- 11.1.2 Canada
- 11.1.3 Mexico
- 11.1.4 Rest of North America
- 12. Europe Soy-Based Foods Industry Analysis, Insights and Forecast, 2019-2031
- 12.1. Market Analysis, Insights and Forecast - By Country/Sub-region
- 12.1.1 Germany
- 12.1.2 United Kingdom
- 12.1.3 France
- 12.1.4 Russia
- 12.1.5 Spain
- 12.1.6 Rest of Europe
- 13. Asia Pacific Soy-Based Foods Industry Analysis, Insights and Forecast, 2019-2031
- 13.1. Market Analysis, Insights and Forecast - By Country/Sub-region
- 13.1.1 China
- 13.1.2 Japan
- 13.1.3 Japan
- 13.1.4 Australia
- 13.1.5 Rest of Asia Pacific
- 14. South America Soy-Based Foods Industry Analysis, Insights and Forecast, 2019-2031
- 14.1. Market Analysis, Insights and Forecast - By Country/Sub-region
- 14.1.1 Brazil
- 14.1.2 Argentina
- 14.1.3 Rest of South America
- 15. Middle East and Africa Soy-Based Foods Industry Analysis, Insights and Forecast, 2019-2031
- 15.1. Market Analysis, Insights and Forecast - By Country/Sub-region
- 15.1.1 South Africa
- 15.1.2 Saudi Arabia
- 15.1.3 Rest of Middle East and Africa
- 16. Competitive Analysis
- 16.1. Global Market Share Analysis 2024
- 16.2. Company Profiles
- 16.2.1 Nestle SA
- 16.2.1.1. Overview
- 16.2.1.2. Products
- 16.2.1.3. SWOT Analysis
- 16.2.1.4. Recent Developments
- 16.2.1.5. Financials (Based on Availability)
- 16.2.2 Vitasoy International Holdings Ltd
- 16.2.2.1. Overview
- 16.2.2.2. Products
- 16.2.2.3. SWOT Analysis
- 16.2.2.4. Recent Developments
- 16.2.2.5. Financials (Based on Availability)
- 16.2.3 The Amy's Kitche
- 16.2.3.1. Overview
- 16.2.3.2. Products
- 16.2.3.3. SWOT Analysis
- 16.2.3.4. Recent Developments
- 16.2.3.5. Financials (Based on Availability)
- 16.2.4 Unilever PLC
- 16.2.4.1. Overview
- 16.2.4.2. Products
- 16.2.4.3. SWOT Analysis
- 16.2.4.4. Recent Developments
- 16.2.4.5. Financials (Based on Availability)
- 16.2.5 Conagra Brands Inc
- 16.2.5.1. Overview
- 16.2.5.2. Products
- 16.2.5.3. SWOT Analysis
- 16.2.5.4. Recent Developments
- 16.2.5.5. Financials (Based on Availability)
- 16.2.6 Danone SA
- 16.2.6.1. Overview
- 16.2.6.2. Products
- 16.2.6.3. SWOT Analysis
- 16.2.6.4. Recent Developments
- 16.2.6.5. Financials (Based on Availability)
- 16.2.7 Monde Nissin Corporation
- 16.2.7.1. Overview
- 16.2.7.2. Products
- 16.2.7.3. SWOT Analysis
- 16.2.7.4. Recent Developments
- 16.2.7.5. Financials (Based on Availability)
- 16.2.8 Impossible Foods Inc
- 16.2.8.1. Overview
- 16.2.8.2. Products
- 16.2.8.3. SWOT Analysis
- 16.2.8.4. Recent Developments
- 16.2.8.5. Financials (Based on Availability)
- 16.2.9 Hain Celestial Group
- 16.2.9.1. Overview
- 16.2.9.2. Products
- 16.2.9.3. SWOT Analysis
- 16.2.9.4. Recent Developments
- 16.2.9.5. Financials (Based on Availability)
- 16.2.10 Good Catch Foods
- 16.2.10.1. Overview
- 16.2.10.2. Products
- 16.2.10.3. SWOT Analysis
- 16.2.10.4. Recent Developments
- 16.2.10.5. Financials (Based on Availability)
- 16.2.1 Nestle SA
List of Figures
- Figure 1: Global Soy-Based Foods Industry Revenue Breakdown (Million, %) by Region 2024 & 2032
- Figure 2: North America Soy-Based Foods Industry Revenue (Million), by Country 2024 & 2032
- Figure 3: North America Soy-Based Foods Industry Revenue Share (%), by Country 2024 & 2032
- Figure 4: Europe Soy-Based Foods Industry Revenue (Million), by Country 2024 & 2032
- Figure 5: Europe Soy-Based Foods Industry Revenue Share (%), by Country 2024 & 2032
- Figure 6: Asia Pacific Soy-Based Foods Industry Revenue (Million), by Country 2024 & 2032
- Figure 7: Asia Pacific Soy-Based Foods Industry Revenue Share (%), by Country 2024 & 2032
- Figure 8: South America Soy-Based Foods Industry Revenue (Million), by Country 2024 & 2032
- Figure 9: South America Soy-Based Foods Industry Revenue Share (%), by Country 2024 & 2032
- Figure 10: Middle East and Africa Soy-Based Foods Industry Revenue (Million), by Country 2024 & 2032
- Figure 11: Middle East and Africa Soy-Based Foods Industry Revenue Share (%), by Country 2024 & 2032
- Figure 12: North America Soy-Based Foods Industry Revenue (Million), by Product Type 2024 & 2032
- Figure 13: North America Soy-Based Foods Industry Revenue Share (%), by Product Type 2024 & 2032
- Figure 14: North America Soy-Based Foods Industry Revenue (Million), by Distribution Channel 2024 & 2032
- Figure 15: North America Soy-Based Foods Industry Revenue Share (%), by Distribution Channel 2024 & 2032
- Figure 16: North America Soy-Based Foods Industry Revenue (Million), by Country 2024 & 2032
- Figure 17: North America Soy-Based Foods Industry Revenue Share (%), by Country 2024 & 2032
- Figure 18: Europe Soy-Based Foods Industry Revenue (Million), by Product Type 2024 & 2032
- Figure 19: Europe Soy-Based Foods Industry Revenue Share (%), by Product Type 2024 & 2032
- Figure 20: Europe Soy-Based Foods Industry Revenue (Million), by Distribution Channel 2024 & 2032
- Figure 21: Europe Soy-Based Foods Industry Revenue Share (%), by Distribution Channel 2024 & 2032
- Figure 22: Europe Soy-Based Foods Industry Revenue (Million), by Country 2024 & 2032
- Figure 23: Europe Soy-Based Foods Industry Revenue Share (%), by Country 2024 & 2032
- Figure 24: Asia Pacific Soy-Based Foods Industry Revenue (Million), by Product Type 2024 & 2032
- Figure 25: Asia Pacific Soy-Based Foods Industry Revenue Share (%), by Product Type 2024 & 2032
- Figure 26: Asia Pacific Soy-Based Foods Industry Revenue (Million), by Distribution Channel 2024 & 2032
- Figure 27: Asia Pacific Soy-Based Foods Industry Revenue Share (%), by Distribution Channel 2024 & 2032
- Figure 28: Asia Pacific Soy-Based Foods Industry Revenue (Million), by Country 2024 & 2032
- Figure 29: Asia Pacific Soy-Based Foods Industry Revenue Share (%), by Country 2024 & 2032
- Figure 30: South America Soy-Based Foods Industry Revenue (Million), by Product Type 2024 & 2032
- Figure 31: South America Soy-Based Foods Industry Revenue Share (%), by Product Type 2024 & 2032
- Figure 32: South America Soy-Based Foods Industry Revenue (Million), by Distribution Channel 2024 & 2032
- Figure 33: South America Soy-Based Foods Industry Revenue Share (%), by Distribution Channel 2024 & 2032
- Figure 34: South America Soy-Based Foods Industry Revenue (Million), by Country 2024 & 2032
- Figure 35: South America Soy-Based Foods Industry Revenue Share (%), by Country 2024 & 2032
- Figure 36: Middle East and Africa Soy-Based Foods Industry Revenue (Million), by Product Type 2024 & 2032
- Figure 37: Middle East and Africa Soy-Based Foods Industry Revenue Share (%), by Product Type 2024 & 2032
- Figure 38: Middle East and Africa Soy-Based Foods Industry Revenue (Million), by Distribution Channel 2024 & 2032
- Figure 39: Middle East and Africa Soy-Based Foods Industry Revenue Share (%), by Distribution Channel 2024 & 2032
- Figure 40: Middle East and Africa Soy-Based Foods Industry Revenue (Million), by Country 2024 & 2032
- Figure 41: Middle East and Africa Soy-Based Foods Industry Revenue Share (%), by Country 2024 & 2032
List of Tables
- Table 1: Global Soy-Based Foods Industry Revenue Million Forecast, by Region 2019 & 2032
- Table 2: Global Soy-Based Foods Industry Revenue Million Forecast, by Product Type 2019 & 2032
- Table 3: Global Soy-Based Foods Industry Revenue Million Forecast, by Distribution Channel 2019 & 2032
- Table 4: Global Soy-Based Foods Industry Revenue Million Forecast, by Region 2019 & 2032
- Table 5: Global Soy-Based Foods Industry Revenue Million Forecast, by Country 2019 & 2032
- Table 6: United States Soy-Based Foods Industry Revenue (Million) Forecast, by Application 2019 & 2032
- Table 7: Canada Soy-Based Foods Industry Revenue (Million) Forecast, by Application 2019 & 2032
- Table 8: Mexico Soy-Based Foods Industry Revenue (Million) Forecast, by Application 2019 & 2032
- Table 9: Rest of North America Soy-Based Foods Industry Revenue (Million) Forecast, by Application 2019 & 2032
- Table 10: Global Soy-Based Foods Industry Revenue Million Forecast, by Country 2019 & 2032
- Table 11: Germany Soy-Based Foods Industry Revenue (Million) Forecast, by Application 2019 & 2032
- Table 12: United Kingdom Soy-Based Foods Industry Revenue (Million) Forecast, by Application 2019 & 2032
- Table 13: France Soy-Based Foods Industry Revenue (Million) Forecast, by Application 2019 & 2032
- Table 14: Russia Soy-Based Foods Industry Revenue (Million) Forecast, by Application 2019 & 2032
- Table 15: Spain Soy-Based Foods Industry Revenue (Million) Forecast, by Application 2019 & 2032
- Table 16: Rest of Europe Soy-Based Foods Industry Revenue (Million) Forecast, by Application 2019 & 2032
- Table 17: Global Soy-Based Foods Industry Revenue Million Forecast, by Country 2019 & 2032
- Table 18: China Soy-Based Foods Industry Revenue (Million) Forecast, by Application 2019 & 2032
- Table 19: Japan Soy-Based Foods Industry Revenue (Million) Forecast, by Application 2019 & 2032
- Table 20: Japan Soy-Based Foods Industry Revenue (Million) Forecast, by Application 2019 & 2032
- Table 21: Australia Soy-Based Foods Industry Revenue (Million) Forecast, by Application 2019 & 2032
- Table 22: Rest of Asia Pacific Soy-Based Foods Industry Revenue (Million) Forecast, by Application 2019 & 2032
- Table 23: Global Soy-Based Foods Industry Revenue Million Forecast, by Country 2019 & 2032
- Table 24: Brazil Soy-Based Foods Industry Revenue (Million) Forecast, by Application 2019 & 2032
- Table 25: Argentina Soy-Based Foods Industry Revenue (Million) Forecast, by Application 2019 & 2032
- Table 26: Rest of South America Soy-Based Foods Industry Revenue (Million) Forecast, by Application 2019 & 2032
- Table 27: Global Soy-Based Foods Industry Revenue Million Forecast, by Country 2019 & 2032
- Table 28: South Africa Soy-Based Foods Industry Revenue (Million) Forecast, by Application 2019 & 2032
- Table 29: Saudi Arabia Soy-Based Foods Industry Revenue (Million) Forecast, by Application 2019 & 2032
- Table 30: Rest of Middle East and Africa Soy-Based Foods Industry Revenue (Million) Forecast, by Application 2019 & 2032
- Table 31: Global Soy-Based Foods Industry Revenue Million Forecast, by Product Type 2019 & 2032
- Table 32: Global Soy-Based Foods Industry Revenue Million Forecast, by Distribution Channel 2019 & 2032
- Table 33: Global Soy-Based Foods Industry Revenue Million Forecast, by Country 2019 & 2032
- Table 34: United States Soy-Based Foods Industry Revenue (Million) Forecast, by Application 2019 & 2032
- Table 35: Canada Soy-Based Foods Industry Revenue (Million) Forecast, by Application 2019 & 2032
- Table 36: Mexico Soy-Based Foods Industry Revenue (Million) Forecast, by Application 2019 & 2032
- Table 37: Rest of North America Soy-Based Foods Industry Revenue (Million) Forecast, by Application 2019 & 2032
- Table 38: Global Soy-Based Foods Industry Revenue Million Forecast, by Product Type 2019 & 2032
- Table 39: Global Soy-Based Foods Industry Revenue Million Forecast, by Distribution Channel 2019 & 2032
- Table 40: Global Soy-Based Foods Industry Revenue Million Forecast, by Country 2019 & 2032
- Table 41: Germany Soy-Based Foods Industry Revenue (Million) Forecast, by Application 2019 & 2032
- Table 42: United Kingdom Soy-Based Foods Industry Revenue (Million) Forecast, by Application 2019 & 2032
- Table 43: France Soy-Based Foods Industry Revenue (Million) Forecast, by Application 2019 & 2032
- Table 44: Russia Soy-Based Foods Industry Revenue (Million) Forecast, by Application 2019 & 2032
- Table 45: Spain Soy-Based Foods Industry Revenue (Million) Forecast, by Application 2019 & 2032
- Table 46: Rest of Europe Soy-Based Foods Industry Revenue (Million) Forecast, by Application 2019 & 2032
- Table 47: Global Soy-Based Foods Industry Revenue Million Forecast, by Product Type 2019 & 2032
- Table 48: Global Soy-Based Foods Industry Revenue Million Forecast, by Distribution Channel 2019 & 2032
- Table 49: Global Soy-Based Foods Industry Revenue Million Forecast, by Country 2019 & 2032
- Table 50: China Soy-Based Foods Industry Revenue (Million) Forecast, by Application 2019 & 2032
- Table 51: Japan Soy-Based Foods Industry Revenue (Million) Forecast, by Application 2019 & 2032
- Table 52: Japan Soy-Based Foods Industry Revenue (Million) Forecast, by Application 2019 & 2032
- Table 53: Australia Soy-Based Foods Industry Revenue (Million) Forecast, by Application 2019 & 2032
- Table 54: Rest of Asia Pacific Soy-Based Foods Industry Revenue (Million) Forecast, by Application 2019 & 2032
- Table 55: Global Soy-Based Foods Industry Revenue Million Forecast, by Product Type 2019 & 2032
- Table 56: Global Soy-Based Foods Industry Revenue Million Forecast, by Distribution Channel 2019 & 2032
- Table 57: Global Soy-Based Foods Industry Revenue Million Forecast, by Country 2019 & 2032
- Table 58: Brazil Soy-Based Foods Industry Revenue (Million) Forecast, by Application 2019 & 2032
- Table 59: Argentina Soy-Based Foods Industry Revenue (Million) Forecast, by Application 2019 & 2032
- Table 60: Rest of South America Soy-Based Foods Industry Revenue (Million) Forecast, by Application 2019 & 2032
- Table 61: Global Soy-Based Foods Industry Revenue Million Forecast, by Product Type 2019 & 2032
- Table 62: Global Soy-Based Foods Industry Revenue Million Forecast, by Distribution Channel 2019 & 2032
- Table 63: Global Soy-Based Foods Industry Revenue Million Forecast, by Country 2019 & 2032
- Table 64: South Africa Soy-Based Foods Industry Revenue (Million) Forecast, by Application 2019 & 2032
- Table 65: Saudi Arabia Soy-Based Foods Industry Revenue (Million) Forecast, by Application 2019 & 2032
- Table 66: Rest of Middle East and Africa Soy-Based Foods Industry Revenue (Million) Forecast, by Application 2019 & 2032
Frequently Asked Questions
1. What is the projected Compound Annual Growth Rate (CAGR) of the Soy-Based Foods Industry?
The projected CAGR is approximately 6.45%.
2. Which companies are prominent players in the Soy-Based Foods Industry?
Key companies in the market include Nestle SA, Vitasoy International Holdings Ltd, The Amy's Kitche, Unilever PLC, Conagra Brands Inc, Danone SA, Monde Nissin Corporation, Impossible Foods Inc, Hain Celestial Group, Good Catch Foods.
3. What are the main segments of the Soy-Based Foods Industry?
The market segments include Product Type, Distribution Channel.
4. Can you provide details about the market size?
The market size is estimated to be USD 28.32 Million as of 2022.
5. What are some drivers contributing to market growth?
N/A
6. What are the notable trends driving market growth?
Rising Prevalence of Lactose Intolerant Population.
7. Are there any restraints impacting market growth?
N/A
8. Can you provide examples of recent developments in the market?
N/A
9. What pricing options are available for accessing the report?
Pricing options include single-user, multi-user, and enterprise licenses priced at USD 4750, USD 5250, and USD 8750 respectively.
10. Is the market size provided in terms of value or volume?
The market size is provided in terms of value, measured in Million.
11. Are there any specific market keywords associated with the report?
Yes, the market keyword associated with the report is "Soy-Based Foods Industry," which aids in identifying and referencing the specific market segment covered.
12. How do I determine which pricing option suits my needs best?
The pricing options vary based on user requirements and access needs. Individual users may opt for single-user licenses, while businesses requiring broader access may choose multi-user or enterprise licenses for cost-effective access to the report.
13. Are there any additional resources or data provided in the Soy-Based Foods Industry report?
While the report offers comprehensive insights, it's advisable to review the specific contents or supplementary materials provided to ascertain if additional resources or data are available.
14. How can I stay updated on further developments or reports in the Soy-Based Foods Industry?
To stay informed about further developments, trends, and reports in the Soy-Based Foods Industry, consider subscribing to industry newsletters, following relevant companies and organizations, or regularly checking reputable industry news sources and publications.
Methodology
Step 1 - Identification of Relevant Samples Size from Population Database


Step 2 - Approaches for Defining Global Market Size (Value, Volume* & Price*)

Note*: In applicable scenarios
Step 3 - Data Sources
Primary Research
- Web Analytics
- Survey Reports
- Research Institute
- Latest Research Reports
- Opinion Leaders
Secondary Research
- Annual Reports
- White Paper
- Latest Press Release
- Industry Association
- Paid Database
- Investor Presentations

Step 4 - Data Triangulation
Involves using different sources of information in order to increase the validity of a study
These sources are likely to be stakeholders in a program - participants, other researchers, program staff, other community members, and so on.
Then we put all data in single framework & apply various statistical tools to find out the dynamic on the market.
During the analysis stage, feedback from the stakeholder groups would be compared to determine areas of agreement as well as areas of divergence
