

Key Insights
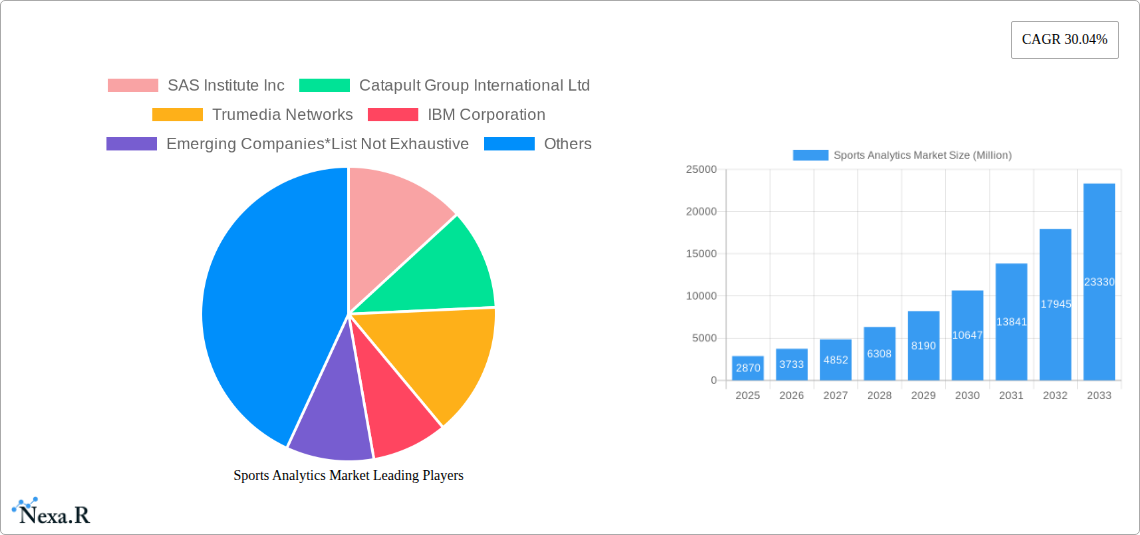
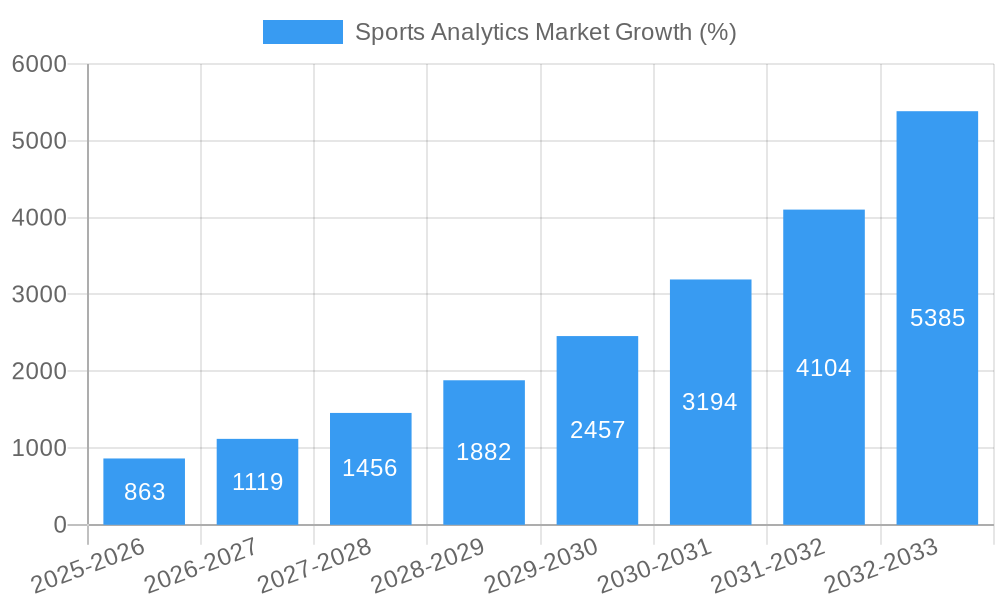
The global sports analytics market is experiencing robust growth, projected to reach \$2.87 billion in 2025 and maintain a Compound Annual Growth Rate (CAGR) of 30.04% from 2025 to 2033. This expansion is fueled by several key drivers. Firstly, the increasing adoption of data-driven decision-making by sports teams and leagues is paramount. Teams are leveraging advanced analytics to optimize player performance, enhance scouting strategies, and improve overall team management. Secondly, technological advancements, such as the development of sophisticated data capture and analysis tools (e.g., wearable sensor technology, video analytics), are significantly contributing to market growth. Furthermore, the rising popularity of fantasy sports and the growing engagement of sports fans with data-driven insights are creating new revenue streams and expanding the market's reach. The market is segmented by sport, with football, cricket, basketball, and American football representing significant portions, reflecting the high level of investment and data availability in these popular leagues. Major players, including SAS Institute, Catapult Group International, IBM, and Sportsradar, are driving innovation and market competition, while numerous emerging companies are contributing to specialized solutions within the sector. Geographical analysis reveals a strong presence in North America and Europe, driven by mature sports markets and technological infrastructure, while Asia-Pacific is emerging as a key growth region due to increasing investment in sports and technological adoption. Challenges exist, such as the high cost of advanced analytics solutions and the need for skilled data scientists to effectively interpret and utilize data. However, the overall market trajectory indicates substantial future growth, driven by continuous technological advancements and an ever-increasing reliance on data within the sports industry.
The continued growth trajectory is predicted to be influenced by factors such as the expanding use of artificial intelligence (AI) and machine learning (ML) in sports analytics. These technologies enable more accurate predictive modeling, player performance assessment, and injury risk mitigation. Moreover, the integration of analytics into broadcasting and fan engagement strategies is opening up further market opportunities. While the high cost of entry and data security concerns remain potential restraints, the overall positive market outlook is reinforced by the growing acceptance of data-driven strategies across all levels of the sports industry, from professional leagues to grassroots organizations. This pervasive adoption suggests that the sports analytics market will continue its rapid expansion well into the next decade, driven by continuous technological innovation and escalating demands for performance optimization within the competitive sporting landscape.
Sports Analytics Market: A Comprehensive Report (2019-2033)
This comprehensive report provides an in-depth analysis of the Sports Analytics Market, encompassing market dynamics, growth trends, regional analysis, competitive landscape, and future outlook. With a study period spanning 2019-2033, a base year of 2025, and a forecast period of 2025-2033, this report offers invaluable insights for industry professionals, investors, and strategic decision-makers. The market is segmented by sport (Football, Cricket, Hockey, Basketball, American Football, Other Sports) and further analyzed across key regions. The total market size is projected to reach xx Million by 2033.
Sports Analytics Market Dynamics & Structure
The Sports Analytics Market is characterized by a moderately concentrated landscape, with several major players vying for market share. Technological innovation, particularly in AI and machine learning, is a key driver, enabling more sophisticated data analysis and predictive modeling. Regulatory frameworks concerning data privacy and usage are evolving, impacting market operations. Competitive pressures from substitute technologies and new entrants are significant. The market experiences substantial M&A activity, with larger companies acquiring smaller, specialized analytics firms.
- Market Concentration: Moderately concentrated, with top 5 players holding approximately 40% market share in 2024.
- Technological Innovation: Rapid advancements in AI, machine learning, and big data analytics are driving market growth.
- Regulatory Landscape: Data privacy regulations (e.g., GDPR) influence data collection and usage practices.
- Competitive Substitutes: Traditional scouting methods and expert intuition pose some competition.
- M&A Activity: A significant number of mergers and acquisitions (xx deals in the past 5 years) have reshaped the competitive landscape. Average deal size was approximately xx Million.
- End-User Demographics: Primarily professional sports teams, leagues, and broadcasters, with increasing adoption by amateur and collegiate sports.
Sports Analytics Market Growth Trends & Insights
The Sports Analytics Market has witnessed robust growth over the historical period (2019-2024), driven by increasing data availability, technological advancements, and the growing acceptance of data-driven decision-making in sports. The market experienced a Compound Annual Growth Rate (CAGR) of xx% during this period, reaching a value of xx Million in 2024. Market penetration is relatively high among professional sports teams, but significant growth potential remains in amateur and collegiate levels. Technological disruptions, such as the rise of AI-powered analytics platforms, are accelerating market expansion. Consumer behavior is shifting toward embracing data-driven insights for enhancing performance, improving player recruitment, and optimizing strategic decisions. The market is projected to maintain a strong CAGR of xx% during the forecast period (2025-2033), reaching xx Million by 2033.
Dominant Regions, Countries, or Segments in Sports Analytics Market
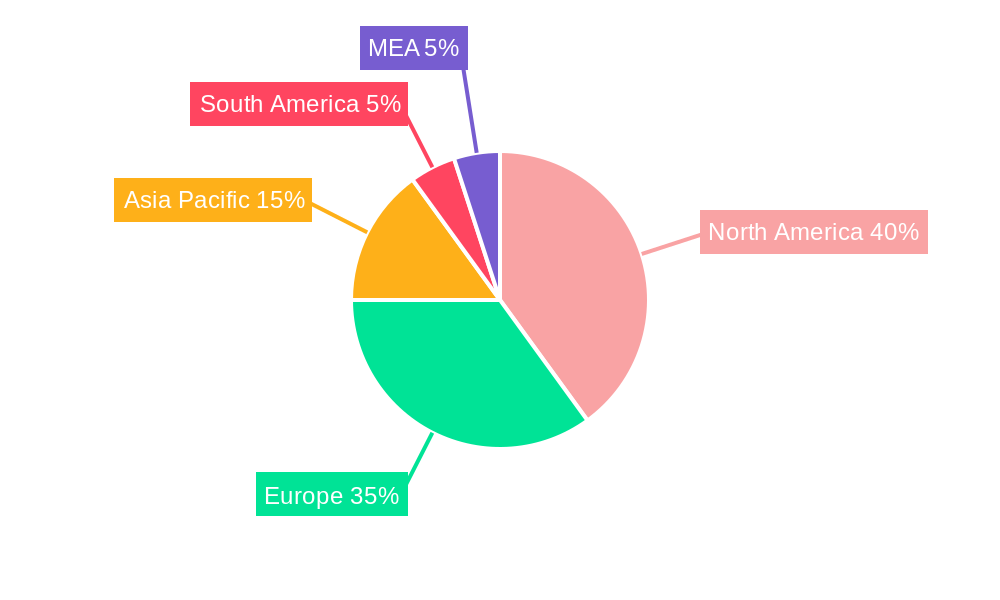
The North American market currently dominates the global Sports Analytics Market, driven by the popularity of major professional leagues (NFL, NBA, MLB) and the high adoption of advanced analytics in these leagues. Europe and Asia-Pacific are also experiencing significant growth, fueled by increasing investment in sports infrastructure and the growing popularity of various sports across these regions. Within sports segments, Football (soccer) holds the largest market share, driven by the global reach of the sport and the significant volume of data generated.
- North America: High market maturity, significant investment in sports analytics, and strong presence of major tech companies.
- Europe: Growing adoption of analytics across various leagues and sports, with strong government support for sports development.
- Asia-Pacific: High growth potential driven by the rising popularity of sports and increasing investment in sports infrastructure.
- Football (Soccer): Largest segment by revenue due to its global popularity and extensive data availability.
- Key Drivers: Increasing investment in sports technology, growth of professional leagues, advancements in data analytics capabilities, and improved data accessibility.
Sports Analytics Market Product Landscape
The Sports Analytics market offers a diverse range of products, including data collection and tracking systems, analytics software platforms, and performance optimization tools. These products leverage advanced technologies such as AI, machine learning, and cloud computing to provide actionable insights. Key features include predictive modeling, player performance analysis, and injury prevention tools. Unique selling propositions include real-time data analysis capabilities, intuitive user interfaces, and customized solutions tailored to specific sports and organizational needs. Continuous technological advancements lead to improved accuracy, speed, and efficiency in data processing and insight generation.
Key Drivers, Barriers & Challenges in Sports Analytics Market
Key Drivers: The increasing availability of data, the rapid advancement of AI and machine learning technologies, and the growing recognition of the value of data-driven decision making within sports are primary growth drivers. The rising popularity of fantasy sports and esports further fuels the demand for more sophisticated analytics.
Key Barriers & Challenges: High implementation costs, data security and privacy concerns, a lack of skilled professionals with expertise in data analysis and sports science, and resistance to adopting new technologies by some traditional sports organizations pose significant challenges to market growth. The complexity of data analysis and interpretation can also be a barrier to adoption by smaller organizations. Data silos and integration challenges across different platforms also hamper efficient analytics implementation.
Emerging Opportunities in Sports Analytics Market
Emerging opportunities exist in expanding into untapped markets, particularly in amateur and collegiate sports. Innovative applications, like the use of wearable technology for real-time player monitoring and personalized training programs, hold significant growth potential. Evolving consumer preferences are creating opportunities for personalized content and experiences. The integration of sports analytics with fan engagement strategies and e-commerce platforms also presents exciting possibilities.
Growth Accelerators in the Sports Analytics Market Industry
Technological breakthroughs in AI, machine learning, and cloud computing are key growth catalysts. Strategic partnerships between technology providers and sports organizations will accelerate market adoption. Expanding into new markets and developing innovative applications will further propel market growth. The increasing focus on athlete health and well-being is driving demand for sophisticated injury prevention and performance optimization tools.
Key Players Shaping the Sports Analytics Market Market
- SAS Institute Inc
- Catapult Group International Ltd
- Trumedia Networks
- IBM Corporation
- Emerging Companies*List Not Exhaustive
- Stats LLC
- Opta Sports
- Tableau Software Inc
- Oracle Corporation
- Sportsradar AG
- SAP SE
Notable Milestones in Sports Analytics Market Sector
- October 2023: Texas A&M Athletics partners with Gemini Sports Analytics to leverage AI-powered analytics for athlete support and performance enhancement.
- February 2023: Gemini Sports Analytics partners with SIS (Sports Info Solutions) to integrate SIS data into Gemini's AI platform, enhancing the platform's capabilities and expanding its reach.
In-Depth Sports Analytics Market Market Outlook
The Sports Analytics Market is poised for continued robust growth, driven by technological advancements, increasing data availability, and the growing recognition of the value of data-driven decision-making in sports. Strategic partnerships, expansion into new markets, and innovative product development will be crucial for success in this dynamic market. The long-term outlook remains highly positive, with significant potential for market expansion across various sports and geographic regions.
Sports Analytics Market Segmentation
-
1. Sport
- 1.1. Football
- 1.2. Cricket
- 1.3. Hockey
- 1.4. Basketball
- 1.5. American Football
- 1.6. Other Sports
Sports Analytics Market Segmentation By Geography
- 1. North America
- 2. Europe
- 3. Asia Pacific
- 4. Latin America
- 5. Middle East and Africa
Sports Analytics Market REPORT HIGHLIGHTS
| Aspects | Details |
|---|---|
| Study Period | 2019-2033 |
| Base Year | 2024 |
| Estimated Year | 2025 |
| Forecast Period | 2025-2033 |
| Historical Period | 2019-2024 |
| Growth Rate | CAGR of 30.04% from 2019-2033 |
| Segmentation |
|
Table of Contents
- 1. Introduction
- 1.1. Research Scope
- 1.2. Market Segmentation
- 1.3. Research Methodology
- 1.4. Definitions and Assumptions
- 2. Executive Summary
- 2.1. Introduction
- 3. Market Dynamics
- 3.1. Introduction
- 3.2. Market Drivers
- 3.2.1 Rising Adoption of Big Data Analytics
- 3.2.2 AI and ML Technologies; Increase in Investments in the Newer Technologies
- 3.3. Market Restrains
- 3.3.1. Lack of Awareness About the Benefits of Sports Analytics Solutions
- 3.4. Market Trends
- 3.4.1. Football Sport is Expected to Hold Significant Market Share
- 4. Market Factor Analysis
- 4.1. Porters Five Forces
- 4.2. Supply/Value Chain
- 4.3. PESTEL analysis
- 4.4. Market Entropy
- 4.5. Patent/Trademark Analysis
- 5. Global Sports Analytics Market Analysis, Insights and Forecast, 2019-2031
- 5.1. Market Analysis, Insights and Forecast - by Sport
- 5.1.1. Football
- 5.1.2. Cricket
- 5.1.3. Hockey
- 5.1.4. Basketball
- 5.1.5. American Football
- 5.1.6. Other Sports
- 5.2. Market Analysis, Insights and Forecast - by Region
- 5.2.1. North America
- 5.2.2. Europe
- 5.2.3. Asia Pacific
- 5.2.4. Latin America
- 5.2.5. Middle East and Africa
- 5.1. Market Analysis, Insights and Forecast - by Sport
- 6. North America Sports Analytics Market Analysis, Insights and Forecast, 2019-2031
- 6.1. Market Analysis, Insights and Forecast - by Sport
- 6.1.1. Football
- 6.1.2. Cricket
- 6.1.3. Hockey
- 6.1.4. Basketball
- 6.1.5. American Football
- 6.1.6. Other Sports
- 6.1. Market Analysis, Insights and Forecast - by Sport
- 7. Europe Sports Analytics Market Analysis, Insights and Forecast, 2019-2031
- 7.1. Market Analysis, Insights and Forecast - by Sport
- 7.1.1. Football
- 7.1.2. Cricket
- 7.1.3. Hockey
- 7.1.4. Basketball
- 7.1.5. American Football
- 7.1.6. Other Sports
- 7.1. Market Analysis, Insights and Forecast - by Sport
- 8. Asia Pacific Sports Analytics Market Analysis, Insights and Forecast, 2019-2031
- 8.1. Market Analysis, Insights and Forecast - by Sport
- 8.1.1. Football
- 8.1.2. Cricket
- 8.1.3. Hockey
- 8.1.4. Basketball
- 8.1.5. American Football
- 8.1.6. Other Sports
- 8.1. Market Analysis, Insights and Forecast - by Sport
- 9. Latin America Sports Analytics Market Analysis, Insights and Forecast, 2019-2031
- 9.1. Market Analysis, Insights and Forecast - by Sport
- 9.1.1. Football
- 9.1.2. Cricket
- 9.1.3. Hockey
- 9.1.4. Basketball
- 9.1.5. American Football
- 9.1.6. Other Sports
- 9.1. Market Analysis, Insights and Forecast - by Sport
- 10. Middle East and Africa Sports Analytics Market Analysis, Insights and Forecast, 2019-2031
- 10.1. Market Analysis, Insights and Forecast - by Sport
- 10.1.1. Football
- 10.1.2. Cricket
- 10.1.3. Hockey
- 10.1.4. Basketball
- 10.1.5. American Football
- 10.1.6. Other Sports
- 10.1. Market Analysis, Insights and Forecast - by Sport
- 11. North America Sports Analytics Market Analysis, Insights and Forecast, 2019-2031
- 11.1. Market Analysis, Insights and Forecast - By Country/Sub-region
- 11.1.1 United States
- 11.1.2 Canada
- 11.1.3 Mexico
- 12. Europe Sports Analytics Market Analysis, Insights and Forecast, 2019-2031
- 12.1. Market Analysis, Insights and Forecast - By Country/Sub-region
- 12.1.1 Germany
- 12.1.2 United Kingdom
- 12.1.3 France
- 12.1.4 Spain
- 12.1.5 Italy
- 12.1.6 Spain
- 12.1.7 Belgium
- 12.1.8 Netherland
- 12.1.9 Nordics
- 12.1.10 Rest of Europe
- 13. Asia Pacific Sports Analytics Market Analysis, Insights and Forecast, 2019-2031
- 13.1. Market Analysis, Insights and Forecast - By Country/Sub-region
- 13.1.1 China
- 13.1.2 Japan
- 13.1.3 India
- 13.1.4 South Korea
- 13.1.5 Southeast Asia
- 13.1.6 Australia
- 13.1.7 Indonesia
- 13.1.8 Phillipes
- 13.1.9 Singapore
- 13.1.10 Thailandc
- 13.1.11 Rest of Asia Pacific
- 14. South America Sports Analytics Market Analysis, Insights and Forecast, 2019-2031
- 14.1. Market Analysis, Insights and Forecast - By Country/Sub-region
- 14.1.1 Brazil
- 14.1.2 Argentina
- 14.1.3 Peru
- 14.1.4 Chile
- 14.1.5 Colombia
- 14.1.6 Ecuador
- 14.1.7 Venezuela
- 14.1.8 Rest of South America
- 15. North America Sports Analytics Market Analysis, Insights and Forecast, 2019-2031
- 15.1. Market Analysis, Insights and Forecast - By Country/Sub-region
- 15.1.1 United States
- 15.1.2 Canada
- 15.1.3 Mexico
- 16. MEA Sports Analytics Market Analysis, Insights and Forecast, 2019-2031
- 16.1. Market Analysis, Insights and Forecast - By Country/Sub-region
- 16.1.1 United Arab Emirates
- 16.1.2 Saudi Arabia
- 16.1.3 South Africa
- 16.1.4 Rest of Middle East and Africa
- 17. Competitive Analysis
- 17.1. Global Market Share Analysis 2024
- 17.2. Company Profiles
- 17.2.1 SAS Institute Inc
- 17.2.1.1. Overview
- 17.2.1.2. Products
- 17.2.1.3. SWOT Analysis
- 17.2.1.4. Recent Developments
- 17.2.1.5. Financials (Based on Availability)
- 17.2.2 Catapult Group International Ltd
- 17.2.2.1. Overview
- 17.2.2.2. Products
- 17.2.2.3. SWOT Analysis
- 17.2.2.4. Recent Developments
- 17.2.2.5. Financials (Based on Availability)
- 17.2.3 Trumedia Networks
- 17.2.3.1. Overview
- 17.2.3.2. Products
- 17.2.3.3. SWOT Analysis
- 17.2.3.4. Recent Developments
- 17.2.3.5. Financials (Based on Availability)
- 17.2.4 IBM Corporation
- 17.2.4.1. Overview
- 17.2.4.2. Products
- 17.2.4.3. SWOT Analysis
- 17.2.4.4. Recent Developments
- 17.2.4.5. Financials (Based on Availability)
- 17.2.5 Emerging Companies*List Not Exhaustive
- 17.2.5.1. Overview
- 17.2.5.2. Products
- 17.2.5.3. SWOT Analysis
- 17.2.5.4. Recent Developments
- 17.2.5.5. Financials (Based on Availability)
- 17.2.6 Stats LLC
- 17.2.6.1. Overview
- 17.2.6.2. Products
- 17.2.6.3. SWOT Analysis
- 17.2.6.4. Recent Developments
- 17.2.6.5. Financials (Based on Availability)
- 17.2.7 Opta Sports
- 17.2.7.1. Overview
- 17.2.7.2. Products
- 17.2.7.3. SWOT Analysis
- 17.2.7.4. Recent Developments
- 17.2.7.5. Financials (Based on Availability)
- 17.2.8 Tableau Software Inc
- 17.2.8.1. Overview
- 17.2.8.2. Products
- 17.2.8.3. SWOT Analysis
- 17.2.8.4. Recent Developments
- 17.2.8.5. Financials (Based on Availability)
- 17.2.9 Oracle Corporation
- 17.2.9.1. Overview
- 17.2.9.2. Products
- 17.2.9.3. SWOT Analysis
- 17.2.9.4. Recent Developments
- 17.2.9.5. Financials (Based on Availability)
- 17.2.10 Sportsradar AG
- 17.2.10.1. Overview
- 17.2.10.2. Products
- 17.2.10.3. SWOT Analysis
- 17.2.10.4. Recent Developments
- 17.2.10.5. Financials (Based on Availability)
- 17.2.11 SAP SE
- 17.2.11.1. Overview
- 17.2.11.2. Products
- 17.2.11.3. SWOT Analysis
- 17.2.11.4. Recent Developments
- 17.2.11.5. Financials (Based on Availability)
- 17.2.1 SAS Institute Inc
List of Figures
- Figure 1: Global Sports Analytics Market Revenue Breakdown (Million, %) by Region 2024 & 2032
- Figure 2: North America Sports Analytics Market Revenue (Million), by Country 2024 & 2032
- Figure 3: North America Sports Analytics Market Revenue Share (%), by Country 2024 & 2032
- Figure 4: Europe Sports Analytics Market Revenue (Million), by Country 2024 & 2032
- Figure 5: Europe Sports Analytics Market Revenue Share (%), by Country 2024 & 2032
- Figure 6: Asia Pacific Sports Analytics Market Revenue (Million), by Country 2024 & 2032
- Figure 7: Asia Pacific Sports Analytics Market Revenue Share (%), by Country 2024 & 2032
- Figure 8: South America Sports Analytics Market Revenue (Million), by Country 2024 & 2032
- Figure 9: South America Sports Analytics Market Revenue Share (%), by Country 2024 & 2032
- Figure 10: North America Sports Analytics Market Revenue (Million), by Country 2024 & 2032
- Figure 11: North America Sports Analytics Market Revenue Share (%), by Country 2024 & 2032
- Figure 12: MEA Sports Analytics Market Revenue (Million), by Country 2024 & 2032
- Figure 13: MEA Sports Analytics Market Revenue Share (%), by Country 2024 & 2032
- Figure 14: North America Sports Analytics Market Revenue (Million), by Sport 2024 & 2032
- Figure 15: North America Sports Analytics Market Revenue Share (%), by Sport 2024 & 2032
- Figure 16: North America Sports Analytics Market Revenue (Million), by Country 2024 & 2032
- Figure 17: North America Sports Analytics Market Revenue Share (%), by Country 2024 & 2032
- Figure 18: Europe Sports Analytics Market Revenue (Million), by Sport 2024 & 2032
- Figure 19: Europe Sports Analytics Market Revenue Share (%), by Sport 2024 & 2032
- Figure 20: Europe Sports Analytics Market Revenue (Million), by Country 2024 & 2032
- Figure 21: Europe Sports Analytics Market Revenue Share (%), by Country 2024 & 2032
- Figure 22: Asia Pacific Sports Analytics Market Revenue (Million), by Sport 2024 & 2032
- Figure 23: Asia Pacific Sports Analytics Market Revenue Share (%), by Sport 2024 & 2032
- Figure 24: Asia Pacific Sports Analytics Market Revenue (Million), by Country 2024 & 2032
- Figure 25: Asia Pacific Sports Analytics Market Revenue Share (%), by Country 2024 & 2032
- Figure 26: Latin America Sports Analytics Market Revenue (Million), by Sport 2024 & 2032
- Figure 27: Latin America Sports Analytics Market Revenue Share (%), by Sport 2024 & 2032
- Figure 28: Latin America Sports Analytics Market Revenue (Million), by Country 2024 & 2032
- Figure 29: Latin America Sports Analytics Market Revenue Share (%), by Country 2024 & 2032
- Figure 30: Middle East and Africa Sports Analytics Market Revenue (Million), by Sport 2024 & 2032
- Figure 31: Middle East and Africa Sports Analytics Market Revenue Share (%), by Sport 2024 & 2032
- Figure 32: Middle East and Africa Sports Analytics Market Revenue (Million), by Country 2024 & 2032
- Figure 33: Middle East and Africa Sports Analytics Market Revenue Share (%), by Country 2024 & 2032
List of Tables
- Table 1: Global Sports Analytics Market Revenue Million Forecast, by Region 2019 & 2032
- Table 2: Global Sports Analytics Market Revenue Million Forecast, by Sport 2019 & 2032
- Table 3: Global Sports Analytics Market Revenue Million Forecast, by Region 2019 & 2032
- Table 4: Global Sports Analytics Market Revenue Million Forecast, by Country 2019 & 2032
- Table 5: United States Sports Analytics Market Revenue (Million) Forecast, by Application 2019 & 2032
- Table 6: Canada Sports Analytics Market Revenue (Million) Forecast, by Application 2019 & 2032
- Table 7: Mexico Sports Analytics Market Revenue (Million) Forecast, by Application 2019 & 2032
- Table 8: Global Sports Analytics Market Revenue Million Forecast, by Country 2019 & 2032
- Table 9: Germany Sports Analytics Market Revenue (Million) Forecast, by Application 2019 & 2032
- Table 10: United Kingdom Sports Analytics Market Revenue (Million) Forecast, by Application 2019 & 2032
- Table 11: France Sports Analytics Market Revenue (Million) Forecast, by Application 2019 & 2032
- Table 12: Spain Sports Analytics Market Revenue (Million) Forecast, by Application 2019 & 2032
- Table 13: Italy Sports Analytics Market Revenue (Million) Forecast, by Application 2019 & 2032
- Table 14: Spain Sports Analytics Market Revenue (Million) Forecast, by Application 2019 & 2032
- Table 15: Belgium Sports Analytics Market Revenue (Million) Forecast, by Application 2019 & 2032
- Table 16: Netherland Sports Analytics Market Revenue (Million) Forecast, by Application 2019 & 2032
- Table 17: Nordics Sports Analytics Market Revenue (Million) Forecast, by Application 2019 & 2032
- Table 18: Rest of Europe Sports Analytics Market Revenue (Million) Forecast, by Application 2019 & 2032
- Table 19: Global Sports Analytics Market Revenue Million Forecast, by Country 2019 & 2032
- Table 20: China Sports Analytics Market Revenue (Million) Forecast, by Application 2019 & 2032
- Table 21: Japan Sports Analytics Market Revenue (Million) Forecast, by Application 2019 & 2032
- Table 22: India Sports Analytics Market Revenue (Million) Forecast, by Application 2019 & 2032
- Table 23: South Korea Sports Analytics Market Revenue (Million) Forecast, by Application 2019 & 2032
- Table 24: Southeast Asia Sports Analytics Market Revenue (Million) Forecast, by Application 2019 & 2032
- Table 25: Australia Sports Analytics Market Revenue (Million) Forecast, by Application 2019 & 2032
- Table 26: Indonesia Sports Analytics Market Revenue (Million) Forecast, by Application 2019 & 2032
- Table 27: Phillipes Sports Analytics Market Revenue (Million) Forecast, by Application 2019 & 2032
- Table 28: Singapore Sports Analytics Market Revenue (Million) Forecast, by Application 2019 & 2032
- Table 29: Thailandc Sports Analytics Market Revenue (Million) Forecast, by Application 2019 & 2032
- Table 30: Rest of Asia Pacific Sports Analytics Market Revenue (Million) Forecast, by Application 2019 & 2032
- Table 31: Global Sports Analytics Market Revenue Million Forecast, by Country 2019 & 2032
- Table 32: Brazil Sports Analytics Market Revenue (Million) Forecast, by Application 2019 & 2032
- Table 33: Argentina Sports Analytics Market Revenue (Million) Forecast, by Application 2019 & 2032
- Table 34: Peru Sports Analytics Market Revenue (Million) Forecast, by Application 2019 & 2032
- Table 35: Chile Sports Analytics Market Revenue (Million) Forecast, by Application 2019 & 2032
- Table 36: Colombia Sports Analytics Market Revenue (Million) Forecast, by Application 2019 & 2032
- Table 37: Ecuador Sports Analytics Market Revenue (Million) Forecast, by Application 2019 & 2032
- Table 38: Venezuela Sports Analytics Market Revenue (Million) Forecast, by Application 2019 & 2032
- Table 39: Rest of South America Sports Analytics Market Revenue (Million) Forecast, by Application 2019 & 2032
- Table 40: Global Sports Analytics Market Revenue Million Forecast, by Country 2019 & 2032
- Table 41: United States Sports Analytics Market Revenue (Million) Forecast, by Application 2019 & 2032
- Table 42: Canada Sports Analytics Market Revenue (Million) Forecast, by Application 2019 & 2032
- Table 43: Mexico Sports Analytics Market Revenue (Million) Forecast, by Application 2019 & 2032
- Table 44: Global Sports Analytics Market Revenue Million Forecast, by Country 2019 & 2032
- Table 45: United Arab Emirates Sports Analytics Market Revenue (Million) Forecast, by Application 2019 & 2032
- Table 46: Saudi Arabia Sports Analytics Market Revenue (Million) Forecast, by Application 2019 & 2032
- Table 47: South Africa Sports Analytics Market Revenue (Million) Forecast, by Application 2019 & 2032
- Table 48: Rest of Middle East and Africa Sports Analytics Market Revenue (Million) Forecast, by Application 2019 & 2032
- Table 49: Global Sports Analytics Market Revenue Million Forecast, by Sport 2019 & 2032
- Table 50: Global Sports Analytics Market Revenue Million Forecast, by Country 2019 & 2032
- Table 51: Global Sports Analytics Market Revenue Million Forecast, by Sport 2019 & 2032
- Table 52: Global Sports Analytics Market Revenue Million Forecast, by Country 2019 & 2032
- Table 53: Global Sports Analytics Market Revenue Million Forecast, by Sport 2019 & 2032
- Table 54: Global Sports Analytics Market Revenue Million Forecast, by Country 2019 & 2032
- Table 55: Global Sports Analytics Market Revenue Million Forecast, by Sport 2019 & 2032
- Table 56: Global Sports Analytics Market Revenue Million Forecast, by Country 2019 & 2032
- Table 57: Global Sports Analytics Market Revenue Million Forecast, by Sport 2019 & 2032
- Table 58: Global Sports Analytics Market Revenue Million Forecast, by Country 2019 & 2032
Frequently Asked Questions
1. What is the projected Compound Annual Growth Rate (CAGR) of the Sports Analytics Market?
The projected CAGR is approximately 30.04%.
2. Which companies are prominent players in the Sports Analytics Market?
Key companies in the market include SAS Institute Inc, Catapult Group International Ltd, Trumedia Networks, IBM Corporation, Emerging Companies*List Not Exhaustive, Stats LLC, Opta Sports, Tableau Software Inc, Oracle Corporation, Sportsradar AG, SAP SE.
3. What are the main segments of the Sports Analytics Market?
The market segments include Sport.
4. Can you provide details about the market size?
The market size is estimated to be USD 2.87 Million as of 2022.
5. What are some drivers contributing to market growth?
Rising Adoption of Big Data Analytics. AI and ML Technologies; Increase in Investments in the Newer Technologies.
6. What are the notable trends driving market growth?
Football Sport is Expected to Hold Significant Market Share.
7. Are there any restraints impacting market growth?
Lack of Awareness About the Benefits of Sports Analytics Solutions.
8. Can you provide examples of recent developments in the market?
October 2023, Texas A&M Athletics Sports Science announced that it has entered into an arrangement with Gemini Sports Analytics to offer the Aggies' staff Gemini’s AI software platform built-for sports that is projected to empower the Aggies to access prognostic analytics in addition to metrics to aid support student-athletes. The Gemini application authorizes stakeholders by offering predictive data analytics to the end users, cumulative interdisciplinary professionals' efficiency, and permitting high-level decision-makers to make game-changing choices faster.
9. What pricing options are available for accessing the report?
Pricing options include single-user, multi-user, and enterprise licenses priced at USD 4750, USD 5250, and USD 8750 respectively.
10. Is the market size provided in terms of value or volume?
The market size is provided in terms of value, measured in Million.
11. Are there any specific market keywords associated with the report?
Yes, the market keyword associated with the report is "Sports Analytics Market," which aids in identifying and referencing the specific market segment covered.
12. How do I determine which pricing option suits my needs best?
The pricing options vary based on user requirements and access needs. Individual users may opt for single-user licenses, while businesses requiring broader access may choose multi-user or enterprise licenses for cost-effective access to the report.
13. Are there any additional resources or data provided in the Sports Analytics Market report?
While the report offers comprehensive insights, it's advisable to review the specific contents or supplementary materials provided to ascertain if additional resources or data are available.
14. How can I stay updated on further developments or reports in the Sports Analytics Market?
To stay informed about further developments, trends, and reports in the Sports Analytics Market, consider subscribing to industry newsletters, following relevant companies and organizations, or regularly checking reputable industry news sources and publications.
Methodology
Step 1 - Identification of Relevant Samples Size from Population Database


Step 2 - Approaches for Defining Global Market Size (Value, Volume* & Price*)

Note*: In applicable scenarios
Step 3 - Data Sources
Primary Research
- Web Analytics
- Survey Reports
- Research Institute
- Latest Research Reports
- Opinion Leaders
Secondary Research
- Annual Reports
- White Paper
- Latest Press Release
- Industry Association
- Paid Database
- Investor Presentations

Step 4 - Data Triangulation
Involves using different sources of information in order to increase the validity of a study
These sources are likely to be stakeholders in a program - participants, other researchers, program staff, other community members, and so on.
Then we put all data in single framework & apply various statistical tools to find out the dynamic on the market.
During the analysis stage, feedback from the stakeholder groups would be compared to determine areas of agreement as well as areas of divergence
