

Key Insights
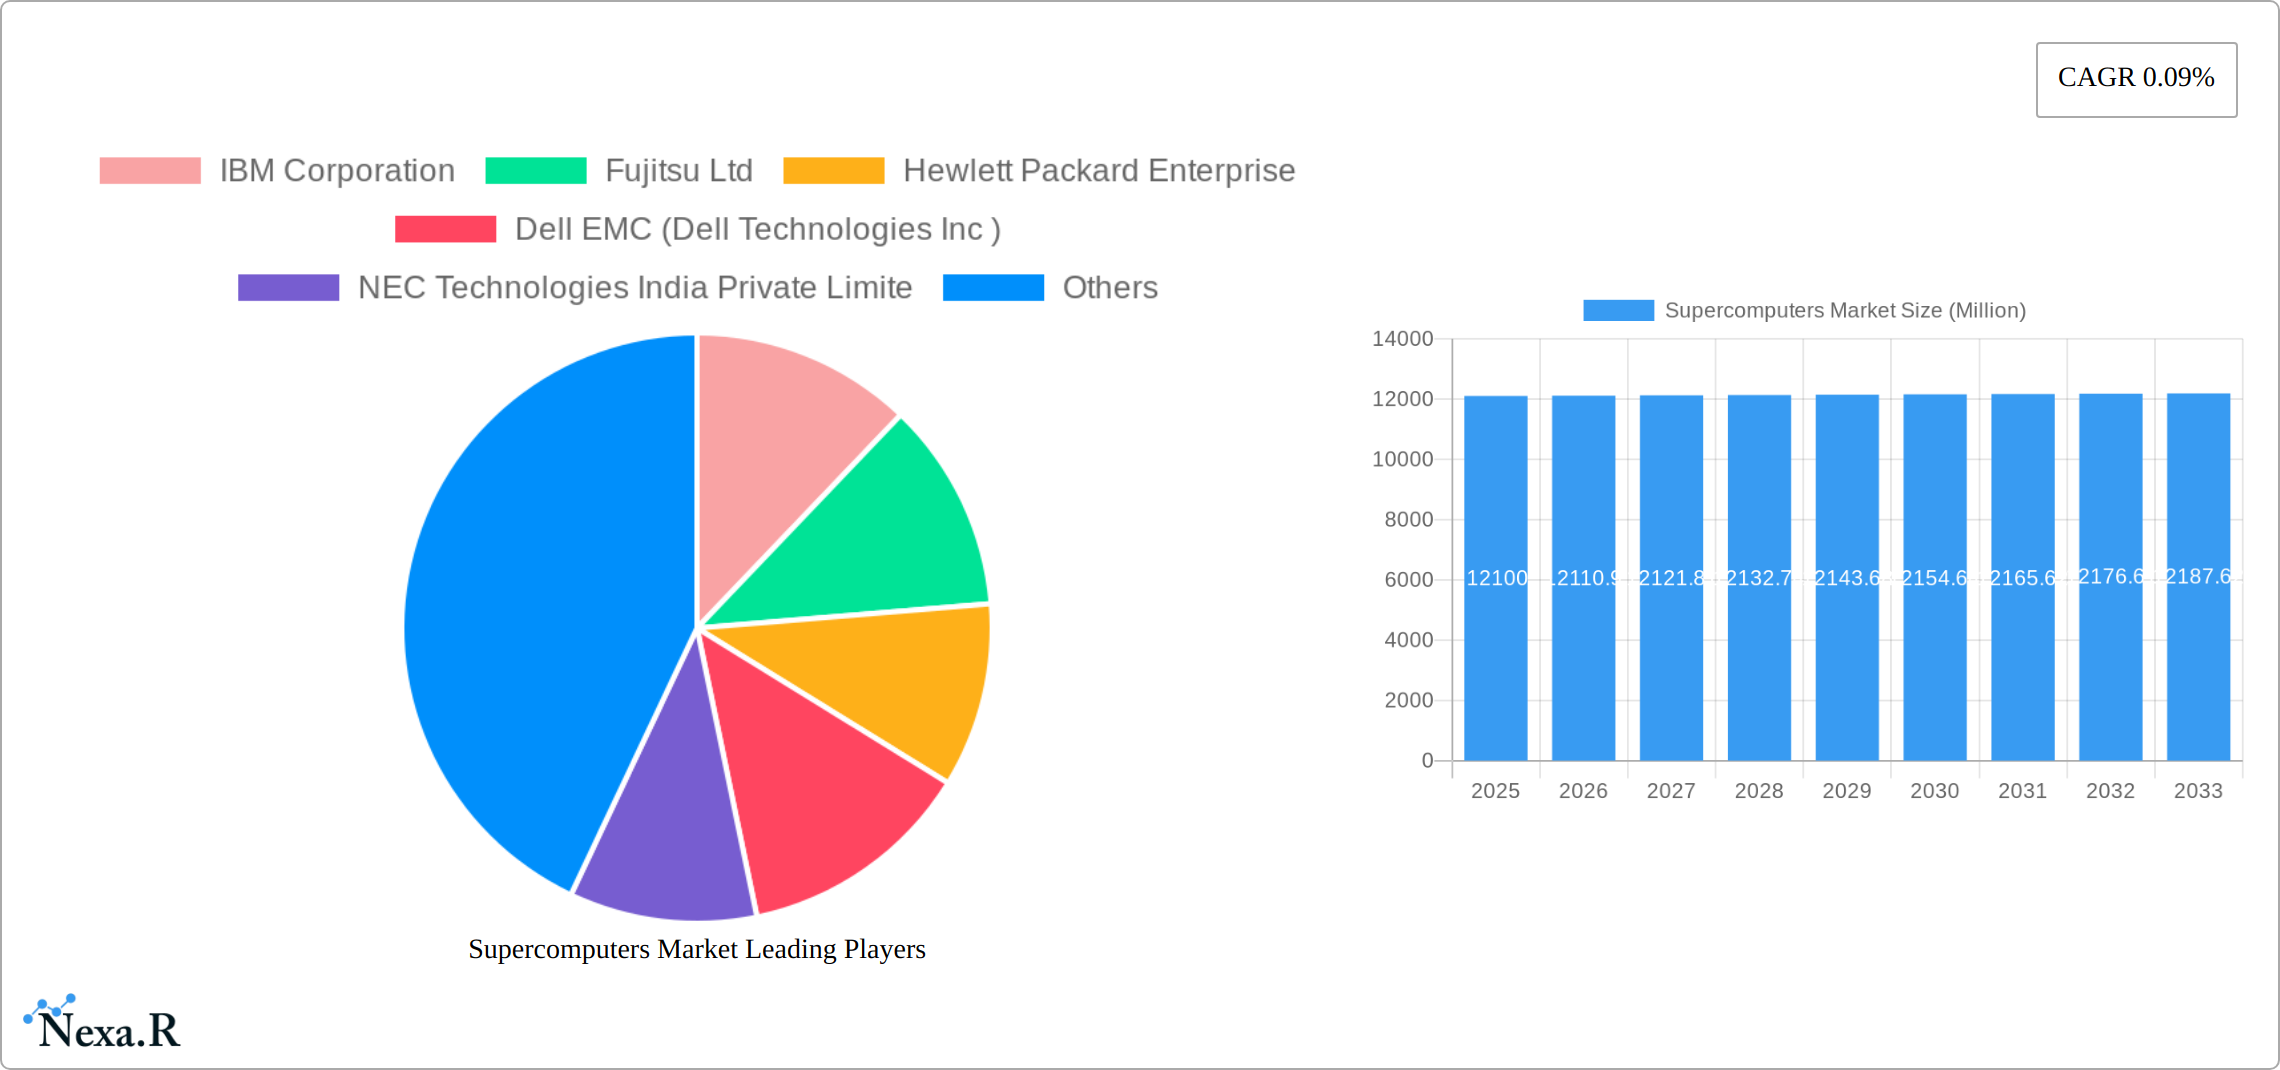
The global supercomputer market, valued at $12.10 billion in 2025, is projected to experience steady growth, driven primarily by increasing demand from commercial industries, government entities, and research institutions. The market's Compound Annual Growth Rate (CAGR) of 0.09 indicates a relatively stable expansion, though this modest growth rate suggests a mature market with established players and potentially slowing innovation cycles. Key drivers include the need for high-performance computing in areas like artificial intelligence, machine learning, big data analytics, weather forecasting, and scientific research. Emerging trends such as the adoption of cloud-based supercomputing solutions and advancements in processor technology, particularly with the emergence of exascale computing, are likely to influence future growth trajectories. However, restraints could include high initial investment costs, the need for specialized expertise to operate and maintain these systems, and potential limitations in power consumption and cooling requirements for the most powerful systems.
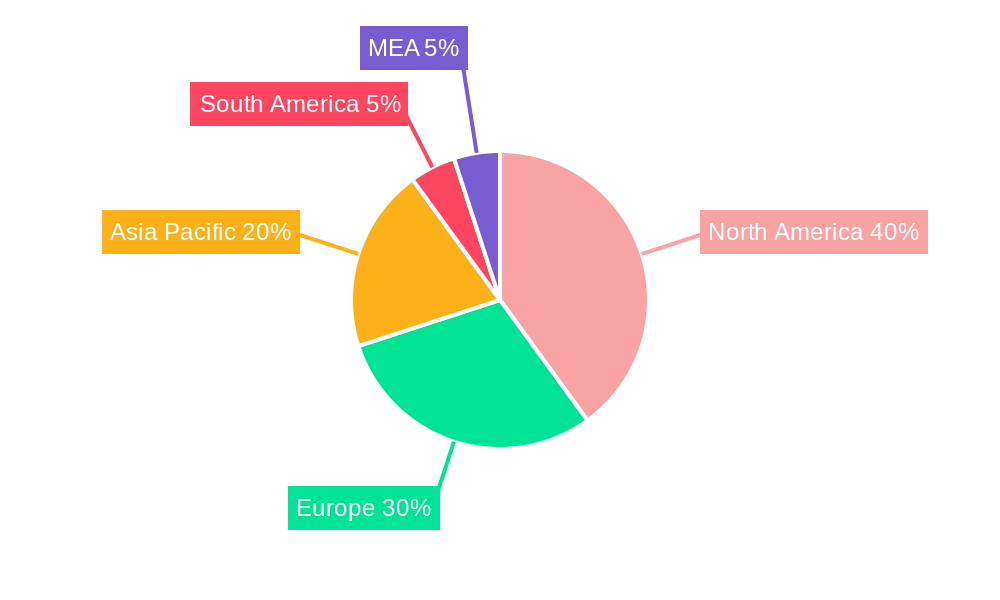
The market's segmentation by end-user reveals a diverse customer base. Commercial industries, especially in finance and technology, are significant consumers, utilizing supercomputers for complex simulations, risk modeling, and data analysis. Government entities, particularly defense and intelligence agencies, rely on supercomputers for national security applications, while research institutions utilize them for groundbreaking scientific discovery. Leading players like IBM, Fujitsu, Hewlett Packard Enterprise, Dell Technologies, NEC, Atos, Lenovo, and Intel are fiercely competitive, constantly innovating to maintain market share. Regional market analysis reveals strong presence in North America and Europe, with Asia-Pacific expected to show considerable growth over the forecast period driven by rising investments in R&D and technological advancements in key economies like China, Japan, and India. The study period (2019-2033) provides a comprehensive view of past performance and future potential, with the focus on the forecast period of 2025-2033 offering valuable insights for strategic decision-making.
Supercomputers Market: A Comprehensive Report (2019-2033)
This in-depth report provides a comprehensive analysis of the global supercomputers market, encompassing market dynamics, growth trends, regional dominance, product landscape, key players, and future outlook. The study period spans from 2019 to 2033, with 2025 serving as the base and estimated year. The report analyzes the parent market of High-Performance Computing (HPC) and its child market of Supercomputers, offering granular insights into this rapidly evolving sector. The market size is valued in million USD.
Supercomputers Market Dynamics & Structure
The supercomputer market is characterized by high concentration, with a few major players dominating the landscape. Market share is estimated at xx% for the top three players in 2025. Technological innovation, particularly in areas like AI acceleration and exascale computing, is a key driver, spurred by increasing demand from research institutions and commercial industries. Regulatory frameworks, including government funding for research and development, significantly influence market growth. While cloud computing presents a competitive substitute for certain applications, the need for extreme processing power continues to fuel supercomputer adoption. M&A activity in the sector is moderate, with xx major deals recorded between 2019 and 2024.
- Market Concentration: High, with top 3 players holding xx% market share in 2025.
- Technological Innovation: Focus on AI acceleration, exascale computing, and energy efficiency.
- Regulatory Landscape: Government funding and research initiatives drive market growth.
- Competitive Substitutes: Cloud computing offers partial substitution, but dedicated supercomputers remain essential.
- End-User Demographics: Strong growth in commercial industries and government entities.
- M&A Activity: Moderate activity with xx major deals between 2019-2024.
Supercomputers Market Growth Trends & Insights
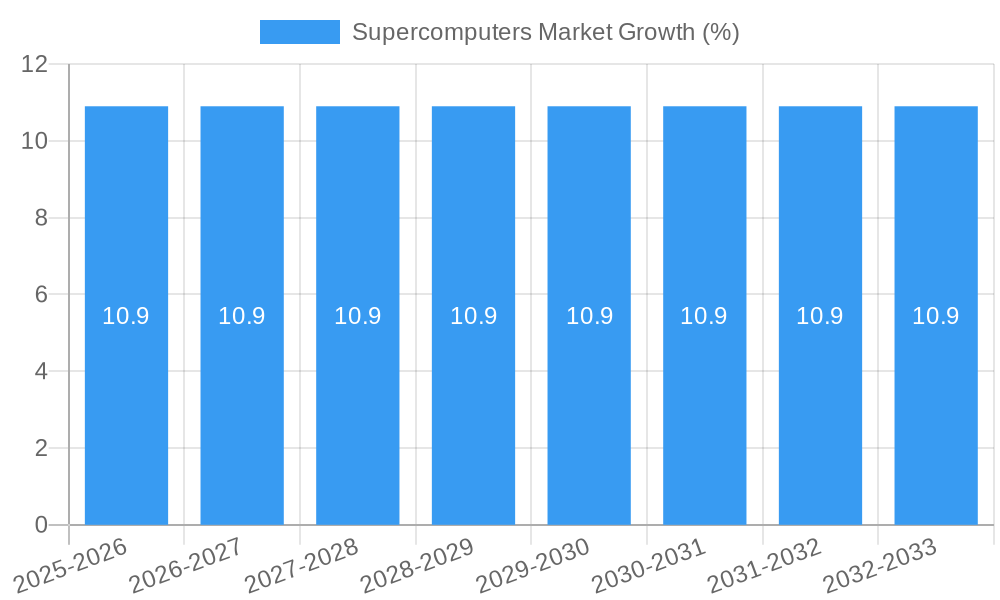
The supercomputers market experienced a CAGR of xx% during the historical period (2019-2024) and is projected to maintain a CAGR of xx% during the forecast period (2025-2033). Market size is estimated at XXX million USD in 2025 and is expected to reach YYY million USD by 2033. This growth is propelled by the increasing demand for high-performance computing across various sectors, including scientific research, weather forecasting, financial modeling, and drug discovery. Technological advancements in processor architectures, memory technologies, and interconnect technologies are further driving market adoption. Shifting consumer behavior towards data-driven decision-making and the rise of big data analytics are contributing factors to this expansion. The market penetration rate is currently at xx% and is expected to increase to xx% by 2033.
Dominant Regions, Countries, or Segments in Supercomputers Market
North America currently holds the largest market share in the supercomputer market, driven by strong government investment in research and development and the presence of major technology companies. However, Asia-Pacific is projected to witness the highest growth rate during the forecast period, fueled by increasing investments in HPC infrastructure and expanding research activities in China and other Asian economies. Within end-user segments, Government Entities currently lead, with a substantial share attributed to national security and scientific research initiatives. However, the Commercial Industries segment is poised for significant growth, driven by rising adoption of HPC for data analytics, AI, and machine learning.
- North America: Dominant market share due to strong government investment and established tech companies.
- Asia-Pacific: Highest projected growth rate, driven by increasing investment in HPC infrastructure.
- Government Entities: Currently the largest end-user segment.
- Commercial Industries: Fastest-growing segment due to increased adoption of HPC for various applications.
Supercomputers Market Product Landscape
Supercomputers are characterized by high processing power, massive memory capacity, and high-speed interconnects. Recent innovations focus on energy-efficient architectures, specialized processors for AI and machine learning, and advancements in cooling technologies. These advancements enable improved performance metrics such as FLOPS (floating-point operations per second) and memory bandwidth, allowing for faster processing of complex simulations and data analysis tasks. Unique selling propositions often center around specific application optimizations or innovative cooling solutions that deliver superior performance and energy efficiency.
Key Drivers, Barriers & Challenges in Supercomputers Market
Key Drivers:
- Increased demand for high-performance computing across diverse industries.
- Advancements in processor technologies and memory capacities.
- Government funding and initiatives promoting HPC adoption.
Key Challenges:
- High initial investment costs and maintenance expenses.
- Complexity of system integration and management.
- Limited availability of skilled professionals to manage and operate these systems. The shortage of skilled personnel impacts implementation and creates a bottleneck, potentially slowing market growth by xx% in the short term.
- Supply chain disruptions can delay projects and increase costs.
Emerging Opportunities in Supercomputers Market
- Expanding applications in areas like genomics, materials science, and climate modeling.
- Growing demand for cloud-based supercomputing services.
- Development of specialized supercomputers for AI and machine learning.
Growth Accelerators in the Supercomputers Market Industry
Technological breakthroughs in areas like quantum computing and neuromorphic computing hold immense potential to transform the supercomputer landscape. Strategic partnerships between technology vendors and research institutions are crucial for driving innovation and accelerating market expansion. Government initiatives focusing on promoting the adoption of HPC for national priorities, such as climate change research and national security, can further amplify market growth.
Key Players Shaping the Supercomputers Market Market
- IBM Corporation
- Fujitsu Ltd
- Hewlett Packard Enterprise
- Dell EMC (Dell Technologies Inc)
- NEC Technologies India Private Limite
- Atos SE
- Lenovo Inc
- Intel Corporation
Notable Milestones in Supercomputers Market Sector
- 2020: Launch of the first exascale supercomputer.
- 2022: Significant increase in government funding for HPC research in several countries.
- 2023: Major merger between two key players in the supercomputer market. (xx details)
- 2024: Several significant new supercomputer installations across various research institutions.
In-Depth Supercomputers Market Market Outlook
The future of the supercomputer market appears bright, driven by sustained technological innovation, increasing demand from various sectors, and supportive government policies. Strategic investments in R&D, coupled with strategic partnerships and collaborations, will be crucial for capturing the significant market potential. The market is expected to witness continued growth across all major regions, with the Asia-Pacific region expected to emerge as a key growth driver. The focus on energy-efficient supercomputers and the integration of AI technologies will be key aspects shaping the future of this dynamic market.
Supercomputers Market Segmentation
-
1. End User
- 1.1. Commercial Industries
- 1.2. Government Entities
- 1.3. Research Institutions
Supercomputers Market Segmentation By Geography
- 1. North America
- 2. Europe
- 3. Asia
- 4. Australia and New Zealand
- 5. Latin America
- 6. Middle East and Africa
Supercomputers Market REPORT HIGHLIGHTS
| Aspects | Details |
|---|---|
| Study Period | 2019-2033 |
| Base Year | 2024 |
| Estimated Year | 2025 |
| Forecast Period | 2025-2033 |
| Historical Period | 2019-2024 |
| Growth Rate | CAGR of 0.09% from 2019-2033 |
| Segmentation |
|
Table of Contents
- 1. Introduction
- 1.1. Research Scope
- 1.2. Market Segmentation
- 1.3. Research Methodology
- 1.4. Definitions and Assumptions
- 2. Executive Summary
- 2.1. Introduction
- 3. Market Dynamics
- 3.1. Introduction
- 3.2. Market Drivers
- 3.2.1. Increasing Demand for Higher Processing Power; Increasing Investments in Research
- 3.3. Market Restrains
- 3.3.1. High Initial Setup Cost; Large Installation Space
- 3.4. Market Trends
- 3.4.1. Increasing Demand for Higher Processing Power to Drive the Market
- 4. Market Factor Analysis
- 4.1. Porters Five Forces
- 4.2. Supply/Value Chain
- 4.3. PESTEL analysis
- 4.4. Market Entropy
- 4.5. Patent/Trademark Analysis
- 5. Global Supercomputers Market Analysis, Insights and Forecast, 2019-2031
- 5.1. Market Analysis, Insights and Forecast - by End User
- 5.1.1. Commercial Industries
- 5.1.2. Government Entities
- 5.1.3. Research Institutions
- 5.2. Market Analysis, Insights and Forecast - by Region
- 5.2.1. North America
- 5.2.2. Europe
- 5.2.3. Asia
- 5.2.4. Australia and New Zealand
- 5.2.5. Latin America
- 5.2.6. Middle East and Africa
- 5.1. Market Analysis, Insights and Forecast - by End User
- 6. North America Supercomputers Market Analysis, Insights and Forecast, 2019-2031
- 6.1. Market Analysis, Insights and Forecast - by End User
- 6.1.1. Commercial Industries
- 6.1.2. Government Entities
- 6.1.3. Research Institutions
- 6.1. Market Analysis, Insights and Forecast - by End User
- 7. Europe Supercomputers Market Analysis, Insights and Forecast, 2019-2031
- 7.1. Market Analysis, Insights and Forecast - by End User
- 7.1.1. Commercial Industries
- 7.1.2. Government Entities
- 7.1.3. Research Institutions
- 7.1. Market Analysis, Insights and Forecast - by End User
- 8. Asia Supercomputers Market Analysis, Insights and Forecast, 2019-2031
- 8.1. Market Analysis, Insights and Forecast - by End User
- 8.1.1. Commercial Industries
- 8.1.2. Government Entities
- 8.1.3. Research Institutions
- 8.1. Market Analysis, Insights and Forecast - by End User
- 9. Australia and New Zealand Supercomputers Market Analysis, Insights and Forecast, 2019-2031
- 9.1. Market Analysis, Insights and Forecast - by End User
- 9.1.1. Commercial Industries
- 9.1.2. Government Entities
- 9.1.3. Research Institutions
- 9.1. Market Analysis, Insights and Forecast - by End User
- 10. Latin America Supercomputers Market Analysis, Insights and Forecast, 2019-2031
- 10.1. Market Analysis, Insights and Forecast - by End User
- 10.1.1. Commercial Industries
- 10.1.2. Government Entities
- 10.1.3. Research Institutions
- 10.1. Market Analysis, Insights and Forecast - by End User
- 11. Middle East and Africa Supercomputers Market Analysis, Insights and Forecast, 2019-2031
- 11.1. Market Analysis, Insights and Forecast - by End User
- 11.1.1. Commercial Industries
- 11.1.2. Government Entities
- 11.1.3. Research Institutions
- 11.1. Market Analysis, Insights and Forecast - by End User
- 12. North America Supercomputers Market Analysis, Insights and Forecast, 2019-2031
- 12.1. Market Analysis, Insights and Forecast - By Country/Sub-region
- 12.1.1 United States
- 12.1.2 Canada
- 12.1.3 Mexico
- 13. Europe Supercomputers Market Analysis, Insights and Forecast, 2019-2031
- 13.1. Market Analysis, Insights and Forecast - By Country/Sub-region
- 13.1.1 Germany
- 13.1.2 United Kingdom
- 13.1.3 France
- 13.1.4 Spain
- 13.1.5 Italy
- 13.1.6 Spain
- 13.1.7 Belgium
- 13.1.8 Netherland
- 13.1.9 Nordics
- 13.1.10 Rest of Europe
- 14. Asia Pacific Supercomputers Market Analysis, Insights and Forecast, 2019-2031
- 14.1. Market Analysis, Insights and Forecast - By Country/Sub-region
- 14.1.1 China
- 14.1.2 Japan
- 14.1.3 India
- 14.1.4 South Korea
- 14.1.5 Southeast Asia
- 14.1.6 Australia
- 14.1.7 Indonesia
- 14.1.8 Phillipes
- 14.1.9 Singapore
- 14.1.10 Thailandc
- 14.1.11 Rest of Asia Pacific
- 15. South America Supercomputers Market Analysis, Insights and Forecast, 2019-2031
- 15.1. Market Analysis, Insights and Forecast - By Country/Sub-region
- 15.1.1 Brazil
- 15.1.2 Argentina
- 15.1.3 Peru
- 15.1.4 Chile
- 15.1.5 Colombia
- 15.1.6 Ecuador
- 15.1.7 Venezuela
- 15.1.8 Rest of South America
- 16. North America Supercomputers Market Analysis, Insights and Forecast, 2019-2031
- 16.1. Market Analysis, Insights and Forecast - By Country/Sub-region
- 16.1.1 United States
- 16.1.2 Canada
- 16.1.3 Mexico
- 17. MEA Supercomputers Market Analysis, Insights and Forecast, 2019-2031
- 17.1. Market Analysis, Insights and Forecast - By Country/Sub-region
- 17.1.1 United Arab Emirates
- 17.1.2 Saudi Arabia
- 17.1.3 South Africa
- 17.1.4 Rest of Middle East and Africa
- 18. Competitive Analysis
- 18.1. Global Market Share Analysis 2024
- 18.2. Company Profiles
- 18.2.1 IBM Corporation
- 18.2.1.1. Overview
- 18.2.1.2. Products
- 18.2.1.3. SWOT Analysis
- 18.2.1.4. Recent Developments
- 18.2.1.5. Financials (Based on Availability)
- 18.2.2 Fujitsu Ltd
- 18.2.2.1. Overview
- 18.2.2.2. Products
- 18.2.2.3. SWOT Analysis
- 18.2.2.4. Recent Developments
- 18.2.2.5. Financials (Based on Availability)
- 18.2.3 Hewlett Packard Enterprise
- 18.2.3.1. Overview
- 18.2.3.2. Products
- 18.2.3.3. SWOT Analysis
- 18.2.3.4. Recent Developments
- 18.2.3.5. Financials (Based on Availability)
- 18.2.4 Dell EMC (Dell Technologies Inc )
- 18.2.4.1. Overview
- 18.2.4.2. Products
- 18.2.4.3. SWOT Analysis
- 18.2.4.4. Recent Developments
- 18.2.4.5. Financials (Based on Availability)
- 18.2.5 NEC Technologies India Private Limite
- 18.2.5.1. Overview
- 18.2.5.2. Products
- 18.2.5.3. SWOT Analysis
- 18.2.5.4. Recent Developments
- 18.2.5.5. Financials (Based on Availability)
- 18.2.6 Atos SE
- 18.2.6.1. Overview
- 18.2.6.2. Products
- 18.2.6.3. SWOT Analysis
- 18.2.6.4. Recent Developments
- 18.2.6.5. Financials (Based on Availability)
- 18.2.7 Lenovo Inc
- 18.2.7.1. Overview
- 18.2.7.2. Products
- 18.2.7.3. SWOT Analysis
- 18.2.7.4. Recent Developments
- 18.2.7.5. Financials (Based on Availability)
- 18.2.8 Intel Corporation
- 18.2.8.1. Overview
- 18.2.8.2. Products
- 18.2.8.3. SWOT Analysis
- 18.2.8.4. Recent Developments
- 18.2.8.5. Financials (Based on Availability)
- 18.2.1 IBM Corporation
List of Figures
- Figure 1: Global Supercomputers Market Revenue Breakdown (Million, %) by Region 2024 & 2032
- Figure 2: Global Supercomputers Market Volume Breakdown (K Unit, %) by Region 2024 & 2032
- Figure 3: North America Supercomputers Market Revenue (Million), by Country 2024 & 2032
- Figure 4: North America Supercomputers Market Volume (K Unit), by Country 2024 & 2032
- Figure 5: North America Supercomputers Market Revenue Share (%), by Country 2024 & 2032
- Figure 6: North America Supercomputers Market Volume Share (%), by Country 2024 & 2032
- Figure 7: Europe Supercomputers Market Revenue (Million), by Country 2024 & 2032
- Figure 8: Europe Supercomputers Market Volume (K Unit), by Country 2024 & 2032
- Figure 9: Europe Supercomputers Market Revenue Share (%), by Country 2024 & 2032
- Figure 10: Europe Supercomputers Market Volume Share (%), by Country 2024 & 2032
- Figure 11: Asia Pacific Supercomputers Market Revenue (Million), by Country 2024 & 2032
- Figure 12: Asia Pacific Supercomputers Market Volume (K Unit), by Country 2024 & 2032
- Figure 13: Asia Pacific Supercomputers Market Revenue Share (%), by Country 2024 & 2032
- Figure 14: Asia Pacific Supercomputers Market Volume Share (%), by Country 2024 & 2032
- Figure 15: South America Supercomputers Market Revenue (Million), by Country 2024 & 2032
- Figure 16: South America Supercomputers Market Volume (K Unit), by Country 2024 & 2032
- Figure 17: South America Supercomputers Market Revenue Share (%), by Country 2024 & 2032
- Figure 18: South America Supercomputers Market Volume Share (%), by Country 2024 & 2032
- Figure 19: North America Supercomputers Market Revenue (Million), by Country 2024 & 2032
- Figure 20: North America Supercomputers Market Volume (K Unit), by Country 2024 & 2032
- Figure 21: North America Supercomputers Market Revenue Share (%), by Country 2024 & 2032
- Figure 22: North America Supercomputers Market Volume Share (%), by Country 2024 & 2032
- Figure 23: MEA Supercomputers Market Revenue (Million), by Country 2024 & 2032
- Figure 24: MEA Supercomputers Market Volume (K Unit), by Country 2024 & 2032
- Figure 25: MEA Supercomputers Market Revenue Share (%), by Country 2024 & 2032
- Figure 26: MEA Supercomputers Market Volume Share (%), by Country 2024 & 2032
- Figure 27: North America Supercomputers Market Revenue (Million), by End User 2024 & 2032
- Figure 28: North America Supercomputers Market Volume (K Unit), by End User 2024 & 2032
- Figure 29: North America Supercomputers Market Revenue Share (%), by End User 2024 & 2032
- Figure 30: North America Supercomputers Market Volume Share (%), by End User 2024 & 2032
- Figure 31: North America Supercomputers Market Revenue (Million), by Country 2024 & 2032
- Figure 32: North America Supercomputers Market Volume (K Unit), by Country 2024 & 2032
- Figure 33: North America Supercomputers Market Revenue Share (%), by Country 2024 & 2032
- Figure 34: North America Supercomputers Market Volume Share (%), by Country 2024 & 2032
- Figure 35: Europe Supercomputers Market Revenue (Million), by End User 2024 & 2032
- Figure 36: Europe Supercomputers Market Volume (K Unit), by End User 2024 & 2032
- Figure 37: Europe Supercomputers Market Revenue Share (%), by End User 2024 & 2032
- Figure 38: Europe Supercomputers Market Volume Share (%), by End User 2024 & 2032
- Figure 39: Europe Supercomputers Market Revenue (Million), by Country 2024 & 2032
- Figure 40: Europe Supercomputers Market Volume (K Unit), by Country 2024 & 2032
- Figure 41: Europe Supercomputers Market Revenue Share (%), by Country 2024 & 2032
- Figure 42: Europe Supercomputers Market Volume Share (%), by Country 2024 & 2032
- Figure 43: Asia Supercomputers Market Revenue (Million), by End User 2024 & 2032
- Figure 44: Asia Supercomputers Market Volume (K Unit), by End User 2024 & 2032
- Figure 45: Asia Supercomputers Market Revenue Share (%), by End User 2024 & 2032
- Figure 46: Asia Supercomputers Market Volume Share (%), by End User 2024 & 2032
- Figure 47: Asia Supercomputers Market Revenue (Million), by Country 2024 & 2032
- Figure 48: Asia Supercomputers Market Volume (K Unit), by Country 2024 & 2032
- Figure 49: Asia Supercomputers Market Revenue Share (%), by Country 2024 & 2032
- Figure 50: Asia Supercomputers Market Volume Share (%), by Country 2024 & 2032
- Figure 51: Australia and New Zealand Supercomputers Market Revenue (Million), by End User 2024 & 2032
- Figure 52: Australia and New Zealand Supercomputers Market Volume (K Unit), by End User 2024 & 2032
- Figure 53: Australia and New Zealand Supercomputers Market Revenue Share (%), by End User 2024 & 2032
- Figure 54: Australia and New Zealand Supercomputers Market Volume Share (%), by End User 2024 & 2032
- Figure 55: Australia and New Zealand Supercomputers Market Revenue (Million), by Country 2024 & 2032
- Figure 56: Australia and New Zealand Supercomputers Market Volume (K Unit), by Country 2024 & 2032
- Figure 57: Australia and New Zealand Supercomputers Market Revenue Share (%), by Country 2024 & 2032
- Figure 58: Australia and New Zealand Supercomputers Market Volume Share (%), by Country 2024 & 2032
- Figure 59: Latin America Supercomputers Market Revenue (Million), by End User 2024 & 2032
- Figure 60: Latin America Supercomputers Market Volume (K Unit), by End User 2024 & 2032
- Figure 61: Latin America Supercomputers Market Revenue Share (%), by End User 2024 & 2032
- Figure 62: Latin America Supercomputers Market Volume Share (%), by End User 2024 & 2032
- Figure 63: Latin America Supercomputers Market Revenue (Million), by Country 2024 & 2032
- Figure 64: Latin America Supercomputers Market Volume (K Unit), by Country 2024 & 2032
- Figure 65: Latin America Supercomputers Market Revenue Share (%), by Country 2024 & 2032
- Figure 66: Latin America Supercomputers Market Volume Share (%), by Country 2024 & 2032
- Figure 67: Middle East and Africa Supercomputers Market Revenue (Million), by End User 2024 & 2032
- Figure 68: Middle East and Africa Supercomputers Market Volume (K Unit), by End User 2024 & 2032
- Figure 69: Middle East and Africa Supercomputers Market Revenue Share (%), by End User 2024 & 2032
- Figure 70: Middle East and Africa Supercomputers Market Volume Share (%), by End User 2024 & 2032
- Figure 71: Middle East and Africa Supercomputers Market Revenue (Million), by Country 2024 & 2032
- Figure 72: Middle East and Africa Supercomputers Market Volume (K Unit), by Country 2024 & 2032
- Figure 73: Middle East and Africa Supercomputers Market Revenue Share (%), by Country 2024 & 2032
- Figure 74: Middle East and Africa Supercomputers Market Volume Share (%), by Country 2024 & 2032
List of Tables
- Table 1: Global Supercomputers Market Revenue Million Forecast, by Region 2019 & 2032
- Table 2: Global Supercomputers Market Volume K Unit Forecast, by Region 2019 & 2032
- Table 3: Global Supercomputers Market Revenue Million Forecast, by End User 2019 & 2032
- Table 4: Global Supercomputers Market Volume K Unit Forecast, by End User 2019 & 2032
- Table 5: Global Supercomputers Market Revenue Million Forecast, by Region 2019 & 2032
- Table 6: Global Supercomputers Market Volume K Unit Forecast, by Region 2019 & 2032
- Table 7: Global Supercomputers Market Revenue Million Forecast, by Country 2019 & 2032
- Table 8: Global Supercomputers Market Volume K Unit Forecast, by Country 2019 & 2032
- Table 9: United States Supercomputers Market Revenue (Million) Forecast, by Application 2019 & 2032
- Table 10: United States Supercomputers Market Volume (K Unit) Forecast, by Application 2019 & 2032
- Table 11: Canada Supercomputers Market Revenue (Million) Forecast, by Application 2019 & 2032
- Table 12: Canada Supercomputers Market Volume (K Unit) Forecast, by Application 2019 & 2032
- Table 13: Mexico Supercomputers Market Revenue (Million) Forecast, by Application 2019 & 2032
- Table 14: Mexico Supercomputers Market Volume (K Unit) Forecast, by Application 2019 & 2032
- Table 15: Global Supercomputers Market Revenue Million Forecast, by Country 2019 & 2032
- Table 16: Global Supercomputers Market Volume K Unit Forecast, by Country 2019 & 2032
- Table 17: Germany Supercomputers Market Revenue (Million) Forecast, by Application 2019 & 2032
- Table 18: Germany Supercomputers Market Volume (K Unit) Forecast, by Application 2019 & 2032
- Table 19: United Kingdom Supercomputers Market Revenue (Million) Forecast, by Application 2019 & 2032
- Table 20: United Kingdom Supercomputers Market Volume (K Unit) Forecast, by Application 2019 & 2032
- Table 21: France Supercomputers Market Revenue (Million) Forecast, by Application 2019 & 2032
- Table 22: France Supercomputers Market Volume (K Unit) Forecast, by Application 2019 & 2032
- Table 23: Spain Supercomputers Market Revenue (Million) Forecast, by Application 2019 & 2032
- Table 24: Spain Supercomputers Market Volume (K Unit) Forecast, by Application 2019 & 2032
- Table 25: Italy Supercomputers Market Revenue (Million) Forecast, by Application 2019 & 2032
- Table 26: Italy Supercomputers Market Volume (K Unit) Forecast, by Application 2019 & 2032
- Table 27: Spain Supercomputers Market Revenue (Million) Forecast, by Application 2019 & 2032
- Table 28: Spain Supercomputers Market Volume (K Unit) Forecast, by Application 2019 & 2032
- Table 29: Belgium Supercomputers Market Revenue (Million) Forecast, by Application 2019 & 2032
- Table 30: Belgium Supercomputers Market Volume (K Unit) Forecast, by Application 2019 & 2032
- Table 31: Netherland Supercomputers Market Revenue (Million) Forecast, by Application 2019 & 2032
- Table 32: Netherland Supercomputers Market Volume (K Unit) Forecast, by Application 2019 & 2032
- Table 33: Nordics Supercomputers Market Revenue (Million) Forecast, by Application 2019 & 2032
- Table 34: Nordics Supercomputers Market Volume (K Unit) Forecast, by Application 2019 & 2032
- Table 35: Rest of Europe Supercomputers Market Revenue (Million) Forecast, by Application 2019 & 2032
- Table 36: Rest of Europe Supercomputers Market Volume (K Unit) Forecast, by Application 2019 & 2032
- Table 37: Global Supercomputers Market Revenue Million Forecast, by Country 2019 & 2032
- Table 38: Global Supercomputers Market Volume K Unit Forecast, by Country 2019 & 2032
- Table 39: China Supercomputers Market Revenue (Million) Forecast, by Application 2019 & 2032
- Table 40: China Supercomputers Market Volume (K Unit) Forecast, by Application 2019 & 2032
- Table 41: Japan Supercomputers Market Revenue (Million) Forecast, by Application 2019 & 2032
- Table 42: Japan Supercomputers Market Volume (K Unit) Forecast, by Application 2019 & 2032
- Table 43: India Supercomputers Market Revenue (Million) Forecast, by Application 2019 & 2032
- Table 44: India Supercomputers Market Volume (K Unit) Forecast, by Application 2019 & 2032
- Table 45: South Korea Supercomputers Market Revenue (Million) Forecast, by Application 2019 & 2032
- Table 46: South Korea Supercomputers Market Volume (K Unit) Forecast, by Application 2019 & 2032
- Table 47: Southeast Asia Supercomputers Market Revenue (Million) Forecast, by Application 2019 & 2032
- Table 48: Southeast Asia Supercomputers Market Volume (K Unit) Forecast, by Application 2019 & 2032
- Table 49: Australia Supercomputers Market Revenue (Million) Forecast, by Application 2019 & 2032
- Table 50: Australia Supercomputers Market Volume (K Unit) Forecast, by Application 2019 & 2032
- Table 51: Indonesia Supercomputers Market Revenue (Million) Forecast, by Application 2019 & 2032
- Table 52: Indonesia Supercomputers Market Volume (K Unit) Forecast, by Application 2019 & 2032
- Table 53: Phillipes Supercomputers Market Revenue (Million) Forecast, by Application 2019 & 2032
- Table 54: Phillipes Supercomputers Market Volume (K Unit) Forecast, by Application 2019 & 2032
- Table 55: Singapore Supercomputers Market Revenue (Million) Forecast, by Application 2019 & 2032
- Table 56: Singapore Supercomputers Market Volume (K Unit) Forecast, by Application 2019 & 2032
- Table 57: Thailandc Supercomputers Market Revenue (Million) Forecast, by Application 2019 & 2032
- Table 58: Thailandc Supercomputers Market Volume (K Unit) Forecast, by Application 2019 & 2032
- Table 59: Rest of Asia Pacific Supercomputers Market Revenue (Million) Forecast, by Application 2019 & 2032
- Table 60: Rest of Asia Pacific Supercomputers Market Volume (K Unit) Forecast, by Application 2019 & 2032
- Table 61: Global Supercomputers Market Revenue Million Forecast, by Country 2019 & 2032
- Table 62: Global Supercomputers Market Volume K Unit Forecast, by Country 2019 & 2032
- Table 63: Brazil Supercomputers Market Revenue (Million) Forecast, by Application 2019 & 2032
- Table 64: Brazil Supercomputers Market Volume (K Unit) Forecast, by Application 2019 & 2032
- Table 65: Argentina Supercomputers Market Revenue (Million) Forecast, by Application 2019 & 2032
- Table 66: Argentina Supercomputers Market Volume (K Unit) Forecast, by Application 2019 & 2032
- Table 67: Peru Supercomputers Market Revenue (Million) Forecast, by Application 2019 & 2032
- Table 68: Peru Supercomputers Market Volume (K Unit) Forecast, by Application 2019 & 2032
- Table 69: Chile Supercomputers Market Revenue (Million) Forecast, by Application 2019 & 2032
- Table 70: Chile Supercomputers Market Volume (K Unit) Forecast, by Application 2019 & 2032
- Table 71: Colombia Supercomputers Market Revenue (Million) Forecast, by Application 2019 & 2032
- Table 72: Colombia Supercomputers Market Volume (K Unit) Forecast, by Application 2019 & 2032
- Table 73: Ecuador Supercomputers Market Revenue (Million) Forecast, by Application 2019 & 2032
- Table 74: Ecuador Supercomputers Market Volume (K Unit) Forecast, by Application 2019 & 2032
- Table 75: Venezuela Supercomputers Market Revenue (Million) Forecast, by Application 2019 & 2032
- Table 76: Venezuela Supercomputers Market Volume (K Unit) Forecast, by Application 2019 & 2032
- Table 77: Rest of South America Supercomputers Market Revenue (Million) Forecast, by Application 2019 & 2032
- Table 78: Rest of South America Supercomputers Market Volume (K Unit) Forecast, by Application 2019 & 2032
- Table 79: Global Supercomputers Market Revenue Million Forecast, by Country 2019 & 2032
- Table 80: Global Supercomputers Market Volume K Unit Forecast, by Country 2019 & 2032
- Table 81: United States Supercomputers Market Revenue (Million) Forecast, by Application 2019 & 2032
- Table 82: United States Supercomputers Market Volume (K Unit) Forecast, by Application 2019 & 2032
- Table 83: Canada Supercomputers Market Revenue (Million) Forecast, by Application 2019 & 2032
- Table 84: Canada Supercomputers Market Volume (K Unit) Forecast, by Application 2019 & 2032
- Table 85: Mexico Supercomputers Market Revenue (Million) Forecast, by Application 2019 & 2032
- Table 86: Mexico Supercomputers Market Volume (K Unit) Forecast, by Application 2019 & 2032
- Table 87: Global Supercomputers Market Revenue Million Forecast, by Country 2019 & 2032
- Table 88: Global Supercomputers Market Volume K Unit Forecast, by Country 2019 & 2032
- Table 89: United Arab Emirates Supercomputers Market Revenue (Million) Forecast, by Application 2019 & 2032
- Table 90: United Arab Emirates Supercomputers Market Volume (K Unit) Forecast, by Application 2019 & 2032
- Table 91: Saudi Arabia Supercomputers Market Revenue (Million) Forecast, by Application 2019 & 2032
- Table 92: Saudi Arabia Supercomputers Market Volume (K Unit) Forecast, by Application 2019 & 2032
- Table 93: South Africa Supercomputers Market Revenue (Million) Forecast, by Application 2019 & 2032
- Table 94: South Africa Supercomputers Market Volume (K Unit) Forecast, by Application 2019 & 2032
- Table 95: Rest of Middle East and Africa Supercomputers Market Revenue (Million) Forecast, by Application 2019 & 2032
- Table 96: Rest of Middle East and Africa Supercomputers Market Volume (K Unit) Forecast, by Application 2019 & 2032
- Table 97: Global Supercomputers Market Revenue Million Forecast, by End User 2019 & 2032
- Table 98: Global Supercomputers Market Volume K Unit Forecast, by End User 2019 & 2032
- Table 99: Global Supercomputers Market Revenue Million Forecast, by Country 2019 & 2032
- Table 100: Global Supercomputers Market Volume K Unit Forecast, by Country 2019 & 2032
- Table 101: Global Supercomputers Market Revenue Million Forecast, by End User 2019 & 2032
- Table 102: Global Supercomputers Market Volume K Unit Forecast, by End User 2019 & 2032
- Table 103: Global Supercomputers Market Revenue Million Forecast, by Country 2019 & 2032
- Table 104: Global Supercomputers Market Volume K Unit Forecast, by Country 2019 & 2032
- Table 105: Global Supercomputers Market Revenue Million Forecast, by End User 2019 & 2032
- Table 106: Global Supercomputers Market Volume K Unit Forecast, by End User 2019 & 2032
- Table 107: Global Supercomputers Market Revenue Million Forecast, by Country 2019 & 2032
- Table 108: Global Supercomputers Market Volume K Unit Forecast, by Country 2019 & 2032
- Table 109: Global Supercomputers Market Revenue Million Forecast, by End User 2019 & 2032
- Table 110: Global Supercomputers Market Volume K Unit Forecast, by End User 2019 & 2032
- Table 111: Global Supercomputers Market Revenue Million Forecast, by Country 2019 & 2032
- Table 112: Global Supercomputers Market Volume K Unit Forecast, by Country 2019 & 2032
- Table 113: Global Supercomputers Market Revenue Million Forecast, by End User 2019 & 2032
- Table 114: Global Supercomputers Market Volume K Unit Forecast, by End User 2019 & 2032
- Table 115: Global Supercomputers Market Revenue Million Forecast, by Country 2019 & 2032
- Table 116: Global Supercomputers Market Volume K Unit Forecast, by Country 2019 & 2032
- Table 117: Global Supercomputers Market Revenue Million Forecast, by End User 2019 & 2032
- Table 118: Global Supercomputers Market Volume K Unit Forecast, by End User 2019 & 2032
- Table 119: Global Supercomputers Market Revenue Million Forecast, by Country 2019 & 2032
- Table 120: Global Supercomputers Market Volume K Unit Forecast, by Country 2019 & 2032
Frequently Asked Questions
1. What is the projected Compound Annual Growth Rate (CAGR) of the Supercomputers Market?
The projected CAGR is approximately 0.09%.
2. Which companies are prominent players in the Supercomputers Market?
Key companies in the market include IBM Corporation, Fujitsu Ltd, Hewlett Packard Enterprise, Dell EMC (Dell Technologies Inc ), NEC Technologies India Private Limite, Atos SE, Lenovo Inc, Intel Corporation.
3. What are the main segments of the Supercomputers Market?
The market segments include End User.
4. Can you provide details about the market size?
The market size is estimated to be USD 12.10 Million as of 2022.
5. What are some drivers contributing to market growth?
Increasing Demand for Higher Processing Power; Increasing Investments in Research.
6. What are the notable trends driving market growth?
Increasing Demand for Higher Processing Power to Drive the Market.
7. Are there any restraints impacting market growth?
High Initial Setup Cost; Large Installation Space.
8. Can you provide examples of recent developments in the market?
N/A
9. What pricing options are available for accessing the report?
Pricing options include single-user, multi-user, and enterprise licenses priced at USD 4750, USD 5250, and USD 8750 respectively.
10. Is the market size provided in terms of value or volume?
The market size is provided in terms of value, measured in Million and volume, measured in K Unit.
11. Are there any specific market keywords associated with the report?
Yes, the market keyword associated with the report is "Supercomputers Market," which aids in identifying and referencing the specific market segment covered.
12. How do I determine which pricing option suits my needs best?
The pricing options vary based on user requirements and access needs. Individual users may opt for single-user licenses, while businesses requiring broader access may choose multi-user or enterprise licenses for cost-effective access to the report.
13. Are there any additional resources or data provided in the Supercomputers Market report?
While the report offers comprehensive insights, it's advisable to review the specific contents or supplementary materials provided to ascertain if additional resources or data are available.
14. How can I stay updated on further developments or reports in the Supercomputers Market?
To stay informed about further developments, trends, and reports in the Supercomputers Market, consider subscribing to industry newsletters, following relevant companies and organizations, or regularly checking reputable industry news sources and publications.
Methodology
Step 1 - Identification of Relevant Samples Size from Population Database


Step 2 - Approaches for Defining Global Market Size (Value, Volume* & Price*)

Note*: In applicable scenarios
Step 3 - Data Sources
Primary Research
- Web Analytics
- Survey Reports
- Research Institute
- Latest Research Reports
- Opinion Leaders
Secondary Research
- Annual Reports
- White Paper
- Latest Press Release
- Industry Association
- Paid Database
- Investor Presentations

Step 4 - Data Triangulation
Involves using different sources of information in order to increase the validity of a study
These sources are likely to be stakeholders in a program - participants, other researchers, program staff, other community members, and so on.
Then we put all data in single framework & apply various statistical tools to find out the dynamic on the market.
During the analysis stage, feedback from the stakeholder groups would be compared to determine areas of agreement as well as areas of divergence
