

Key Insights
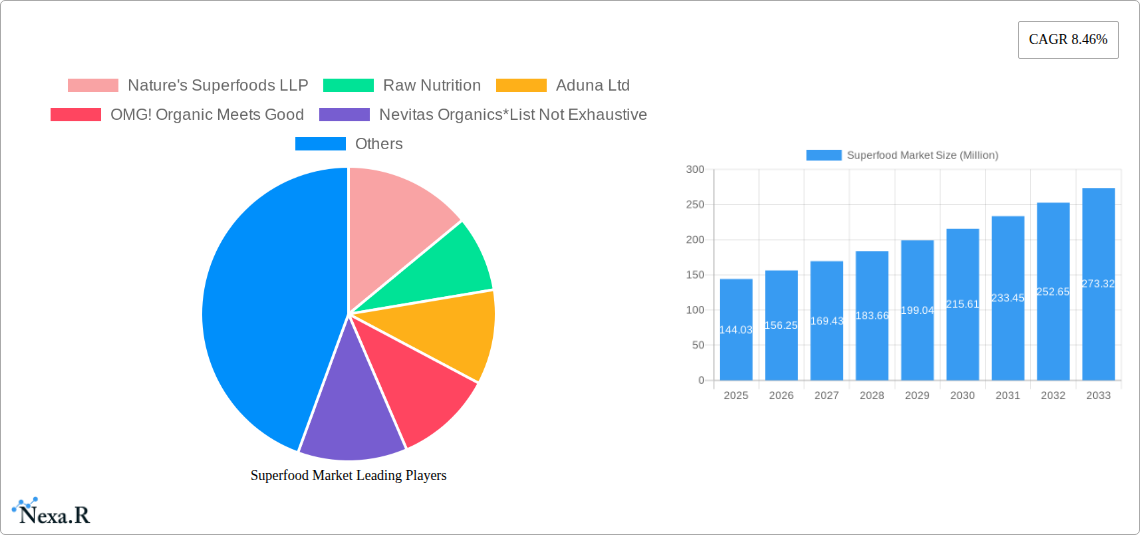
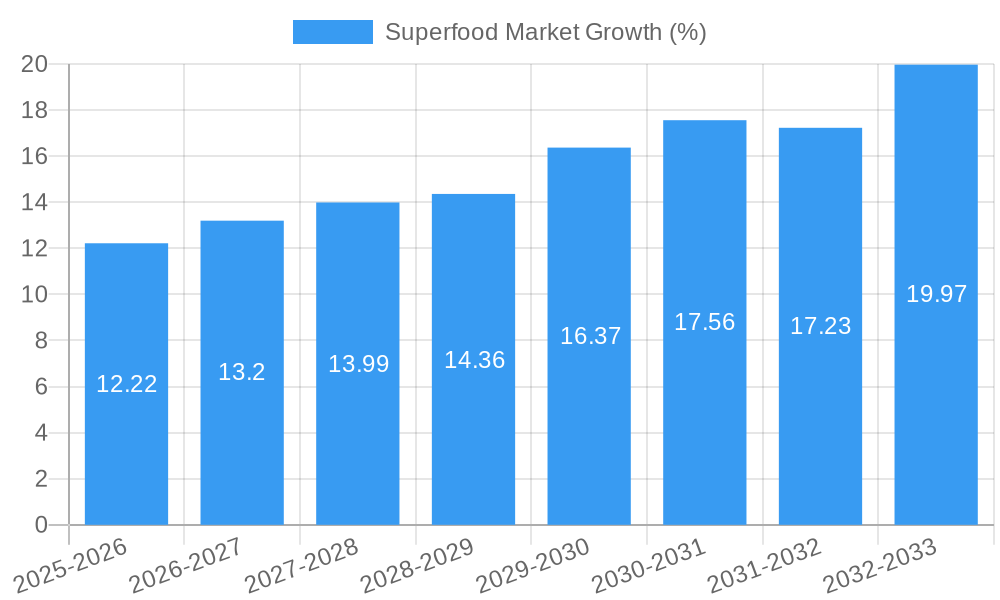
The global superfood market, valued at $144.03 million in 2025, is projected to experience robust growth, driven by a compound annual growth rate (CAGR) of 8.46% from 2025 to 2033. This expansion is fueled by several key factors. Increasing consumer awareness of health and wellness, coupled with a rising demand for natural and organic food products, significantly boosts the market. The growing prevalence of chronic diseases and a shift towards preventative healthcare further contribute to this trend. Consumers are actively seeking functional foods that offer nutritional benefits beyond basic sustenance, making superfoods an attractive option. Furthermore, the rising popularity of vegan and vegetarian diets is creating additional demand for nutrient-rich alternatives, solidifying the position of superfoods in the market. The market segmentation reveals strong growth across various superfood types, including fruits, vegetables, grains, seeds, and herbs. Online channels are witnessing significant growth as consumers increasingly prefer convenient and accessible purchasing options.
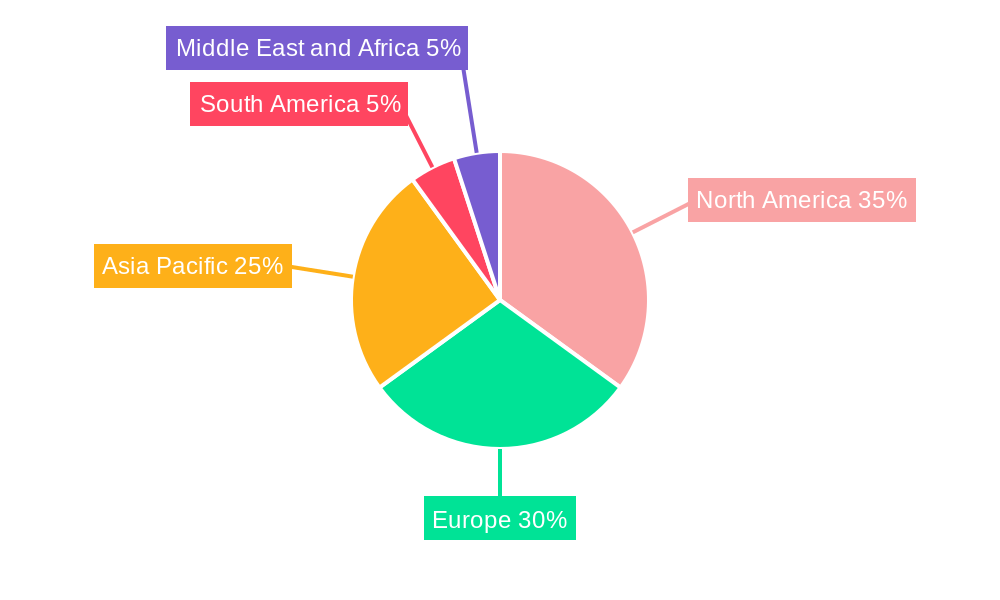
Geographic distribution shows considerable regional variations. North America and Europe currently hold significant market shares due to established health-conscious consumer bases and robust distribution networks. However, the Asia-Pacific region is anticipated to demonstrate the fastest growth rate over the forecast period, driven by rising disposable incomes and increasing awareness of superfood benefits in rapidly developing economies. The competitive landscape is marked by a mix of established players and emerging brands, reflecting the market's dynamism and potential for further innovation and expansion. Companies are focusing on product diversification, strategic partnerships, and marketing initiatives to gain a larger share of the burgeoning superfood market. While supply chain challenges and price fluctuations present some restraints, the overall market outlook remains positive, with substantial growth potential throughout the forecast period.
Superfood Market: A Comprehensive Market Report (2019-2033)
This comprehensive report provides an in-depth analysis of the global superfood market, offering invaluable insights for industry professionals, investors, and strategic decision-makers. Covering the period from 2019 to 2033, with a focus on 2025, this report meticulously examines market dynamics, growth trends, key players, and emerging opportunities within the parent market of functional foods and the child market of superfoods. The report uses Million units as the measurement for all values.
Superfood Market Dynamics & Structure
This section analyzes the competitive landscape of the superfood market, encompassing market concentration, technological advancements, regulatory influences, substitute products, end-user demographics, and merger & acquisition (M&A) activity. The analysis incorporates both quantitative and qualitative data to provide a holistic understanding of the market structure.
- Market Concentration: The superfood market exhibits a moderately fragmented structure, with several key players and numerous smaller niche operators. The top 5 players hold an estimated xx% market share in 2025, leaving ample room for growth and competition.
- Technological Innovation: Advancements in processing, packaging, and preservation technologies are driving product innovation and expanding the market reach of superfoods. However, high initial investment costs present a barrier for some smaller companies.
- Regulatory Frameworks: Varying regulations across different regions impact product labeling, claims, and market access for superfood products. Compliance with health and safety standards is crucial for market entry and sustainability.
- Competitive Product Substitutes: The rise of functional foods and other health-conscious food options presents indirect competition for superfoods. However, the unique nutritional profile and perceived health benefits of superfoods offer a competitive advantage.
- End-User Demographics: Health-conscious consumers, particularly millennials and Gen Z, are driving the demand for superfoods. Growing awareness of the link between diet and overall well-being further fuels market expansion.
- M&A Trends: The superfood market has witnessed a moderate level of M&A activity in recent years, with larger players acquiring smaller companies to expand their product portfolios and market reach. An estimated xx M&A deals occurred between 2019-2024.
Superfood Market Growth Trends & Insights
This section leverages extensive market research data to provide a comprehensive analysis of the superfood market's growth trajectory, encompassing market size evolution, adoption rates, technological disruptions, and evolving consumer preferences.
The global superfood market is experiencing robust growth, driven by increasing health consciousness, rising disposable incomes, and changing consumer lifestyles. The market size is projected to reach xx million units in 2025, exhibiting a CAGR of xx% during the forecast period (2025-2033). Market penetration is expected to increase significantly, particularly in developing economies. Technological innovations, such as improved processing and preservation techniques, are enabling wider access and expanding the market reach of superfoods. Consumer preference shifts towards natural and organic products are further contributing to the market's upward trajectory. The increasing popularity of plant-based diets and the growing focus on gut health are major growth drivers.
Dominant Regions, Countries, or Segments in Superfood Market
This section identifies the leading regions, countries, and segments driving the superfood market's growth.
By Type: The Fruits segment currently holds the largest market share, driven by the rising popularity of berries and other nutrient-rich fruits. The Grains and Seeds segment is expected to witness substantial growth in the forecast period.
Key Drivers: Rising consumer awareness of nutritional benefits, increasing demand for natural and organic food products, and favorable government initiatives promoting healthy lifestyles. By Distribution Channel: Supermarkets/Hypermarkets continue to dominate the distribution channel, due to their wide reach and established customer base. Online channels are experiencing rapid growth, fueled by rising e-commerce adoption and convenient home delivery options.
Key Drivers: Extensive retail infrastructure, strong consumer preference for convenience, and increasing online grocery shopping trends.
Superfood Market Product Landscape
The superfood market showcases a diverse range of products, encompassing various types such as fruits, vegetables, grains and seeds, herbs and roots, and other specialized superfoods. Product innovation is primarily focused on enhancing convenience (e.g., ready-to-eat formats, convenient packaging), expanding product diversity (new superfoods, unique flavor combinations), and improving functional characteristics (e.g., enhanced nutrient bioavailability, improved taste). Technological advancements in extraction, processing, and preservation techniques contribute significantly to product improvements.
Key Drivers, Barriers & Challenges in Superfood Market
Key Drivers: Growing health consciousness among consumers, increased awareness of the health benefits of superfoods, rising disposable incomes, particularly in developing economies, and supportive government policies promoting healthy eating habits.
Key Challenges: Supply chain volatility (e.g., seasonal availability, weather impacts), stringent regulations, and high competition. Fluctuations in raw material prices and concerns about product authenticity and quality control further present challenges for market players. These factors can impact profitability and market growth.
Emerging Opportunities in Superfood Market
Emerging opportunities exist in untapped markets in developing economies, particularly in Asia and Africa. There's significant potential for innovative product formats (e.g., functional beverages, fortified foods), and personalized nutrition solutions using superfoods. Evolving consumer preferences, particularly for convenience and sustainability, present further opportunities for market expansion.
Growth Accelerators in the Superfood Market Industry
Technological breakthroughs in processing and preservation methods, strategic partnerships between producers and retailers, and expansions into new markets (both geographically and through product diversification) are poised to accelerate market growth significantly. Effective branding and marketing campaigns highlighting the health benefits of superfoods are crucial for capturing market share.
Key Players Shaping the Superfood Market Market
- Nature's Superfoods LLP
- Raw Nutrition
- Aduna Ltd
- OMG! Organic Meets Good
- Nevitas Organics
- Barleans
- Mannatech Incorporated
- Impact Foods International Ltd
- Sunfood
- Naturya Bath
Notable Milestones in Superfood Market Sector
- February 2024: Inka's Berries launched two new blueberry varieties with extended shelf life.
- March 2024: Gaia Herbs launched a new line of postbiotic superfood products.
- March 2024: Spirulina Mater expanded its presence in the US via Walmart.com.
In-Depth Superfood Market Market Outlook
The superfood market is poised for continued strong growth, driven by favorable macro-trends and ongoing product innovation. Strategic investments in research and development, expansion into new geographical markets, and a focus on sustainable and ethical sourcing will be critical for long-term success in this dynamic market. The market is expected to continue its upward trajectory in the coming years, offering promising opportunities for both established players and new entrants.
Superfood Market Segmentation
-
1. Type
- 1.1. Fruits
- 1.2. Vegetables
- 1.3. Grains and Seeds
- 1.4. Herbs and Roots
- 1.5. Other Types
-
2. Distribution Channel
- 2.1. Supermarkets/Hypermarkets
- 2.2. Online Channels
- 2.3. Convenience Stores/Traditional Grocery Stores
- 2.4. Other Distribution Channels
Superfood Market Segmentation By Geography
-
1. North America
- 1.1. United States
- 1.2. Canada
- 1.3. Mexico
- 1.4. Rest of North America
-
2. Europe
- 2.1. Germany
- 2.2. United Kingdom
- 2.3. France
- 2.4. Spain
- 2.5. Italy
- 2.6. Russia
- 2.7. Rest of Europe
-
3. Asia Pacific
- 3.1. China
- 3.2. Japan
- 3.3. India
- 3.4. Australia
- 3.5. Rest of Asia Pacific
-
4. South America
- 4.1. Brazil
- 4.2. Argentina
- 4.3. Rest of South America
-
5. Middle East and Africa
- 5.1. South Africa
- 5.2. Saudi Arabia
- 5.3. Rest of Middle East and Africa
Superfood Market REPORT HIGHLIGHTS
| Aspects | Details |
|---|---|
| Study Period | 2019-2033 |
| Base Year | 2024 |
| Estimated Year | 2025 |
| Forecast Period | 2025-2033 |
| Historical Period | 2019-2024 |
| Growth Rate | CAGR of 8.46% from 2019-2033 |
| Segmentation |
|
Table of Contents
- 1. Introduction
- 1.1. Research Scope
- 1.2. Market Segmentation
- 1.3. Research Methodology
- 1.4. Definitions and Assumptions
- 2. Executive Summary
- 2.1. Introduction
- 3. Market Dynamics
- 3.1. Introduction
- 3.2. Market Drivers
- 3.2.1. Rising Health & Wellness Trends with Strategic Initiatives
- 3.3. Market Restrains
- 3.3.1. Cost Considerations Coupled With Availability Of Alternatives
- 3.4. Market Trends
- 3.4.1. Increasing Health and Wellness Trend
- 4. Market Factor Analysis
- 4.1. Porters Five Forces
- 4.2. Supply/Value Chain
- 4.3. PESTEL analysis
- 4.4. Market Entropy
- 4.5. Patent/Trademark Analysis
- 5. Global Superfood Market Analysis, Insights and Forecast, 2019-2031
- 5.1. Market Analysis, Insights and Forecast - by Type
- 5.1.1. Fruits
- 5.1.2. Vegetables
- 5.1.3. Grains and Seeds
- 5.1.4. Herbs and Roots
- 5.1.5. Other Types
- 5.2. Market Analysis, Insights and Forecast - by Distribution Channel
- 5.2.1. Supermarkets/Hypermarkets
- 5.2.2. Online Channels
- 5.2.3. Convenience Stores/Traditional Grocery Stores
- 5.2.4. Other Distribution Channels
- 5.3. Market Analysis, Insights and Forecast - by Region
- 5.3.1. North America
- 5.3.2. Europe
- 5.3.3. Asia Pacific
- 5.3.4. South America
- 5.3.5. Middle East and Africa
- 5.1. Market Analysis, Insights and Forecast - by Type
- 6. North America Superfood Market Analysis, Insights and Forecast, 2019-2031
- 6.1. Market Analysis, Insights and Forecast - by Type
- 6.1.1. Fruits
- 6.1.2. Vegetables
- 6.1.3. Grains and Seeds
- 6.1.4. Herbs and Roots
- 6.1.5. Other Types
- 6.2. Market Analysis, Insights and Forecast - by Distribution Channel
- 6.2.1. Supermarkets/Hypermarkets
- 6.2.2. Online Channels
- 6.2.3. Convenience Stores/Traditional Grocery Stores
- 6.2.4. Other Distribution Channels
- 6.1. Market Analysis, Insights and Forecast - by Type
- 7. Europe Superfood Market Analysis, Insights and Forecast, 2019-2031
- 7.1. Market Analysis, Insights and Forecast - by Type
- 7.1.1. Fruits
- 7.1.2. Vegetables
- 7.1.3. Grains and Seeds
- 7.1.4. Herbs and Roots
- 7.1.5. Other Types
- 7.2. Market Analysis, Insights and Forecast - by Distribution Channel
- 7.2.1. Supermarkets/Hypermarkets
- 7.2.2. Online Channels
- 7.2.3. Convenience Stores/Traditional Grocery Stores
- 7.2.4. Other Distribution Channels
- 7.1. Market Analysis, Insights and Forecast - by Type
- 8. Asia Pacific Superfood Market Analysis, Insights and Forecast, 2019-2031
- 8.1. Market Analysis, Insights and Forecast - by Type
- 8.1.1. Fruits
- 8.1.2. Vegetables
- 8.1.3. Grains and Seeds
- 8.1.4. Herbs and Roots
- 8.1.5. Other Types
- 8.2. Market Analysis, Insights and Forecast - by Distribution Channel
- 8.2.1. Supermarkets/Hypermarkets
- 8.2.2. Online Channels
- 8.2.3. Convenience Stores/Traditional Grocery Stores
- 8.2.4. Other Distribution Channels
- 8.1. Market Analysis, Insights and Forecast - by Type
- 9. South America Superfood Market Analysis, Insights and Forecast, 2019-2031
- 9.1. Market Analysis, Insights and Forecast - by Type
- 9.1.1. Fruits
- 9.1.2. Vegetables
- 9.1.3. Grains and Seeds
- 9.1.4. Herbs and Roots
- 9.1.5. Other Types
- 9.2. Market Analysis, Insights and Forecast - by Distribution Channel
- 9.2.1. Supermarkets/Hypermarkets
- 9.2.2. Online Channels
- 9.2.3. Convenience Stores/Traditional Grocery Stores
- 9.2.4. Other Distribution Channels
- 9.1. Market Analysis, Insights and Forecast - by Type
- 10. Middle East and Africa Superfood Market Analysis, Insights and Forecast, 2019-2031
- 10.1. Market Analysis, Insights and Forecast - by Type
- 10.1.1. Fruits
- 10.1.2. Vegetables
- 10.1.3. Grains and Seeds
- 10.1.4. Herbs and Roots
- 10.1.5. Other Types
- 10.2. Market Analysis, Insights and Forecast - by Distribution Channel
- 10.2.1. Supermarkets/Hypermarkets
- 10.2.2. Online Channels
- 10.2.3. Convenience Stores/Traditional Grocery Stores
- 10.2.4. Other Distribution Channels
- 10.1. Market Analysis, Insights and Forecast - by Type
- 11. North America Superfood Market Analysis, Insights and Forecast, 2019-2031
- 11.1. Market Analysis, Insights and Forecast - By Country/Sub-region
- 11.1.1 United States
- 11.1.2 Canada
- 11.1.3 Mexico
- 11.1.4 Rest of North America
- 12. Europe Superfood Market Analysis, Insights and Forecast, 2019-2031
- 12.1. Market Analysis, Insights and Forecast - By Country/Sub-region
- 12.1.1 Germany
- 12.1.2 United Kingdom
- 12.1.3 France
- 12.1.4 Spain
- 12.1.5 Italy
- 12.1.6 Russia
- 12.1.7 Rest of Europe
- 13. Asia Pacific Superfood Market Analysis, Insights and Forecast, 2019-2031
- 13.1. Market Analysis, Insights and Forecast - By Country/Sub-region
- 13.1.1 China
- 13.1.2 Japan
- 13.1.3 India
- 13.1.4 Australia
- 13.1.5 Rest of Asia Pacific
- 14. South America Superfood Market Analysis, Insights and Forecast, 2019-2031
- 14.1. Market Analysis, Insights and Forecast - By Country/Sub-region
- 14.1.1 Brazil
- 14.1.2 Argentina
- 14.1.3 Rest of South America
- 15. Middle East and Africa Superfood Market Analysis, Insights and Forecast, 2019-2031
- 15.1. Market Analysis, Insights and Forecast - By Country/Sub-region
- 15.1.1 South Africa
- 15.1.2 Saudi Arabia
- 15.1.3 Rest of Middle East and Africa
- 16. Competitive Analysis
- 16.1. Global Market Share Analysis 2024
- 16.2. Company Profiles
- 16.2.1 Nature's Superfoods LLP
- 16.2.1.1. Overview
- 16.2.1.2. Products
- 16.2.1.3. SWOT Analysis
- 16.2.1.4. Recent Developments
- 16.2.1.5. Financials (Based on Availability)
- 16.2.2 Raw Nutrition
- 16.2.2.1. Overview
- 16.2.2.2. Products
- 16.2.2.3. SWOT Analysis
- 16.2.2.4. Recent Developments
- 16.2.2.5. Financials (Based on Availability)
- 16.2.3 Aduna Ltd
- 16.2.3.1. Overview
- 16.2.3.2. Products
- 16.2.3.3. SWOT Analysis
- 16.2.3.4. Recent Developments
- 16.2.3.5. Financials (Based on Availability)
- 16.2.4 OMG! Organic Meets Good
- 16.2.4.1. Overview
- 16.2.4.2. Products
- 16.2.4.3. SWOT Analysis
- 16.2.4.4. Recent Developments
- 16.2.4.5. Financials (Based on Availability)
- 16.2.5 Nevitas Organics*List Not Exhaustive
- 16.2.5.1. Overview
- 16.2.5.2. Products
- 16.2.5.3. SWOT Analysis
- 16.2.5.4. Recent Developments
- 16.2.5.5. Financials (Based on Availability)
- 16.2.6 Barleans
- 16.2.6.1. Overview
- 16.2.6.2. Products
- 16.2.6.3. SWOT Analysis
- 16.2.6.4. Recent Developments
- 16.2.6.5. Financials (Based on Availability)
- 16.2.7 Mannatech Incorporated
- 16.2.7.1. Overview
- 16.2.7.2. Products
- 16.2.7.3. SWOT Analysis
- 16.2.7.4. Recent Developments
- 16.2.7.5. Financials (Based on Availability)
- 16.2.8 Impact Foods International Ltd
- 16.2.8.1. Overview
- 16.2.8.2. Products
- 16.2.8.3. SWOT Analysis
- 16.2.8.4. Recent Developments
- 16.2.8.5. Financials (Based on Availability)
- 16.2.9 Sunfood
- 16.2.9.1. Overview
- 16.2.9.2. Products
- 16.2.9.3. SWOT Analysis
- 16.2.9.4. Recent Developments
- 16.2.9.5. Financials (Based on Availability)
- 16.2.10 Naturya Bath
- 16.2.10.1. Overview
- 16.2.10.2. Products
- 16.2.10.3. SWOT Analysis
- 16.2.10.4. Recent Developments
- 16.2.10.5. Financials (Based on Availability)
- 16.2.1 Nature's Superfoods LLP
List of Figures
- Figure 1: Global Superfood Market Revenue Breakdown (Million, %) by Region 2024 & 2032
- Figure 2: Global Superfood Market Volume Breakdown (K Tons, %) by Region 2024 & 2032
- Figure 3: North America Superfood Market Revenue (Million), by Country 2024 & 2032
- Figure 4: North America Superfood Market Volume (K Tons), by Country 2024 & 2032
- Figure 5: North America Superfood Market Revenue Share (%), by Country 2024 & 2032
- Figure 6: North America Superfood Market Volume Share (%), by Country 2024 & 2032
- Figure 7: Europe Superfood Market Revenue (Million), by Country 2024 & 2032
- Figure 8: Europe Superfood Market Volume (K Tons), by Country 2024 & 2032
- Figure 9: Europe Superfood Market Revenue Share (%), by Country 2024 & 2032
- Figure 10: Europe Superfood Market Volume Share (%), by Country 2024 & 2032
- Figure 11: Asia Pacific Superfood Market Revenue (Million), by Country 2024 & 2032
- Figure 12: Asia Pacific Superfood Market Volume (K Tons), by Country 2024 & 2032
- Figure 13: Asia Pacific Superfood Market Revenue Share (%), by Country 2024 & 2032
- Figure 14: Asia Pacific Superfood Market Volume Share (%), by Country 2024 & 2032
- Figure 15: South America Superfood Market Revenue (Million), by Country 2024 & 2032
- Figure 16: South America Superfood Market Volume (K Tons), by Country 2024 & 2032
- Figure 17: South America Superfood Market Revenue Share (%), by Country 2024 & 2032
- Figure 18: South America Superfood Market Volume Share (%), by Country 2024 & 2032
- Figure 19: Middle East and Africa Superfood Market Revenue (Million), by Country 2024 & 2032
- Figure 20: Middle East and Africa Superfood Market Volume (K Tons), by Country 2024 & 2032
- Figure 21: Middle East and Africa Superfood Market Revenue Share (%), by Country 2024 & 2032
- Figure 22: Middle East and Africa Superfood Market Volume Share (%), by Country 2024 & 2032
- Figure 23: North America Superfood Market Revenue (Million), by Type 2024 & 2032
- Figure 24: North America Superfood Market Volume (K Tons), by Type 2024 & 2032
- Figure 25: North America Superfood Market Revenue Share (%), by Type 2024 & 2032
- Figure 26: North America Superfood Market Volume Share (%), by Type 2024 & 2032
- Figure 27: North America Superfood Market Revenue (Million), by Distribution Channel 2024 & 2032
- Figure 28: North America Superfood Market Volume (K Tons), by Distribution Channel 2024 & 2032
- Figure 29: North America Superfood Market Revenue Share (%), by Distribution Channel 2024 & 2032
- Figure 30: North America Superfood Market Volume Share (%), by Distribution Channel 2024 & 2032
- Figure 31: North America Superfood Market Revenue (Million), by Country 2024 & 2032
- Figure 32: North America Superfood Market Volume (K Tons), by Country 2024 & 2032
- Figure 33: North America Superfood Market Revenue Share (%), by Country 2024 & 2032
- Figure 34: North America Superfood Market Volume Share (%), by Country 2024 & 2032
- Figure 35: Europe Superfood Market Revenue (Million), by Type 2024 & 2032
- Figure 36: Europe Superfood Market Volume (K Tons), by Type 2024 & 2032
- Figure 37: Europe Superfood Market Revenue Share (%), by Type 2024 & 2032
- Figure 38: Europe Superfood Market Volume Share (%), by Type 2024 & 2032
- Figure 39: Europe Superfood Market Revenue (Million), by Distribution Channel 2024 & 2032
- Figure 40: Europe Superfood Market Volume (K Tons), by Distribution Channel 2024 & 2032
- Figure 41: Europe Superfood Market Revenue Share (%), by Distribution Channel 2024 & 2032
- Figure 42: Europe Superfood Market Volume Share (%), by Distribution Channel 2024 & 2032
- Figure 43: Europe Superfood Market Revenue (Million), by Country 2024 & 2032
- Figure 44: Europe Superfood Market Volume (K Tons), by Country 2024 & 2032
- Figure 45: Europe Superfood Market Revenue Share (%), by Country 2024 & 2032
- Figure 46: Europe Superfood Market Volume Share (%), by Country 2024 & 2032
- Figure 47: Asia Pacific Superfood Market Revenue (Million), by Type 2024 & 2032
- Figure 48: Asia Pacific Superfood Market Volume (K Tons), by Type 2024 & 2032
- Figure 49: Asia Pacific Superfood Market Revenue Share (%), by Type 2024 & 2032
- Figure 50: Asia Pacific Superfood Market Volume Share (%), by Type 2024 & 2032
- Figure 51: Asia Pacific Superfood Market Revenue (Million), by Distribution Channel 2024 & 2032
- Figure 52: Asia Pacific Superfood Market Volume (K Tons), by Distribution Channel 2024 & 2032
- Figure 53: Asia Pacific Superfood Market Revenue Share (%), by Distribution Channel 2024 & 2032
- Figure 54: Asia Pacific Superfood Market Volume Share (%), by Distribution Channel 2024 & 2032
- Figure 55: Asia Pacific Superfood Market Revenue (Million), by Country 2024 & 2032
- Figure 56: Asia Pacific Superfood Market Volume (K Tons), by Country 2024 & 2032
- Figure 57: Asia Pacific Superfood Market Revenue Share (%), by Country 2024 & 2032
- Figure 58: Asia Pacific Superfood Market Volume Share (%), by Country 2024 & 2032
- Figure 59: South America Superfood Market Revenue (Million), by Type 2024 & 2032
- Figure 60: South America Superfood Market Volume (K Tons), by Type 2024 & 2032
- Figure 61: South America Superfood Market Revenue Share (%), by Type 2024 & 2032
- Figure 62: South America Superfood Market Volume Share (%), by Type 2024 & 2032
- Figure 63: South America Superfood Market Revenue (Million), by Distribution Channel 2024 & 2032
- Figure 64: South America Superfood Market Volume (K Tons), by Distribution Channel 2024 & 2032
- Figure 65: South America Superfood Market Revenue Share (%), by Distribution Channel 2024 & 2032
- Figure 66: South America Superfood Market Volume Share (%), by Distribution Channel 2024 & 2032
- Figure 67: South America Superfood Market Revenue (Million), by Country 2024 & 2032
- Figure 68: South America Superfood Market Volume (K Tons), by Country 2024 & 2032
- Figure 69: South America Superfood Market Revenue Share (%), by Country 2024 & 2032
- Figure 70: South America Superfood Market Volume Share (%), by Country 2024 & 2032
- Figure 71: Middle East and Africa Superfood Market Revenue (Million), by Type 2024 & 2032
- Figure 72: Middle East and Africa Superfood Market Volume (K Tons), by Type 2024 & 2032
- Figure 73: Middle East and Africa Superfood Market Revenue Share (%), by Type 2024 & 2032
- Figure 74: Middle East and Africa Superfood Market Volume Share (%), by Type 2024 & 2032
- Figure 75: Middle East and Africa Superfood Market Revenue (Million), by Distribution Channel 2024 & 2032
- Figure 76: Middle East and Africa Superfood Market Volume (K Tons), by Distribution Channel 2024 & 2032
- Figure 77: Middle East and Africa Superfood Market Revenue Share (%), by Distribution Channel 2024 & 2032
- Figure 78: Middle East and Africa Superfood Market Volume Share (%), by Distribution Channel 2024 & 2032
- Figure 79: Middle East and Africa Superfood Market Revenue (Million), by Country 2024 & 2032
- Figure 80: Middle East and Africa Superfood Market Volume (K Tons), by Country 2024 & 2032
- Figure 81: Middle East and Africa Superfood Market Revenue Share (%), by Country 2024 & 2032
- Figure 82: Middle East and Africa Superfood Market Volume Share (%), by Country 2024 & 2032
List of Tables
- Table 1: Global Superfood Market Revenue Million Forecast, by Region 2019 & 2032
- Table 2: Global Superfood Market Volume K Tons Forecast, by Region 2019 & 2032
- Table 3: Global Superfood Market Revenue Million Forecast, by Type 2019 & 2032
- Table 4: Global Superfood Market Volume K Tons Forecast, by Type 2019 & 2032
- Table 5: Global Superfood Market Revenue Million Forecast, by Distribution Channel 2019 & 2032
- Table 6: Global Superfood Market Volume K Tons Forecast, by Distribution Channel 2019 & 2032
- Table 7: Global Superfood Market Revenue Million Forecast, by Region 2019 & 2032
- Table 8: Global Superfood Market Volume K Tons Forecast, by Region 2019 & 2032
- Table 9: Global Superfood Market Revenue Million Forecast, by Country 2019 & 2032
- Table 10: Global Superfood Market Volume K Tons Forecast, by Country 2019 & 2032
- Table 11: United States Superfood Market Revenue (Million) Forecast, by Application 2019 & 2032
- Table 12: United States Superfood Market Volume (K Tons) Forecast, by Application 2019 & 2032
- Table 13: Canada Superfood Market Revenue (Million) Forecast, by Application 2019 & 2032
- Table 14: Canada Superfood Market Volume (K Tons) Forecast, by Application 2019 & 2032
- Table 15: Mexico Superfood Market Revenue (Million) Forecast, by Application 2019 & 2032
- Table 16: Mexico Superfood Market Volume (K Tons) Forecast, by Application 2019 & 2032
- Table 17: Rest of North America Superfood Market Revenue (Million) Forecast, by Application 2019 & 2032
- Table 18: Rest of North America Superfood Market Volume (K Tons) Forecast, by Application 2019 & 2032
- Table 19: Global Superfood Market Revenue Million Forecast, by Country 2019 & 2032
- Table 20: Global Superfood Market Volume K Tons Forecast, by Country 2019 & 2032
- Table 21: Germany Superfood Market Revenue (Million) Forecast, by Application 2019 & 2032
- Table 22: Germany Superfood Market Volume (K Tons) Forecast, by Application 2019 & 2032
- Table 23: United Kingdom Superfood Market Revenue (Million) Forecast, by Application 2019 & 2032
- Table 24: United Kingdom Superfood Market Volume (K Tons) Forecast, by Application 2019 & 2032
- Table 25: France Superfood Market Revenue (Million) Forecast, by Application 2019 & 2032
- Table 26: France Superfood Market Volume (K Tons) Forecast, by Application 2019 & 2032
- Table 27: Spain Superfood Market Revenue (Million) Forecast, by Application 2019 & 2032
- Table 28: Spain Superfood Market Volume (K Tons) Forecast, by Application 2019 & 2032
- Table 29: Italy Superfood Market Revenue (Million) Forecast, by Application 2019 & 2032
- Table 30: Italy Superfood Market Volume (K Tons) Forecast, by Application 2019 & 2032
- Table 31: Russia Superfood Market Revenue (Million) Forecast, by Application 2019 & 2032
- Table 32: Russia Superfood Market Volume (K Tons) Forecast, by Application 2019 & 2032
- Table 33: Rest of Europe Superfood Market Revenue (Million) Forecast, by Application 2019 & 2032
- Table 34: Rest of Europe Superfood Market Volume (K Tons) Forecast, by Application 2019 & 2032
- Table 35: Global Superfood Market Revenue Million Forecast, by Country 2019 & 2032
- Table 36: Global Superfood Market Volume K Tons Forecast, by Country 2019 & 2032
- Table 37: China Superfood Market Revenue (Million) Forecast, by Application 2019 & 2032
- Table 38: China Superfood Market Volume (K Tons) Forecast, by Application 2019 & 2032
- Table 39: Japan Superfood Market Revenue (Million) Forecast, by Application 2019 & 2032
- Table 40: Japan Superfood Market Volume (K Tons) Forecast, by Application 2019 & 2032
- Table 41: India Superfood Market Revenue (Million) Forecast, by Application 2019 & 2032
- Table 42: India Superfood Market Volume (K Tons) Forecast, by Application 2019 & 2032
- Table 43: Australia Superfood Market Revenue (Million) Forecast, by Application 2019 & 2032
- Table 44: Australia Superfood Market Volume (K Tons) Forecast, by Application 2019 & 2032
- Table 45: Rest of Asia Pacific Superfood Market Revenue (Million) Forecast, by Application 2019 & 2032
- Table 46: Rest of Asia Pacific Superfood Market Volume (K Tons) Forecast, by Application 2019 & 2032
- Table 47: Global Superfood Market Revenue Million Forecast, by Country 2019 & 2032
- Table 48: Global Superfood Market Volume K Tons Forecast, by Country 2019 & 2032
- Table 49: Brazil Superfood Market Revenue (Million) Forecast, by Application 2019 & 2032
- Table 50: Brazil Superfood Market Volume (K Tons) Forecast, by Application 2019 & 2032
- Table 51: Argentina Superfood Market Revenue (Million) Forecast, by Application 2019 & 2032
- Table 52: Argentina Superfood Market Volume (K Tons) Forecast, by Application 2019 & 2032
- Table 53: Rest of South America Superfood Market Revenue (Million) Forecast, by Application 2019 & 2032
- Table 54: Rest of South America Superfood Market Volume (K Tons) Forecast, by Application 2019 & 2032
- Table 55: Global Superfood Market Revenue Million Forecast, by Country 2019 & 2032
- Table 56: Global Superfood Market Volume K Tons Forecast, by Country 2019 & 2032
- Table 57: South Africa Superfood Market Revenue (Million) Forecast, by Application 2019 & 2032
- Table 58: South Africa Superfood Market Volume (K Tons) Forecast, by Application 2019 & 2032
- Table 59: Saudi Arabia Superfood Market Revenue (Million) Forecast, by Application 2019 & 2032
- Table 60: Saudi Arabia Superfood Market Volume (K Tons) Forecast, by Application 2019 & 2032
- Table 61: Rest of Middle East and Africa Superfood Market Revenue (Million) Forecast, by Application 2019 & 2032
- Table 62: Rest of Middle East and Africa Superfood Market Volume (K Tons) Forecast, by Application 2019 & 2032
- Table 63: Global Superfood Market Revenue Million Forecast, by Type 2019 & 2032
- Table 64: Global Superfood Market Volume K Tons Forecast, by Type 2019 & 2032
- Table 65: Global Superfood Market Revenue Million Forecast, by Distribution Channel 2019 & 2032
- Table 66: Global Superfood Market Volume K Tons Forecast, by Distribution Channel 2019 & 2032
- Table 67: Global Superfood Market Revenue Million Forecast, by Country 2019 & 2032
- Table 68: Global Superfood Market Volume K Tons Forecast, by Country 2019 & 2032
- Table 69: United States Superfood Market Revenue (Million) Forecast, by Application 2019 & 2032
- Table 70: United States Superfood Market Volume (K Tons) Forecast, by Application 2019 & 2032
- Table 71: Canada Superfood Market Revenue (Million) Forecast, by Application 2019 & 2032
- Table 72: Canada Superfood Market Volume (K Tons) Forecast, by Application 2019 & 2032
- Table 73: Mexico Superfood Market Revenue (Million) Forecast, by Application 2019 & 2032
- Table 74: Mexico Superfood Market Volume (K Tons) Forecast, by Application 2019 & 2032
- Table 75: Rest of North America Superfood Market Revenue (Million) Forecast, by Application 2019 & 2032
- Table 76: Rest of North America Superfood Market Volume (K Tons) Forecast, by Application 2019 & 2032
- Table 77: Global Superfood Market Revenue Million Forecast, by Type 2019 & 2032
- Table 78: Global Superfood Market Volume K Tons Forecast, by Type 2019 & 2032
- Table 79: Global Superfood Market Revenue Million Forecast, by Distribution Channel 2019 & 2032
- Table 80: Global Superfood Market Volume K Tons Forecast, by Distribution Channel 2019 & 2032
- Table 81: Global Superfood Market Revenue Million Forecast, by Country 2019 & 2032
- Table 82: Global Superfood Market Volume K Tons Forecast, by Country 2019 & 2032
- Table 83: Germany Superfood Market Revenue (Million) Forecast, by Application 2019 & 2032
- Table 84: Germany Superfood Market Volume (K Tons) Forecast, by Application 2019 & 2032
- Table 85: United Kingdom Superfood Market Revenue (Million) Forecast, by Application 2019 & 2032
- Table 86: United Kingdom Superfood Market Volume (K Tons) Forecast, by Application 2019 & 2032
- Table 87: France Superfood Market Revenue (Million) Forecast, by Application 2019 & 2032
- Table 88: France Superfood Market Volume (K Tons) Forecast, by Application 2019 & 2032
- Table 89: Spain Superfood Market Revenue (Million) Forecast, by Application 2019 & 2032
- Table 90: Spain Superfood Market Volume (K Tons) Forecast, by Application 2019 & 2032
- Table 91: Italy Superfood Market Revenue (Million) Forecast, by Application 2019 & 2032
- Table 92: Italy Superfood Market Volume (K Tons) Forecast, by Application 2019 & 2032
- Table 93: Russia Superfood Market Revenue (Million) Forecast, by Application 2019 & 2032
- Table 94: Russia Superfood Market Volume (K Tons) Forecast, by Application 2019 & 2032
- Table 95: Rest of Europe Superfood Market Revenue (Million) Forecast, by Application 2019 & 2032
- Table 96: Rest of Europe Superfood Market Volume (K Tons) Forecast, by Application 2019 & 2032
- Table 97: Global Superfood Market Revenue Million Forecast, by Type 2019 & 2032
- Table 98: Global Superfood Market Volume K Tons Forecast, by Type 2019 & 2032
- Table 99: Global Superfood Market Revenue Million Forecast, by Distribution Channel 2019 & 2032
- Table 100: Global Superfood Market Volume K Tons Forecast, by Distribution Channel 2019 & 2032
- Table 101: Global Superfood Market Revenue Million Forecast, by Country 2019 & 2032
- Table 102: Global Superfood Market Volume K Tons Forecast, by Country 2019 & 2032
- Table 103: China Superfood Market Revenue (Million) Forecast, by Application 2019 & 2032
- Table 104: China Superfood Market Volume (K Tons) Forecast, by Application 2019 & 2032
- Table 105: Japan Superfood Market Revenue (Million) Forecast, by Application 2019 & 2032
- Table 106: Japan Superfood Market Volume (K Tons) Forecast, by Application 2019 & 2032
- Table 107: India Superfood Market Revenue (Million) Forecast, by Application 2019 & 2032
- Table 108: India Superfood Market Volume (K Tons) Forecast, by Application 2019 & 2032
- Table 109: Australia Superfood Market Revenue (Million) Forecast, by Application 2019 & 2032
- Table 110: Australia Superfood Market Volume (K Tons) Forecast, by Application 2019 & 2032
- Table 111: Rest of Asia Pacific Superfood Market Revenue (Million) Forecast, by Application 2019 & 2032
- Table 112: Rest of Asia Pacific Superfood Market Volume (K Tons) Forecast, by Application 2019 & 2032
- Table 113: Global Superfood Market Revenue Million Forecast, by Type 2019 & 2032
- Table 114: Global Superfood Market Volume K Tons Forecast, by Type 2019 & 2032
- Table 115: Global Superfood Market Revenue Million Forecast, by Distribution Channel 2019 & 2032
- Table 116: Global Superfood Market Volume K Tons Forecast, by Distribution Channel 2019 & 2032
- Table 117: Global Superfood Market Revenue Million Forecast, by Country 2019 & 2032
- Table 118: Global Superfood Market Volume K Tons Forecast, by Country 2019 & 2032
- Table 119: Brazil Superfood Market Revenue (Million) Forecast, by Application 2019 & 2032
- Table 120: Brazil Superfood Market Volume (K Tons) Forecast, by Application 2019 & 2032
- Table 121: Argentina Superfood Market Revenue (Million) Forecast, by Application 2019 & 2032
- Table 122: Argentina Superfood Market Volume (K Tons) Forecast, by Application 2019 & 2032
- Table 123: Rest of South America Superfood Market Revenue (Million) Forecast, by Application 2019 & 2032
- Table 124: Rest of South America Superfood Market Volume (K Tons) Forecast, by Application 2019 & 2032
- Table 125: Global Superfood Market Revenue Million Forecast, by Type 2019 & 2032
- Table 126: Global Superfood Market Volume K Tons Forecast, by Type 2019 & 2032
- Table 127: Global Superfood Market Revenue Million Forecast, by Distribution Channel 2019 & 2032
- Table 128: Global Superfood Market Volume K Tons Forecast, by Distribution Channel 2019 & 2032
- Table 129: Global Superfood Market Revenue Million Forecast, by Country 2019 & 2032
- Table 130: Global Superfood Market Volume K Tons Forecast, by Country 2019 & 2032
- Table 131: South Africa Superfood Market Revenue (Million) Forecast, by Application 2019 & 2032
- Table 132: South Africa Superfood Market Volume (K Tons) Forecast, by Application 2019 & 2032
- Table 133: Saudi Arabia Superfood Market Revenue (Million) Forecast, by Application 2019 & 2032
- Table 134: Saudi Arabia Superfood Market Volume (K Tons) Forecast, by Application 2019 & 2032
- Table 135: Rest of Middle East and Africa Superfood Market Revenue (Million) Forecast, by Application 2019 & 2032
- Table 136: Rest of Middle East and Africa Superfood Market Volume (K Tons) Forecast, by Application 2019 & 2032
Frequently Asked Questions
1. What is the projected Compound Annual Growth Rate (CAGR) of the Superfood Market?
The projected CAGR is approximately 8.46%.
2. Which companies are prominent players in the Superfood Market?
Key companies in the market include Nature's Superfoods LLP, Raw Nutrition, Aduna Ltd, OMG! Organic Meets Good, Nevitas Organics*List Not Exhaustive, Barleans, Mannatech Incorporated, Impact Foods International Ltd, Sunfood, Naturya Bath.
3. What are the main segments of the Superfood Market?
The market segments include Type, Distribution Channel.
4. Can you provide details about the market size?
The market size is estimated to be USD 144.03 Million as of 2022.
5. What are some drivers contributing to market growth?
Rising Health & Wellness Trends with Strategic Initiatives.
6. What are the notable trends driving market growth?
Increasing Health and Wellness Trend.
7. Are there any restraints impacting market growth?
Cost Considerations Coupled With Availability Of Alternatives.
8. Can you provide examples of recent developments in the market?
March 2024: Gaia Herbs launched a new line of postbiotics fermented from traditional superfoods such as turmeric, ginger, and kimchi. The company targets the gut health market with these products, designed to provide beneficial bacteria and prebiotics for improved digestion and immune system function.
9. What pricing options are available for accessing the report?
Pricing options include single-user, multi-user, and enterprise licenses priced at USD 4750, USD 5250, and USD 8750 respectively.
10. Is the market size provided in terms of value or volume?
The market size is provided in terms of value, measured in Million and volume, measured in K Tons.
11. Are there any specific market keywords associated with the report?
Yes, the market keyword associated with the report is "Superfood Market," which aids in identifying and referencing the specific market segment covered.
12. How do I determine which pricing option suits my needs best?
The pricing options vary based on user requirements and access needs. Individual users may opt for single-user licenses, while businesses requiring broader access may choose multi-user or enterprise licenses for cost-effective access to the report.
13. Are there any additional resources or data provided in the Superfood Market report?
While the report offers comprehensive insights, it's advisable to review the specific contents or supplementary materials provided to ascertain if additional resources or data are available.
14. How can I stay updated on further developments or reports in the Superfood Market?
To stay informed about further developments, trends, and reports in the Superfood Market, consider subscribing to industry newsletters, following relevant companies and organizations, or regularly checking reputable industry news sources and publications.
Methodology
Step 1 - Identification of Relevant Samples Size from Population Database


Step 2 - Approaches for Defining Global Market Size (Value, Volume* & Price*)

Note*: In applicable scenarios
Step 3 - Data Sources
Primary Research
- Web Analytics
- Survey Reports
- Research Institute
- Latest Research Reports
- Opinion Leaders
Secondary Research
- Annual Reports
- White Paper
- Latest Press Release
- Industry Association
- Paid Database
- Investor Presentations

Step 4 - Data Triangulation
Involves using different sources of information in order to increase the validity of a study
These sources are likely to be stakeholders in a program - participants, other researchers, program staff, other community members, and so on.
Then we put all data in single framework & apply various statistical tools to find out the dynamic on the market.
During the analysis stage, feedback from the stakeholder groups would be compared to determine areas of agreement as well as areas of divergence
