

Key Insights
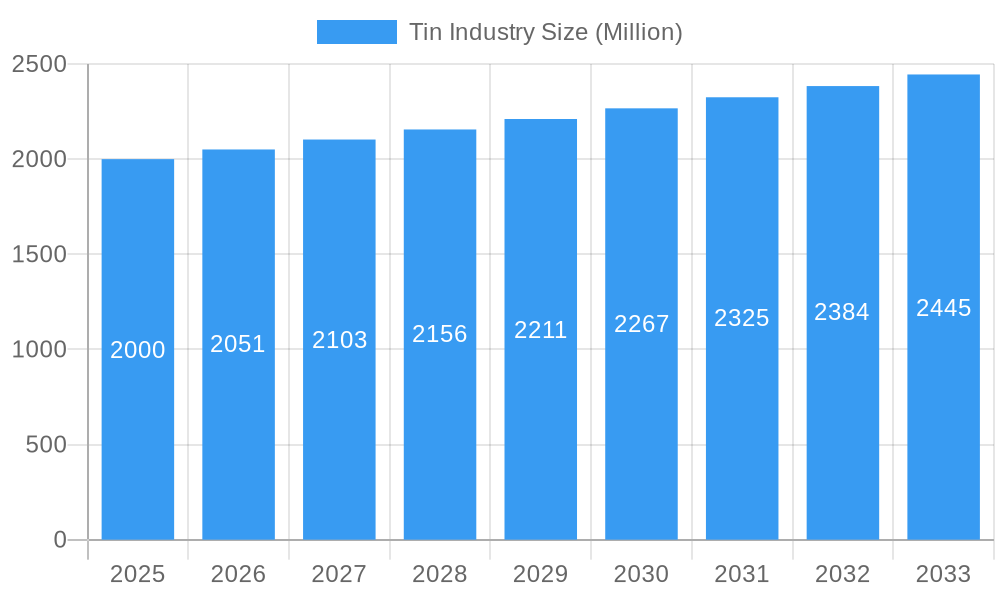
The global tin market, valued at approximately 7.65 billion in 2025, is projected to experience robust growth with a Compound Annual Growth Rate (CAGR) of 3.751% from 2025 to 2033. Key demand drivers include the electronics sector, particularly 5G infrastructure and electric vehicles, where tin is vital for soldering and plating. The automotive industry's electrification and the packaging sector's reliance on tin-plated steel for its protective qualities further bolster demand. Emerging economies, especially in the Asia-Pacific region, are poised to contribute significantly to market expansion. Challenges include price volatility due to supply chain and geopolitical factors, alongside a growing imperative for sustainable and environmentally conscious mining practices.
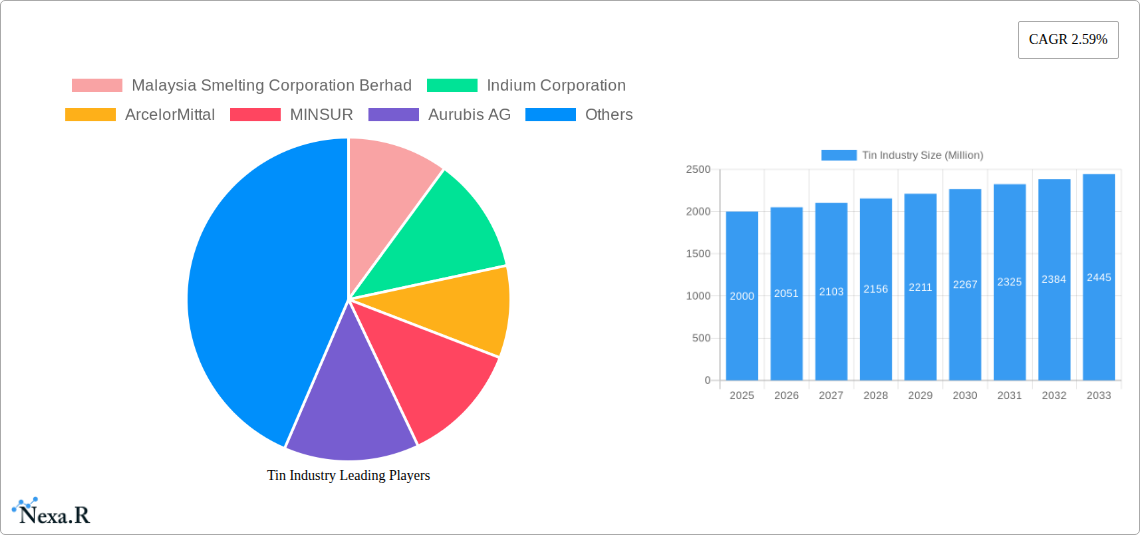
Tin Industry Market Size (In Billion)
The electronics sector leads tin consumption, followed by automotive and packaging industries. While metal tin holds the largest market share, tin alloys and compounds are expected to see steady growth due to their specialized applications in advanced electronics. Leading market participants such as Malaysia Smelting Corporation Berhad, Indium Corporation, and ArcelorMittal are strategically positioned to capitalize on market growth through their established production and distribution networks. Asia-Pacific, driven by China's manufacturing prowess and India's industrial development, dominates the regional market, with North America and Europe following. Innovations in tin-based materials and sustainable mining will shape the future trajectory of the tin market.
Tin Industry Company Market Share
Global Tin Market Analysis: 2025-2033 Outlook
This report delivers a comprehensive analysis of the global tin industry, detailing market dynamics, growth trends, regional leadership, product segmentation, key stakeholders, and future projections. Covering the forecast period 2025-2033 with 2025 as the base year, it examines the broader base metals market and the tin sub-market, providing critical insights for industry professionals, investors, and stakeholders. Market valuations are presented in billions.
Tin Industry Market Dynamics & Structure
The tin market exhibits a moderately concentrated structure, with key players like Malaysia Smelting Corporation Berhad, Indium Corporation, and Aurubis AG holding significant market share (xx%). Technological innovation, particularly in recycling and refining processes, is a major driver, alongside increasing demand from electronics and automotive sectors. Regulatory frameworks concerning mining and environmental standards significantly influence operations, while price fluctuations and the availability of substitute materials pose considerable challenges. Mergers and acquisitions (M&A) activity, like the Malaysia Smelting Corp's acquisition in June 2022, is reshaping the competitive landscape.
- Market Concentration: Moderately concentrated, with top 5 players controlling xx% of market share in 2024.
- Technological Innovation: Focus on enhanced recycling technologies and improved smelting efficiencies.
- Regulatory Framework: Stringent environmental regulations influencing mining practices and waste management.
- Competitive Substitutes: Presence of alternative materials in specific applications, impacting market share.
- M&A Activity: Consistent M&A activity reshaping the market landscape, with xx major deals in the past 5 years.
- End-User Demographics: Growing demand from emerging economies and technological advancements drive market growth.
Tin Industry Growth Trends & Insights
The global tin market witnessed robust growth during the historical period (2019-2024), exhibiting a CAGR of xx%. This growth is attributed to the increasing demand from the electronics industry, particularly in emerging markets. Technological advancements in miniaturization and increased functionality of electronic devices fuel demand. The automotive sector also contributes significantly, with tin used in solder and other components. Consumer behavior shifts toward advanced electronics and eco-friendly packaging solutions further propel market expansion. The forecast period (2025-2033) projects a CAGR of xx%, driven by the continuous expansion of electronics manufacturing and the rising adoption of tin-based materials in various applications. Market penetration in emerging markets is expected to increase significantly, contributing substantially to overall market expansion.
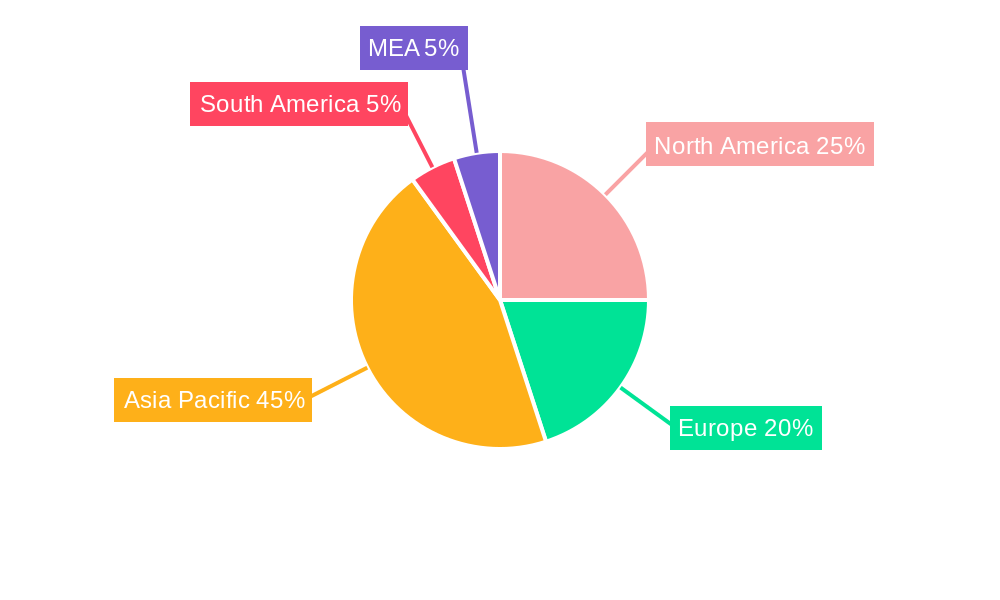
Dominant Regions, Countries, or Segments in Tin Industry
Asia, specifically China and Southeast Asia, dominates the tin market, accounting for xx% of global production in 2024. High tin reserves and established mining and smelting capacities contribute to this dominance. Within the product segments, Metal accounts for the largest share (xx%), followed by Alloys (xx%) and Compounds (xx%). The Electronics industry is the leading end-user sector, driven by the substantial use of tin in solder for printed circuit boards and other electronic components. The automotive sector is another significant end-user, utilizing tin in various components.
- Key Drivers: Abundant resources in Asia, established infrastructure, and government support.
- Dominance Factors: High production capacity, cost-effective manufacturing, and proximity to major consumers.
- Growth Potential: Emerging markets in Africa and South America present significant growth opportunities.
Tin Industry Product Landscape
The tin industry offers a range of products, including tin metal, various alloys, and chemical compounds. Innovations are focused on improving the performance and sustainability of these products. For instance, development of lead-free solders addresses environmental concerns, while advancements in alloy compositions enhance solder strength and reliability. Unique selling propositions include improved thermal conductivity, corrosion resistance, and biocompatibility, driving adoption across different sectors.
Key Drivers, Barriers & Challenges in Tin Industry
Key Drivers: Growing demand from electronics and automotive industries, increasing use in renewable energy technologies, and advancements in tin recycling technology.
Challenges: Fluctuations in tin prices due to supply chain disruptions, environmental concerns surrounding tin mining, and the availability of substitute materials. Supply chain vulnerabilities are estimated to have impacted market growth by xx% in 2022, highlighting the need for diversification and improved logistics.
Emerging Opportunities in Tin Industry
Emerging opportunities lie in the increasing adoption of tin in renewable energy applications, including solar panels and batteries. Growth is also anticipated in specialized alloys for niche applications such as 3D printing and medical devices. Expanding into new markets and focusing on sustainable mining practices presents significant growth potential.
Growth Accelerators in the Tin Industry
Technological advancements in extraction, refining, and recycling will significantly accelerate growth. Strategic partnerships between mining companies and end-users will improve supply chain efficiency. Expansion into emerging markets and diversification of applications will propel market expansion.
Key Players Shaping the Tin Industry Market
- Malaysia Smelting Corporation Berhad
- Indium Corporation
- ArcelorMittal
- MINSUR
- Aurubis AG
- Avalon Advanced Materials Inc
- Timah
- YUNNAN TIN COMPANY GROUP LIMITED
- Yunnan Chengfeng Non-ferrous Metals Co Ltd
- Jiangxi New Nanshan Technology Co Ltd
- Thailand Smelting and Refining Co Ltd
Notable Milestones in Tin Industry Sector
- November 2023: Cornish Tin secured GBP 1.1 million (USD 1.38 million) funding, exceeding its target significantly, showcasing investor confidence in tin exploration.
- August 2023: Minsur announced a USD 2 billion investment in expanding its copper and tin operations, signaling increased production capacity.
- December 2022: Aurubis commenced construction of a state-of-the-art recycling plant, boosting tin recovery and resource efficiency.
- June 2022: Malaysia Smelting Corp's acquisition of a neighboring tin mining leaseholder expanded its market share and operational footprint.
In-Depth Tin Industry Market Outlook
The tin industry's future is promising, with growth driven by technological advancements, increased demand from key sectors, and a focus on sustainability. Strategic partnerships, investments in innovative technologies, and responsible mining practices will be crucial to capturing long-term market opportunities. The market's future hinges on addressing supply chain challenges and mitigating environmental concerns, ensuring responsible and sustainable growth.
Tin Industry Segmentation
-
1. Product Type
- 1.1. Metal
- 1.2. Alloy
- 1.3. Compounds
-
2. Application
- 2.1. Solder
- 2.2. Tin Plating
- 2.3. Chemicals
- 2.4. Other Ap
-
3. End-user Industry
- 3.1. Automotive
- 3.2. Electronics
- 3.3. Packaging (Food and Beverage)
- 3.4. Glass
- 3.5. Other En
Tin Industry Segmentation By Geography
-
1. Indonesia
- 1.1. Malaysia
- 1.2. Peru
- 1.3. Vietnam
- 1.4. Other Countries
- 2. China
- 3. India
- 4. Japan
- 5. South Korea
-
6. Rest of Asia Pacific
- 6.1. North America
- 7. United States
- 8. Canada
-
9. Mexico
- 9.1. Europe
- 10. Germany
- 11. United Kingdom
- 12. Italy
- 13. France
- 14. Austria
-
15. Rest of Europe
- 15.1. South America
- 16. Brazil
- 17. Argentina
-
18. Rest of South America
- 18.1. Middle East and Africa
- 19. South Africa
- 20. United Arab Emirates
- 21. Rest of Middle East and Africa
Tin Industry Regional Market Share
Geographic Coverage of Tin Industry
Tin Industry REPORT HIGHLIGHTS
| Aspects | Details |
|---|---|
| Study Period | 2020-2034 |
| Base Year | 2025 |
| Estimated Year | 2026 |
| Forecast Period | 2026-2034 |
| Historical Period | 2020-2025 |
| Growth Rate | CAGR of 3.751% from 2020-2034 |
| Segmentation |
|
Table of Contents
- 1. Introduction
- 1.1. Research Scope
- 1.2. Market Segmentation
- 1.3. Research Objective
- 1.4. Definitions and Assumptions
- 2. Executive Summary
- 2.1. Market Snapshot
- 3. Market Dynamics
- 3.1. Market Drivers
- 3.2. Market Restrains
- 3.3. Market Trends
- 3.4. Market Opportunities
- 4. Market Factor Analysis
- 4.1. Porters Five Forces
- 4.1.1. Bargaining Power of Suppliers
- 4.1.2. Bargaining Power of Buyers
- 4.1.3. Threat of New Entrants
- 4.1.4. Threat of Substitutes
- 4.1.5. Competitive Rivalry
- 4.2. PESTEL analysis
- 4.3. BCG Analysis
- 4.3.1. Stars (High Growth, High Market Share)
- 4.3.2. Cash Cows (Low Growth, High Market Share)
- 4.3.3. Question Mark (High Growth, Low Market Share)
- 4.3.4. Dogs (Low Growth, Low Market Share)
- 4.4. Ansoff Matrix Analysis
- 4.5. Supply Chain Analysis
- 4.6. Regulatory Landscape
- 4.7. Current Market Potential and Opportunity Assessment (TAM–SAM–SOM Framework)
- 4.8. NRP Analyst Note
- 4.1. Porters Five Forces
- 5. Market Analysis, Insights and Forecast 2021-2033
- 5.1. Market Analysis, Insights and Forecast - by Product Type
- 5.1.1. Metal
- 5.1.2. Alloy
- 5.1.3. Compounds
- 5.2. Market Analysis, Insights and Forecast - by Application
- 5.2.1. Solder
- 5.2.2. Tin Plating
- 5.2.3. Chemicals
- 5.2.4. Other Ap
- 5.3. Market Analysis, Insights and Forecast - by End-user Industry
- 5.3.1. Automotive
- 5.3.2. Electronics
- 5.3.3. Packaging (Food and Beverage)
- 5.3.4. Glass
- 5.3.5. Other En
- 5.4. Market Analysis, Insights and Forecast - by Region
- 5.4.1. Indonesia
- 5.4.2. China
- 5.4.3. India
- 5.4.4. Japan
- 5.4.5. South Korea
- 5.4.6. Rest of Asia Pacific
- 5.4.7. United States
- 5.4.8. Canada
- 5.4.9. Mexico
- 5.4.10. Germany
- 5.4.11. United Kingdom
- 5.4.12. Italy
- 5.4.13. France
- 5.4.14. Austria
- 5.4.15. Rest of Europe
- 5.4.16. Brazil
- 5.4.17. Argentina
- 5.4.18. Rest of South America
- 5.4.19. South Africa
- 5.4.20. United Arab Emirates
- 5.4.21. Rest of Middle East and Africa
- 5.1. Market Analysis, Insights and Forecast - by Product Type
- 6. Global Tin Industry Analysis, Insights and Forecast, 2021-2033
- 6.1. Market Analysis, Insights and Forecast - by Product Type
- 6.1.1. Metal
- 6.1.2. Alloy
- 6.1.3. Compounds
- 6.2. Market Analysis, Insights and Forecast - by Application
- 6.2.1. Solder
- 6.2.2. Tin Plating
- 6.2.3. Chemicals
- 6.2.4. Other Ap
- 6.3. Market Analysis, Insights and Forecast - by End-user Industry
- 6.3.1. Automotive
- 6.3.2. Electronics
- 6.3.3. Packaging (Food and Beverage)
- 6.3.4. Glass
- 6.3.5. Other En
- 6.1. Market Analysis, Insights and Forecast - by Product Type
- 7. Indonesia Tin Industry Analysis, Insights and Forecast, 2020-2032
- 7.1. Market Analysis, Insights and Forecast - by Product Type
- 7.1.1. Metal
- 7.1.2. Alloy
- 7.1.3. Compounds
- 7.2. Market Analysis, Insights and Forecast - by Application
- 7.2.1. Solder
- 7.2.2. Tin Plating
- 7.2.3. Chemicals
- 7.2.4. Other Ap
- 7.3. Market Analysis, Insights and Forecast - by End-user Industry
- 7.3.1. Automotive
- 7.3.2. Electronics
- 7.3.3. Packaging (Food and Beverage)
- 7.3.4. Glass
- 7.3.5. Other En
- 7.1. Market Analysis, Insights and Forecast - by Product Type
- 8. China Tin Industry Analysis, Insights and Forecast, 2020-2032
- 8.1. Market Analysis, Insights and Forecast - by Product Type
- 8.1.1. Metal
- 8.1.2. Alloy
- 8.1.3. Compounds
- 8.2. Market Analysis, Insights and Forecast - by Application
- 8.2.1. Solder
- 8.2.2. Tin Plating
- 8.2.3. Chemicals
- 8.2.4. Other Ap
- 8.3. Market Analysis, Insights and Forecast - by End-user Industry
- 8.3.1. Automotive
- 8.3.2. Electronics
- 8.3.3. Packaging (Food and Beverage)
- 8.3.4. Glass
- 8.3.5. Other En
- 8.1. Market Analysis, Insights and Forecast - by Product Type
- 9. India Tin Industry Analysis, Insights and Forecast, 2020-2032
- 9.1. Market Analysis, Insights and Forecast - by Product Type
- 9.1.1. Metal
- 9.1.2. Alloy
- 9.1.3. Compounds
- 9.2. Market Analysis, Insights and Forecast - by Application
- 9.2.1. Solder
- 9.2.2. Tin Plating
- 9.2.3. Chemicals
- 9.2.4. Other Ap
- 9.3. Market Analysis, Insights and Forecast - by End-user Industry
- 9.3.1. Automotive
- 9.3.2. Electronics
- 9.3.3. Packaging (Food and Beverage)
- 9.3.4. Glass
- 9.3.5. Other En
- 9.1. Market Analysis, Insights and Forecast - by Product Type
- 10. Japan Tin Industry Analysis, Insights and Forecast, 2020-2032
- 10.1. Market Analysis, Insights and Forecast - by Product Type
- 10.1.1. Metal
- 10.1.2. Alloy
- 10.1.3. Compounds
- 10.2. Market Analysis, Insights and Forecast - by Application
- 10.2.1. Solder
- 10.2.2. Tin Plating
- 10.2.3. Chemicals
- 10.2.4. Other Ap
- 10.3. Market Analysis, Insights and Forecast - by End-user Industry
- 10.3.1. Automotive
- 10.3.2. Electronics
- 10.3.3. Packaging (Food and Beverage)
- 10.3.4. Glass
- 10.3.5. Other En
- 10.1. Market Analysis, Insights and Forecast - by Product Type
- 11. South Korea Tin Industry Analysis, Insights and Forecast, 2020-2032
- 11.1. Market Analysis, Insights and Forecast - by Product Type
- 11.1.1. Metal
- 11.1.2. Alloy
- 11.1.3. Compounds
- 11.2. Market Analysis, Insights and Forecast - by Application
- 11.2.1. Solder
- 11.2.2. Tin Plating
- 11.2.3. Chemicals
- 11.2.4. Other Ap
- 11.3. Market Analysis, Insights and Forecast - by End-user Industry
- 11.3.1. Automotive
- 11.3.2. Electronics
- 11.3.3. Packaging (Food and Beverage)
- 11.3.4. Glass
- 11.3.5. Other En
- 11.1. Market Analysis, Insights and Forecast - by Product Type
- 12. Rest of Asia Pacific Tin Industry Analysis, Insights and Forecast, 2020-2032
- 12.1. Market Analysis, Insights and Forecast - by Product Type
- 12.1.1. Metal
- 12.1.2. Alloy
- 12.1.3. Compounds
- 12.2. Market Analysis, Insights and Forecast - by Application
- 12.2.1. Solder
- 12.2.2. Tin Plating
- 12.2.3. Chemicals
- 12.2.4. Other Ap
- 12.3. Market Analysis, Insights and Forecast - by End-user Industry
- 12.3.1. Automotive
- 12.3.2. Electronics
- 12.3.3. Packaging (Food and Beverage)
- 12.3.4. Glass
- 12.3.5. Other En
- 12.1. Market Analysis, Insights and Forecast - by Product Type
- 13. United States Tin Industry Analysis, Insights and Forecast, 2020-2032
- 13.1. Market Analysis, Insights and Forecast - by Product Type
- 13.1.1. Metal
- 13.1.2. Alloy
- 13.1.3. Compounds
- 13.2. Market Analysis, Insights and Forecast - by Application
- 13.2.1. Solder
- 13.2.2. Tin Plating
- 13.2.3. Chemicals
- 13.2.4. Other Ap
- 13.3. Market Analysis, Insights and Forecast - by End-user Industry
- 13.3.1. Automotive
- 13.3.2. Electronics
- 13.3.3. Packaging (Food and Beverage)
- 13.3.4. Glass
- 13.3.5. Other En
- 13.1. Market Analysis, Insights and Forecast - by Product Type
- 14. Canada Tin Industry Analysis, Insights and Forecast, 2020-2032
- 14.1. Market Analysis, Insights and Forecast - by Product Type
- 14.1.1. Metal
- 14.1.2. Alloy
- 14.1.3. Compounds
- 14.2. Market Analysis, Insights and Forecast - by Application
- 14.2.1. Solder
- 14.2.2. Tin Plating
- 14.2.3. Chemicals
- 14.2.4. Other Ap
- 14.3. Market Analysis, Insights and Forecast - by End-user Industry
- 14.3.1. Automotive
- 14.3.2. Electronics
- 14.3.3. Packaging (Food and Beverage)
- 14.3.4. Glass
- 14.3.5. Other En
- 14.1. Market Analysis, Insights and Forecast - by Product Type
- 15. Mexico Tin Industry Analysis, Insights and Forecast, 2020-2032
- 15.1. Market Analysis, Insights and Forecast - by Product Type
- 15.1.1. Metal
- 15.1.2. Alloy
- 15.1.3. Compounds
- 15.2. Market Analysis, Insights and Forecast - by Application
- 15.2.1. Solder
- 15.2.2. Tin Plating
- 15.2.3. Chemicals
- 15.2.4. Other Ap
- 15.3. Market Analysis, Insights and Forecast - by End-user Industry
- 15.3.1. Automotive
- 15.3.2. Electronics
- 15.3.3. Packaging (Food and Beverage)
- 15.3.4. Glass
- 15.3.5. Other En
- 15.1. Market Analysis, Insights and Forecast - by Product Type
- 16. Germany Tin Industry Analysis, Insights and Forecast, 2020-2032
- 16.1. Market Analysis, Insights and Forecast - by Product Type
- 16.1.1. Metal
- 16.1.2. Alloy
- 16.1.3. Compounds
- 16.2. Market Analysis, Insights and Forecast - by Application
- 16.2.1. Solder
- 16.2.2. Tin Plating
- 16.2.3. Chemicals
- 16.2.4. Other Ap
- 16.3. Market Analysis, Insights and Forecast - by End-user Industry
- 16.3.1. Automotive
- 16.3.2. Electronics
- 16.3.3. Packaging (Food and Beverage)
- 16.3.4. Glass
- 16.3.5. Other En
- 16.1. Market Analysis, Insights and Forecast - by Product Type
- 17. United Kingdom Tin Industry Analysis, Insights and Forecast, 2020-2032
- 17.1. Market Analysis, Insights and Forecast - by Product Type
- 17.1.1. Metal
- 17.1.2. Alloy
- 17.1.3. Compounds
- 17.2. Market Analysis, Insights and Forecast - by Application
- 17.2.1. Solder
- 17.2.2. Tin Plating
- 17.2.3. Chemicals
- 17.2.4. Other Ap
- 17.3. Market Analysis, Insights and Forecast - by End-user Industry
- 17.3.1. Automotive
- 17.3.2. Electronics
- 17.3.3. Packaging (Food and Beverage)
- 17.3.4. Glass
- 17.3.5. Other En
- 17.1. Market Analysis, Insights and Forecast - by Product Type
- 18. Italy Tin Industry Analysis, Insights and Forecast, 2020-2032
- 18.1. Market Analysis, Insights and Forecast - by Product Type
- 18.1.1. Metal
- 18.1.2. Alloy
- 18.1.3. Compounds
- 18.2. Market Analysis, Insights and Forecast - by Application
- 18.2.1. Solder
- 18.2.2. Tin Plating
- 18.2.3. Chemicals
- 18.2.4. Other Ap
- 18.3. Market Analysis, Insights and Forecast - by End-user Industry
- 18.3.1. Automotive
- 18.3.2. Electronics
- 18.3.3. Packaging (Food and Beverage)
- 18.3.4. Glass
- 18.3.5. Other En
- 18.1. Market Analysis, Insights and Forecast - by Product Type
- 19. France Tin Industry Analysis, Insights and Forecast, 2020-2032
- 19.1. Market Analysis, Insights and Forecast - by Product Type
- 19.1.1. Metal
- 19.1.2. Alloy
- 19.1.3. Compounds
- 19.2. Market Analysis, Insights and Forecast - by Application
- 19.2.1. Solder
- 19.2.2. Tin Plating
- 19.2.3. Chemicals
- 19.2.4. Other Ap
- 19.3. Market Analysis, Insights and Forecast - by End-user Industry
- 19.3.1. Automotive
- 19.3.2. Electronics
- 19.3.3. Packaging (Food and Beverage)
- 19.3.4. Glass
- 19.3.5. Other En
- 19.1. Market Analysis, Insights and Forecast - by Product Type
- 20. Austria Tin Industry Analysis, Insights and Forecast, 2020-2032
- 20.1. Market Analysis, Insights and Forecast - by Product Type
- 20.1.1. Metal
- 20.1.2. Alloy
- 20.1.3. Compounds
- 20.2. Market Analysis, Insights and Forecast - by Application
- 20.2.1. Solder
- 20.2.2. Tin Plating
- 20.2.3. Chemicals
- 20.2.4. Other Ap
- 20.3. Market Analysis, Insights and Forecast - by End-user Industry
- 20.3.1. Automotive
- 20.3.2. Electronics
- 20.3.3. Packaging (Food and Beverage)
- 20.3.4. Glass
- 20.3.5. Other En
- 20.1. Market Analysis, Insights and Forecast - by Product Type
- 21. Rest of Europe Tin Industry Analysis, Insights and Forecast, 2020-2032
- 21.1. Market Analysis, Insights and Forecast - by Product Type
- 21.1.1. Metal
- 21.1.2. Alloy
- 21.1.3. Compounds
- 21.2. Market Analysis, Insights and Forecast - by Application
- 21.2.1. Solder
- 21.2.2. Tin Plating
- 21.2.3. Chemicals
- 21.2.4. Other Ap
- 21.3. Market Analysis, Insights and Forecast - by End-user Industry
- 21.3.1. Automotive
- 21.3.2. Electronics
- 21.3.3. Packaging (Food and Beverage)
- 21.3.4. Glass
- 21.3.5. Other En
- 21.1. Market Analysis, Insights and Forecast - by Product Type
- 22. Brazil Tin Industry Analysis, Insights and Forecast, 2020-2032
- 22.1. Market Analysis, Insights and Forecast - by Product Type
- 22.1.1. Metal
- 22.1.2. Alloy
- 22.1.3. Compounds
- 22.2. Market Analysis, Insights and Forecast - by Application
- 22.2.1. Solder
- 22.2.2. Tin Plating
- 22.2.3. Chemicals
- 22.2.4. Other Ap
- 22.3. Market Analysis, Insights and Forecast - by End-user Industry
- 22.3.1. Automotive
- 22.3.2. Electronics
- 22.3.3. Packaging (Food and Beverage)
- 22.3.4. Glass
- 22.3.5. Other En
- 22.1. Market Analysis, Insights and Forecast - by Product Type
- 23. Argentina Tin Industry Analysis, Insights and Forecast, 2020-2032
- 23.1. Market Analysis, Insights and Forecast - by Product Type
- 23.1.1. Metal
- 23.1.2. Alloy
- 23.1.3. Compounds
- 23.2. Market Analysis, Insights and Forecast - by Application
- 23.2.1. Solder
- 23.2.2. Tin Plating
- 23.2.3. Chemicals
- 23.2.4. Other Ap
- 23.3. Market Analysis, Insights and Forecast - by End-user Industry
- 23.3.1. Automotive
- 23.3.2. Electronics
- 23.3.3. Packaging (Food and Beverage)
- 23.3.4. Glass
- 23.3.5. Other En
- 23.1. Market Analysis, Insights and Forecast - by Product Type
- 24. Rest of South America Tin Industry Analysis, Insights and Forecast, 2020-2032
- 24.1. Market Analysis, Insights and Forecast - by Product Type
- 24.1.1. Metal
- 24.1.2. Alloy
- 24.1.3. Compounds
- 24.2. Market Analysis, Insights and Forecast - by Application
- 24.2.1. Solder
- 24.2.2. Tin Plating
- 24.2.3. Chemicals
- 24.2.4. Other Ap
- 24.3. Market Analysis, Insights and Forecast - by End-user Industry
- 24.3.1. Automotive
- 24.3.2. Electronics
- 24.3.3. Packaging (Food and Beverage)
- 24.3.4. Glass
- 24.3.5. Other En
- 24.1. Market Analysis, Insights and Forecast - by Product Type
- 25. South Africa Tin Industry Analysis, Insights and Forecast, 2020-2032
- 25.1. Market Analysis, Insights and Forecast - by Product Type
- 25.1.1. Metal
- 25.1.2. Alloy
- 25.1.3. Compounds
- 25.2. Market Analysis, Insights and Forecast - by Application
- 25.2.1. Solder
- 25.2.2. Tin Plating
- 25.2.3. Chemicals
- 25.2.4. Other Ap
- 25.3. Market Analysis, Insights and Forecast - by End-user Industry
- 25.3.1. Automotive
- 25.3.2. Electronics
- 25.3.3. Packaging (Food and Beverage)
- 25.3.4. Glass
- 25.3.5. Other En
- 25.1. Market Analysis, Insights and Forecast - by Product Type
- 26. United Arab Emirates Tin Industry Analysis, Insights and Forecast, 2020-2032
- 26.1. Market Analysis, Insights and Forecast - by Product Type
- 26.1.1. Metal
- 26.1.2. Alloy
- 26.1.3. Compounds
- 26.2. Market Analysis, Insights and Forecast - by Application
- 26.2.1. Solder
- 26.2.2. Tin Plating
- 26.2.3. Chemicals
- 26.2.4. Other Ap
- 26.3. Market Analysis, Insights and Forecast - by End-user Industry
- 26.3.1. Automotive
- 26.3.2. Electronics
- 26.3.3. Packaging (Food and Beverage)
- 26.3.4. Glass
- 26.3.5. Other En
- 26.1. Market Analysis, Insights and Forecast - by Product Type
- 27. Rest of Middle East and Africa Tin Industry Analysis, Insights and Forecast, 2020-2032
- 27.1. Market Analysis, Insights and Forecast - by Product Type
- 27.1.1. Metal
- 27.1.2. Alloy
- 27.1.3. Compounds
- 27.2. Market Analysis, Insights and Forecast - by Application
- 27.2.1. Solder
- 27.2.2. Tin Plating
- 27.2.3. Chemicals
- 27.2.4. Other Ap
- 27.3. Market Analysis, Insights and Forecast - by End-user Industry
- 27.3.1. Automotive
- 27.3.2. Electronics
- 27.3.3. Packaging (Food and Beverage)
- 27.3.4. Glass
- 27.3.5. Other En
- 27.1. Market Analysis, Insights and Forecast - by Product Type
- 28. Competitive Analysis
- 28.1. Company Profiles
- 28.1.1 Malaysia Smelting Corporation Berhad
- 28.1.1.1. Company Overview
- 28.1.1.2. Products
- 28.1.1.3. Company Financials
- 28.1.1.4. SWOT Analysis
- 28.1.2 Indium Corporation
- 28.1.2.1. Company Overview
- 28.1.2.2. Products
- 28.1.2.3. Company Financials
- 28.1.2.4. SWOT Analysis
- 28.1.3 ArcelorMittal
- 28.1.3.1. Company Overview
- 28.1.3.2. Products
- 28.1.3.3. Company Financials
- 28.1.3.4. SWOT Analysis
- 28.1.4 MINSUR
- 28.1.4.1. Company Overview
- 28.1.4.2. Products
- 28.1.4.3. Company Financials
- 28.1.4.4. SWOT Analysis
- 28.1.5 Aurubis AG
- 28.1.5.1. Company Overview
- 28.1.5.2. Products
- 28.1.5.3. Company Financials
- 28.1.5.4. SWOT Analysis
- 28.1.6 Avalon Advanced Materials Inc
- 28.1.6.1. Company Overview
- 28.1.6.2. Products
- 28.1.6.3. Company Financials
- 28.1.6.4. SWOT Analysis
- 28.1.7 Timah
- 28.1.7.1. Company Overview
- 28.1.7.2. Products
- 28.1.7.3. Company Financials
- 28.1.7.4. SWOT Analysis
- 28.1.8 YUNNAN TIN COMPANY GROUP LIMITED
- 28.1.8.1. Company Overview
- 28.1.8.2. Products
- 28.1.8.3. Company Financials
- 28.1.8.4. SWOT Analysis
- 28.1.9 Yunnan Chengfeng Non-ferrous Metals Co Ltd
- 28.1.9.1. Company Overview
- 28.1.9.2. Products
- 28.1.9.3. Company Financials
- 28.1.9.4. SWOT Analysis
- 28.1.10 Jiangxi New Nanshan Technology Co Ltd
- 28.1.10.1. Company Overview
- 28.1.10.2. Products
- 28.1.10.3. Company Financials
- 28.1.10.4. SWOT Analysis
- 28.1.11 Thailand Smelting and Refining Co Ltd
- 28.1.11.1. Company Overview
- 28.1.11.2. Products
- 28.1.11.3. Company Financials
- 28.1.11.4. SWOT Analysis
- 28.1.1 Malaysia Smelting Corporation Berhad
- 28.2. Market Entropy
- 28.2.1 Company's Key Areas Served
- 28.2.2 Recent Developments
- 28.3. Company Market Share Analysis 2025
- 28.3.1 Top 5 Companies Market Share Analysis
- 28.3.2 Top 3 Companies Market Share Analysis
- 28.4. List of Potential Customers
- 29. Research Methodology
List of Figures
- Figure 1: Global Tin Industry Revenue Breakdown (billion, %) by Region 2025 & 2033
- Figure 2: Global Tin Industry Volume Breakdown (K Tons, %) by Region 2025 & 2033
- Figure 3: Indonesia Tin Industry Revenue (billion), by Product Type 2025 & 2033
- Figure 4: Indonesia Tin Industry Volume (K Tons), by Product Type 2025 & 2033
- Figure 5: Indonesia Tin Industry Revenue Share (%), by Product Type 2025 & 2033
- Figure 6: Indonesia Tin Industry Volume Share (%), by Product Type 2025 & 2033
- Figure 7: Indonesia Tin Industry Revenue (billion), by Application 2025 & 2033
- Figure 8: Indonesia Tin Industry Volume (K Tons), by Application 2025 & 2033
- Figure 9: Indonesia Tin Industry Revenue Share (%), by Application 2025 & 2033
- Figure 10: Indonesia Tin Industry Volume Share (%), by Application 2025 & 2033
- Figure 11: Indonesia Tin Industry Revenue (billion), by End-user Industry 2025 & 2033
- Figure 12: Indonesia Tin Industry Volume (K Tons), by End-user Industry 2025 & 2033
- Figure 13: Indonesia Tin Industry Revenue Share (%), by End-user Industry 2025 & 2033
- Figure 14: Indonesia Tin Industry Volume Share (%), by End-user Industry 2025 & 2033
- Figure 15: Indonesia Tin Industry Revenue (billion), by Country 2025 & 2033
- Figure 16: Indonesia Tin Industry Volume (K Tons), by Country 2025 & 2033
- Figure 17: Indonesia Tin Industry Revenue Share (%), by Country 2025 & 2033
- Figure 18: Indonesia Tin Industry Volume Share (%), by Country 2025 & 2033
- Figure 19: China Tin Industry Revenue (billion), by Product Type 2025 & 2033
- Figure 20: China Tin Industry Volume (K Tons), by Product Type 2025 & 2033
- Figure 21: China Tin Industry Revenue Share (%), by Product Type 2025 & 2033
- Figure 22: China Tin Industry Volume Share (%), by Product Type 2025 & 2033
- Figure 23: China Tin Industry Revenue (billion), by Application 2025 & 2033
- Figure 24: China Tin Industry Volume (K Tons), by Application 2025 & 2033
- Figure 25: China Tin Industry Revenue Share (%), by Application 2025 & 2033
- Figure 26: China Tin Industry Volume Share (%), by Application 2025 & 2033
- Figure 27: China Tin Industry Revenue (billion), by End-user Industry 2025 & 2033
- Figure 28: China Tin Industry Volume (K Tons), by End-user Industry 2025 & 2033
- Figure 29: China Tin Industry Revenue Share (%), by End-user Industry 2025 & 2033
- Figure 30: China Tin Industry Volume Share (%), by End-user Industry 2025 & 2033
- Figure 31: China Tin Industry Revenue (billion), by Country 2025 & 2033
- Figure 32: China Tin Industry Volume (K Tons), by Country 2025 & 2033
- Figure 33: China Tin Industry Revenue Share (%), by Country 2025 & 2033
- Figure 34: China Tin Industry Volume Share (%), by Country 2025 & 2033
- Figure 35: India Tin Industry Revenue (billion), by Product Type 2025 & 2033
- Figure 36: India Tin Industry Volume (K Tons), by Product Type 2025 & 2033
- Figure 37: India Tin Industry Revenue Share (%), by Product Type 2025 & 2033
- Figure 38: India Tin Industry Volume Share (%), by Product Type 2025 & 2033
- Figure 39: India Tin Industry Revenue (billion), by Application 2025 & 2033
- Figure 40: India Tin Industry Volume (K Tons), by Application 2025 & 2033
- Figure 41: India Tin Industry Revenue Share (%), by Application 2025 & 2033
- Figure 42: India Tin Industry Volume Share (%), by Application 2025 & 2033
- Figure 43: India Tin Industry Revenue (billion), by End-user Industry 2025 & 2033
- Figure 44: India Tin Industry Volume (K Tons), by End-user Industry 2025 & 2033
- Figure 45: India Tin Industry Revenue Share (%), by End-user Industry 2025 & 2033
- Figure 46: India Tin Industry Volume Share (%), by End-user Industry 2025 & 2033
- Figure 47: India Tin Industry Revenue (billion), by Country 2025 & 2033
- Figure 48: India Tin Industry Volume (K Tons), by Country 2025 & 2033
- Figure 49: India Tin Industry Revenue Share (%), by Country 2025 & 2033
- Figure 50: India Tin Industry Volume Share (%), by Country 2025 & 2033
- Figure 51: Japan Tin Industry Revenue (billion), by Product Type 2025 & 2033
- Figure 52: Japan Tin Industry Volume (K Tons), by Product Type 2025 & 2033
- Figure 53: Japan Tin Industry Revenue Share (%), by Product Type 2025 & 2033
- Figure 54: Japan Tin Industry Volume Share (%), by Product Type 2025 & 2033
- Figure 55: Japan Tin Industry Revenue (billion), by Application 2025 & 2033
- Figure 56: Japan Tin Industry Volume (K Tons), by Application 2025 & 2033
- Figure 57: Japan Tin Industry Revenue Share (%), by Application 2025 & 2033
- Figure 58: Japan Tin Industry Volume Share (%), by Application 2025 & 2033
- Figure 59: Japan Tin Industry Revenue (billion), by End-user Industry 2025 & 2033
- Figure 60: Japan Tin Industry Volume (K Tons), by End-user Industry 2025 & 2033
- Figure 61: Japan Tin Industry Revenue Share (%), by End-user Industry 2025 & 2033
- Figure 62: Japan Tin Industry Volume Share (%), by End-user Industry 2025 & 2033
- Figure 63: Japan Tin Industry Revenue (billion), by Country 2025 & 2033
- Figure 64: Japan Tin Industry Volume (K Tons), by Country 2025 & 2033
- Figure 65: Japan Tin Industry Revenue Share (%), by Country 2025 & 2033
- Figure 66: Japan Tin Industry Volume Share (%), by Country 2025 & 2033
- Figure 67: South Korea Tin Industry Revenue (billion), by Product Type 2025 & 2033
- Figure 68: South Korea Tin Industry Volume (K Tons), by Product Type 2025 & 2033
- Figure 69: South Korea Tin Industry Revenue Share (%), by Product Type 2025 & 2033
- Figure 70: South Korea Tin Industry Volume Share (%), by Product Type 2025 & 2033
- Figure 71: South Korea Tin Industry Revenue (billion), by Application 2025 & 2033
- Figure 72: South Korea Tin Industry Volume (K Tons), by Application 2025 & 2033
- Figure 73: South Korea Tin Industry Revenue Share (%), by Application 2025 & 2033
- Figure 74: South Korea Tin Industry Volume Share (%), by Application 2025 & 2033
- Figure 75: South Korea Tin Industry Revenue (billion), by End-user Industry 2025 & 2033
- Figure 76: South Korea Tin Industry Volume (K Tons), by End-user Industry 2025 & 2033
- Figure 77: South Korea Tin Industry Revenue Share (%), by End-user Industry 2025 & 2033
- Figure 78: South Korea Tin Industry Volume Share (%), by End-user Industry 2025 & 2033
- Figure 79: South Korea Tin Industry Revenue (billion), by Country 2025 & 2033
- Figure 80: South Korea Tin Industry Volume (K Tons), by Country 2025 & 2033
- Figure 81: South Korea Tin Industry Revenue Share (%), by Country 2025 & 2033
- Figure 82: South Korea Tin Industry Volume Share (%), by Country 2025 & 2033
- Figure 83: Rest of Asia Pacific Tin Industry Revenue (billion), by Product Type 2025 & 2033
- Figure 84: Rest of Asia Pacific Tin Industry Volume (K Tons), by Product Type 2025 & 2033
- Figure 85: Rest of Asia Pacific Tin Industry Revenue Share (%), by Product Type 2025 & 2033
- Figure 86: Rest of Asia Pacific Tin Industry Volume Share (%), by Product Type 2025 & 2033
- Figure 87: Rest of Asia Pacific Tin Industry Revenue (billion), by Application 2025 & 2033
- Figure 88: Rest of Asia Pacific Tin Industry Volume (K Tons), by Application 2025 & 2033
- Figure 89: Rest of Asia Pacific Tin Industry Revenue Share (%), by Application 2025 & 2033
- Figure 90: Rest of Asia Pacific Tin Industry Volume Share (%), by Application 2025 & 2033
- Figure 91: Rest of Asia Pacific Tin Industry Revenue (billion), by End-user Industry 2025 & 2033
- Figure 92: Rest of Asia Pacific Tin Industry Volume (K Tons), by End-user Industry 2025 & 2033
- Figure 93: Rest of Asia Pacific Tin Industry Revenue Share (%), by End-user Industry 2025 & 2033
- Figure 94: Rest of Asia Pacific Tin Industry Volume Share (%), by End-user Industry 2025 & 2033
- Figure 95: Rest of Asia Pacific Tin Industry Revenue (billion), by Country 2025 & 2033
- Figure 96: Rest of Asia Pacific Tin Industry Volume (K Tons), by Country 2025 & 2033
- Figure 97: Rest of Asia Pacific Tin Industry Revenue Share (%), by Country 2025 & 2033
- Figure 98: Rest of Asia Pacific Tin Industry Volume Share (%), by Country 2025 & 2033
- Figure 99: United States Tin Industry Revenue (billion), by Product Type 2025 & 2033
- Figure 100: United States Tin Industry Volume (K Tons), by Product Type 2025 & 2033
- Figure 101: United States Tin Industry Revenue Share (%), by Product Type 2025 & 2033
- Figure 102: United States Tin Industry Volume Share (%), by Product Type 2025 & 2033
- Figure 103: United States Tin Industry Revenue (billion), by Application 2025 & 2033
- Figure 104: United States Tin Industry Volume (K Tons), by Application 2025 & 2033
- Figure 105: United States Tin Industry Revenue Share (%), by Application 2025 & 2033
- Figure 106: United States Tin Industry Volume Share (%), by Application 2025 & 2033
- Figure 107: United States Tin Industry Revenue (billion), by End-user Industry 2025 & 2033
- Figure 108: United States Tin Industry Volume (K Tons), by End-user Industry 2025 & 2033
- Figure 109: United States Tin Industry Revenue Share (%), by End-user Industry 2025 & 2033
- Figure 110: United States Tin Industry Volume Share (%), by End-user Industry 2025 & 2033
- Figure 111: United States Tin Industry Revenue (billion), by Country 2025 & 2033
- Figure 112: United States Tin Industry Volume (K Tons), by Country 2025 & 2033
- Figure 113: United States Tin Industry Revenue Share (%), by Country 2025 & 2033
- Figure 114: United States Tin Industry Volume Share (%), by Country 2025 & 2033
- Figure 115: Canada Tin Industry Revenue (billion), by Product Type 2025 & 2033
- Figure 116: Canada Tin Industry Volume (K Tons), by Product Type 2025 & 2033
- Figure 117: Canada Tin Industry Revenue Share (%), by Product Type 2025 & 2033
- Figure 118: Canada Tin Industry Volume Share (%), by Product Type 2025 & 2033
- Figure 119: Canada Tin Industry Revenue (billion), by Application 2025 & 2033
- Figure 120: Canada Tin Industry Volume (K Tons), by Application 2025 & 2033
- Figure 121: Canada Tin Industry Revenue Share (%), by Application 2025 & 2033
- Figure 122: Canada Tin Industry Volume Share (%), by Application 2025 & 2033
- Figure 123: Canada Tin Industry Revenue (billion), by End-user Industry 2025 & 2033
- Figure 124: Canada Tin Industry Volume (K Tons), by End-user Industry 2025 & 2033
- Figure 125: Canada Tin Industry Revenue Share (%), by End-user Industry 2025 & 2033
- Figure 126: Canada Tin Industry Volume Share (%), by End-user Industry 2025 & 2033
- Figure 127: Canada Tin Industry Revenue (billion), by Country 2025 & 2033
- Figure 128: Canada Tin Industry Volume (K Tons), by Country 2025 & 2033
- Figure 129: Canada Tin Industry Revenue Share (%), by Country 2025 & 2033
- Figure 130: Canada Tin Industry Volume Share (%), by Country 2025 & 2033
- Figure 131: Mexico Tin Industry Revenue (billion), by Product Type 2025 & 2033
- Figure 132: Mexico Tin Industry Volume (K Tons), by Product Type 2025 & 2033
- Figure 133: Mexico Tin Industry Revenue Share (%), by Product Type 2025 & 2033
- Figure 134: Mexico Tin Industry Volume Share (%), by Product Type 2025 & 2033
- Figure 135: Mexico Tin Industry Revenue (billion), by Application 2025 & 2033
- Figure 136: Mexico Tin Industry Volume (K Tons), by Application 2025 & 2033
- Figure 137: Mexico Tin Industry Revenue Share (%), by Application 2025 & 2033
- Figure 138: Mexico Tin Industry Volume Share (%), by Application 2025 & 2033
- Figure 139: Mexico Tin Industry Revenue (billion), by End-user Industry 2025 & 2033
- Figure 140: Mexico Tin Industry Volume (K Tons), by End-user Industry 2025 & 2033
- Figure 141: Mexico Tin Industry Revenue Share (%), by End-user Industry 2025 & 2033
- Figure 142: Mexico Tin Industry Volume Share (%), by End-user Industry 2025 & 2033
- Figure 143: Mexico Tin Industry Revenue (billion), by Country 2025 & 2033
- Figure 144: Mexico Tin Industry Volume (K Tons), by Country 2025 & 2033
- Figure 145: Mexico Tin Industry Revenue Share (%), by Country 2025 & 2033
- Figure 146: Mexico Tin Industry Volume Share (%), by Country 2025 & 2033
- Figure 147: Germany Tin Industry Revenue (billion), by Product Type 2025 & 2033
- Figure 148: Germany Tin Industry Volume (K Tons), by Product Type 2025 & 2033
- Figure 149: Germany Tin Industry Revenue Share (%), by Product Type 2025 & 2033
- Figure 150: Germany Tin Industry Volume Share (%), by Product Type 2025 & 2033
- Figure 151: Germany Tin Industry Revenue (billion), by Application 2025 & 2033
- Figure 152: Germany Tin Industry Volume (K Tons), by Application 2025 & 2033
- Figure 153: Germany Tin Industry Revenue Share (%), by Application 2025 & 2033
- Figure 154: Germany Tin Industry Volume Share (%), by Application 2025 & 2033
- Figure 155: Germany Tin Industry Revenue (billion), by End-user Industry 2025 & 2033
- Figure 156: Germany Tin Industry Volume (K Tons), by End-user Industry 2025 & 2033
- Figure 157: Germany Tin Industry Revenue Share (%), by End-user Industry 2025 & 2033
- Figure 158: Germany Tin Industry Volume Share (%), by End-user Industry 2025 & 2033
- Figure 159: Germany Tin Industry Revenue (billion), by Country 2025 & 2033
- Figure 160: Germany Tin Industry Volume (K Tons), by Country 2025 & 2033
- Figure 161: Germany Tin Industry Revenue Share (%), by Country 2025 & 2033
- Figure 162: Germany Tin Industry Volume Share (%), by Country 2025 & 2033
- Figure 163: United Kingdom Tin Industry Revenue (billion), by Product Type 2025 & 2033
- Figure 164: United Kingdom Tin Industry Volume (K Tons), by Product Type 2025 & 2033
- Figure 165: United Kingdom Tin Industry Revenue Share (%), by Product Type 2025 & 2033
- Figure 166: United Kingdom Tin Industry Volume Share (%), by Product Type 2025 & 2033
- Figure 167: United Kingdom Tin Industry Revenue (billion), by Application 2025 & 2033
- Figure 168: United Kingdom Tin Industry Volume (K Tons), by Application 2025 & 2033
- Figure 169: United Kingdom Tin Industry Revenue Share (%), by Application 2025 & 2033
- Figure 170: United Kingdom Tin Industry Volume Share (%), by Application 2025 & 2033
- Figure 171: United Kingdom Tin Industry Revenue (billion), by End-user Industry 2025 & 2033
- Figure 172: United Kingdom Tin Industry Volume (K Tons), by End-user Industry 2025 & 2033
- Figure 173: United Kingdom Tin Industry Revenue Share (%), by End-user Industry 2025 & 2033
- Figure 174: United Kingdom Tin Industry Volume Share (%), by End-user Industry 2025 & 2033
- Figure 175: United Kingdom Tin Industry Revenue (billion), by Country 2025 & 2033
- Figure 176: United Kingdom Tin Industry Volume (K Tons), by Country 2025 & 2033
- Figure 177: United Kingdom Tin Industry Revenue Share (%), by Country 2025 & 2033
- Figure 178: United Kingdom Tin Industry Volume Share (%), by Country 2025 & 2033
- Figure 179: Italy Tin Industry Revenue (billion), by Product Type 2025 & 2033
- Figure 180: Italy Tin Industry Volume (K Tons), by Product Type 2025 & 2033
- Figure 181: Italy Tin Industry Revenue Share (%), by Product Type 2025 & 2033
- Figure 182: Italy Tin Industry Volume Share (%), by Product Type 2025 & 2033
- Figure 183: Italy Tin Industry Revenue (billion), by Application 2025 & 2033
- Figure 184: Italy Tin Industry Volume (K Tons), by Application 2025 & 2033
- Figure 185: Italy Tin Industry Revenue Share (%), by Application 2025 & 2033
- Figure 186: Italy Tin Industry Volume Share (%), by Application 2025 & 2033
- Figure 187: Italy Tin Industry Revenue (billion), by End-user Industry 2025 & 2033
- Figure 188: Italy Tin Industry Volume (K Tons), by End-user Industry 2025 & 2033
- Figure 189: Italy Tin Industry Revenue Share (%), by End-user Industry 2025 & 2033
- Figure 190: Italy Tin Industry Volume Share (%), by End-user Industry 2025 & 2033
- Figure 191: Italy Tin Industry Revenue (billion), by Country 2025 & 2033
- Figure 192: Italy Tin Industry Volume (K Tons), by Country 2025 & 2033
- Figure 193: Italy Tin Industry Revenue Share (%), by Country 2025 & 2033
- Figure 194: Italy Tin Industry Volume Share (%), by Country 2025 & 2033
- Figure 195: France Tin Industry Revenue (billion), by Product Type 2025 & 2033
- Figure 196: France Tin Industry Volume (K Tons), by Product Type 2025 & 2033
- Figure 197: France Tin Industry Revenue Share (%), by Product Type 2025 & 2033
- Figure 198: France Tin Industry Volume Share (%), by Product Type 2025 & 2033
- Figure 199: France Tin Industry Revenue (billion), by Application 2025 & 2033
- Figure 200: France Tin Industry Volume (K Tons), by Application 2025 & 2033
- Figure 201: France Tin Industry Revenue Share (%), by Application 2025 & 2033
- Figure 202: France Tin Industry Volume Share (%), by Application 2025 & 2033
- Figure 203: France Tin Industry Revenue (billion), by End-user Industry 2025 & 2033
- Figure 204: France Tin Industry Volume (K Tons), by End-user Industry 2025 & 2033
- Figure 205: France Tin Industry Revenue Share (%), by End-user Industry 2025 & 2033
- Figure 206: France Tin Industry Volume Share (%), by End-user Industry 2025 & 2033
- Figure 207: France Tin Industry Revenue (billion), by Country 2025 & 2033
- Figure 208: France Tin Industry Volume (K Tons), by Country 2025 & 2033
- Figure 209: France Tin Industry Revenue Share (%), by Country 2025 & 2033
- Figure 210: France Tin Industry Volume Share (%), by Country 2025 & 2033
- Figure 211: Austria Tin Industry Revenue (billion), by Product Type 2025 & 2033
- Figure 212: Austria Tin Industry Volume (K Tons), by Product Type 2025 & 2033
- Figure 213: Austria Tin Industry Revenue Share (%), by Product Type 2025 & 2033
- Figure 214: Austria Tin Industry Volume Share (%), by Product Type 2025 & 2033
- Figure 215: Austria Tin Industry Revenue (billion), by Application 2025 & 2033
- Figure 216: Austria Tin Industry Volume (K Tons), by Application 2025 & 2033
- Figure 217: Austria Tin Industry Revenue Share (%), by Application 2025 & 2033
- Figure 218: Austria Tin Industry Volume Share (%), by Application 2025 & 2033
- Figure 219: Austria Tin Industry Revenue (billion), by End-user Industry 2025 & 2033
- Figure 220: Austria Tin Industry Volume (K Tons), by End-user Industry 2025 & 2033
- Figure 221: Austria Tin Industry Revenue Share (%), by End-user Industry 2025 & 2033
- Figure 222: Austria Tin Industry Volume Share (%), by End-user Industry 2025 & 2033
- Figure 223: Austria Tin Industry Revenue (billion), by Country 2025 & 2033
- Figure 224: Austria Tin Industry Volume (K Tons), by Country 2025 & 2033
- Figure 225: Austria Tin Industry Revenue Share (%), by Country 2025 & 2033
- Figure 226: Austria Tin Industry Volume Share (%), by Country 2025 & 2033
- Figure 227: Rest of Europe Tin Industry Revenue (billion), by Product Type 2025 & 2033
- Figure 228: Rest of Europe Tin Industry Volume (K Tons), by Product Type 2025 & 2033
- Figure 229: Rest of Europe Tin Industry Revenue Share (%), by Product Type 2025 & 2033
- Figure 230: Rest of Europe Tin Industry Volume Share (%), by Product Type 2025 & 2033
- Figure 231: Rest of Europe Tin Industry Revenue (billion), by Application 2025 & 2033
- Figure 232: Rest of Europe Tin Industry Volume (K Tons), by Application 2025 & 2033
- Figure 233: Rest of Europe Tin Industry Revenue Share (%), by Application 2025 & 2033
- Figure 234: Rest of Europe Tin Industry Volume Share (%), by Application 2025 & 2033
- Figure 235: Rest of Europe Tin Industry Revenue (billion), by End-user Industry 2025 & 2033
- Figure 236: Rest of Europe Tin Industry Volume (K Tons), by End-user Industry 2025 & 2033
- Figure 237: Rest of Europe Tin Industry Revenue Share (%), by End-user Industry 2025 & 2033
- Figure 238: Rest of Europe Tin Industry Volume Share (%), by End-user Industry 2025 & 2033
- Figure 239: Rest of Europe Tin Industry Revenue (billion), by Country 2025 & 2033
- Figure 240: Rest of Europe Tin Industry Volume (K Tons), by Country 2025 & 2033
- Figure 241: Rest of Europe Tin Industry Revenue Share (%), by Country 2025 & 2033
- Figure 242: Rest of Europe Tin Industry Volume Share (%), by Country 2025 & 2033
- Figure 243: Brazil Tin Industry Revenue (billion), by Product Type 2025 & 2033
- Figure 244: Brazil Tin Industry Volume (K Tons), by Product Type 2025 & 2033
- Figure 245: Brazil Tin Industry Revenue Share (%), by Product Type 2025 & 2033
- Figure 246: Brazil Tin Industry Volume Share (%), by Product Type 2025 & 2033
- Figure 247: Brazil Tin Industry Revenue (billion), by Application 2025 & 2033
- Figure 248: Brazil Tin Industry Volume (K Tons), by Application 2025 & 2033
- Figure 249: Brazil Tin Industry Revenue Share (%), by Application 2025 & 2033
- Figure 250: Brazil Tin Industry Volume Share (%), by Application 2025 & 2033
- Figure 251: Brazil Tin Industry Revenue (billion), by End-user Industry 2025 & 2033
- Figure 252: Brazil Tin Industry Volume (K Tons), by End-user Industry 2025 & 2033
- Figure 253: Brazil Tin Industry Revenue Share (%), by End-user Industry 2025 & 2033
- Figure 254: Brazil Tin Industry Volume Share (%), by End-user Industry 2025 & 2033
- Figure 255: Brazil Tin Industry Revenue (billion), by Country 2025 & 2033
- Figure 256: Brazil Tin Industry Volume (K Tons), by Country 2025 & 2033
- Figure 257: Brazil Tin Industry Revenue Share (%), by Country 2025 & 2033
- Figure 258: Brazil Tin Industry Volume Share (%), by Country 2025 & 2033
- Figure 259: Argentina Tin Industry Revenue (billion), by Product Type 2025 & 2033
- Figure 260: Argentina Tin Industry Volume (K Tons), by Product Type 2025 & 2033
- Figure 261: Argentina Tin Industry Revenue Share (%), by Product Type 2025 & 2033
- Figure 262: Argentina Tin Industry Volume Share (%), by Product Type 2025 & 2033
- Figure 263: Argentina Tin Industry Revenue (billion), by Application 2025 & 2033
- Figure 264: Argentina Tin Industry Volume (K Tons), by Application 2025 & 2033
- Figure 265: Argentina Tin Industry Revenue Share (%), by Application 2025 & 2033
- Figure 266: Argentina Tin Industry Volume Share (%), by Application 2025 & 2033
- Figure 267: Argentina Tin Industry Revenue (billion), by End-user Industry 2025 & 2033
- Figure 268: Argentina Tin Industry Volume (K Tons), by End-user Industry 2025 & 2033
- Figure 269: Argentina Tin Industry Revenue Share (%), by End-user Industry 2025 & 2033
- Figure 270: Argentina Tin Industry Volume Share (%), by End-user Industry 2025 & 2033
- Figure 271: Argentina Tin Industry Revenue (billion), by Country 2025 & 2033
- Figure 272: Argentina Tin Industry Volume (K Tons), by Country 2025 & 2033
- Figure 273: Argentina Tin Industry Revenue Share (%), by Country 2025 & 2033
- Figure 274: Argentina Tin Industry Volume Share (%), by Country 2025 & 2033
- Figure 275: Rest of South America Tin Industry Revenue (billion), by Product Type 2025 & 2033
- Figure 276: Rest of South America Tin Industry Volume (K Tons), by Product Type 2025 & 2033
- Figure 277: Rest of South America Tin Industry Revenue Share (%), by Product Type 2025 & 2033
- Figure 278: Rest of South America Tin Industry Volume Share (%), by Product Type 2025 & 2033
- Figure 279: Rest of South America Tin Industry Revenue (billion), by Application 2025 & 2033
- Figure 280: Rest of South America Tin Industry Volume (K Tons), by Application 2025 & 2033
- Figure 281: Rest of South America Tin Industry Revenue Share (%), by Application 2025 & 2033
- Figure 282: Rest of South America Tin Industry Volume Share (%), by Application 2025 & 2033
- Figure 283: Rest of South America Tin Industry Revenue (billion), by End-user Industry 2025 & 2033
- Figure 284: Rest of South America Tin Industry Volume (K Tons), by End-user Industry 2025 & 2033
- Figure 285: Rest of South America Tin Industry Revenue Share (%), by End-user Industry 2025 & 2033
- Figure 286: Rest of South America Tin Industry Volume Share (%), by End-user Industry 2025 & 2033
- Figure 287: Rest of South America Tin Industry Revenue (billion), by Country 2025 & 2033
- Figure 288: Rest of South America Tin Industry Volume (K Tons), by Country 2025 & 2033
- Figure 289: Rest of South America Tin Industry Revenue Share (%), by Country 2025 & 2033
- Figure 290: Rest of South America Tin Industry Volume Share (%), by Country 2025 & 2033
- Figure 291: South Africa Tin Industry Revenue (billion), by Product Type 2025 & 2033
- Figure 292: South Africa Tin Industry Volume (K Tons), by Product Type 2025 & 2033
- Figure 293: South Africa Tin Industry Revenue Share (%), by Product Type 2025 & 2033
- Figure 294: South Africa Tin Industry Volume Share (%), by Product Type 2025 & 2033
- Figure 295: South Africa Tin Industry Revenue (billion), by Application 2025 & 2033
- Figure 296: South Africa Tin Industry Volume (K Tons), by Application 2025 & 2033
- Figure 297: South Africa Tin Industry Revenue Share (%), by Application 2025 & 2033
- Figure 298: South Africa Tin Industry Volume Share (%), by Application 2025 & 2033
- Figure 299: South Africa Tin Industry Revenue (billion), by End-user Industry 2025 & 2033
- Figure 300: South Africa Tin Industry Volume (K Tons), by End-user Industry 2025 & 2033
- Figure 301: South Africa Tin Industry Revenue Share (%), by End-user Industry 2025 & 2033
- Figure 302: South Africa Tin Industry Volume Share (%), by End-user Industry 2025 & 2033
- Figure 303: South Africa Tin Industry Revenue (billion), by Country 2025 & 2033
- Figure 304: South Africa Tin Industry Volume (K Tons), by Country 2025 & 2033
- Figure 305: South Africa Tin Industry Revenue Share (%), by Country 2025 & 2033
- Figure 306: South Africa Tin Industry Volume Share (%), by Country 2025 & 2033
- Figure 307: United Arab Emirates Tin Industry Revenue (billion), by Product Type 2025 & 2033
- Figure 308: United Arab Emirates Tin Industry Volume (K Tons), by Product Type 2025 & 2033
- Figure 309: United Arab Emirates Tin Industry Revenue Share (%), by Product Type 2025 & 2033
- Figure 310: United Arab Emirates Tin Industry Volume Share (%), by Product Type 2025 & 2033
- Figure 311: United Arab Emirates Tin Industry Revenue (billion), by Application 2025 & 2033
- Figure 312: United Arab Emirates Tin Industry Volume (K Tons), by Application 2025 & 2033
- Figure 313: United Arab Emirates Tin Industry Revenue Share (%), by Application 2025 & 2033
- Figure 314: United Arab Emirates Tin Industry Volume Share (%), by Application 2025 & 2033
- Figure 315: United Arab Emirates Tin Industry Revenue (billion), by End-user Industry 2025 & 2033
- Figure 316: United Arab Emirates Tin Industry Volume (K Tons), by End-user Industry 2025 & 2033
- Figure 317: United Arab Emirates Tin Industry Revenue Share (%), by End-user Industry 2025 & 2033
- Figure 318: United Arab Emirates Tin Industry Volume Share (%), by End-user Industry 2025 & 2033
- Figure 319: United Arab Emirates Tin Industry Revenue (billion), by Country 2025 & 2033
- Figure 320: United Arab Emirates Tin Industry Volume (K Tons), by Country 2025 & 2033
- Figure 321: United Arab Emirates Tin Industry Revenue Share (%), by Country 2025 & 2033
- Figure 322: United Arab Emirates Tin Industry Volume Share (%), by Country 2025 & 2033
- Figure 323: Rest of Middle East and Africa Tin Industry Revenue (billion), by Product Type 2025 & 2033
- Figure 324: Rest of Middle East and Africa Tin Industry Volume (K Tons), by Product Type 2025 & 2033
- Figure 325: Rest of Middle East and Africa Tin Industry Revenue Share (%), by Product Type 2025 & 2033
- Figure 326: Rest of Middle East and Africa Tin Industry Volume Share (%), by Product Type 2025 & 2033
- Figure 327: Rest of Middle East and Africa Tin Industry Revenue (billion), by Application 2025 & 2033
- Figure 328: Rest of Middle East and Africa Tin Industry Volume (K Tons), by Application 2025 & 2033
- Figure 329: Rest of Middle East and Africa Tin Industry Revenue Share (%), by Application 2025 & 2033
- Figure 330: Rest of Middle East and Africa Tin Industry Volume Share (%), by Application 2025 & 2033
- Figure 331: Rest of Middle East and Africa Tin Industry Revenue (billion), by End-user Industry 2025 & 2033
- Figure 332: Rest of Middle East and Africa Tin Industry Volume (K Tons), by End-user Industry 2025 & 2033
- Figure 333: Rest of Middle East and Africa Tin Industry Revenue Share (%), by End-user Industry 2025 & 2033
- Figure 334: Rest of Middle East and Africa Tin Industry Volume Share (%), by End-user Industry 2025 & 2033
- Figure 335: Rest of Middle East and Africa Tin Industry Revenue (billion), by Country 2025 & 2033
- Figure 336: Rest of Middle East and Africa Tin Industry Volume (K Tons), by Country 2025 & 2033
- Figure 337: Rest of Middle East and Africa Tin Industry Revenue Share (%), by Country 2025 & 2033
- Figure 338: Rest of Middle East and Africa Tin Industry Volume Share (%), by Country 2025 & 2033
List of Tables
- Table 1: Global Tin Industry Revenue billion Forecast, by Product Type 2020 & 2033
- Table 2: Global Tin Industry Volume K Tons Forecast, by Product Type 2020 & 2033
- Table 3: Global Tin Industry Revenue billion Forecast, by Application 2020 & 2033
- Table 4: Global Tin Industry Volume K Tons Forecast, by Application 2020 & 2033
- Table 5: Global Tin Industry Revenue billion Forecast, by End-user Industry 2020 & 2033
- Table 6: Global Tin Industry Volume K Tons Forecast, by End-user Industry 2020 & 2033
- Table 7: Global Tin Industry Revenue billion Forecast, by Region 2020 & 2033
- Table 8: Global Tin Industry Volume K Tons Forecast, by Region 2020 & 2033
- Table 9: Global Tin Industry Revenue billion Forecast, by Product Type 2020 & 2033
- Table 10: Global Tin Industry Volume K Tons Forecast, by Product Type 2020 & 2033
- Table 11: Global Tin Industry Revenue billion Forecast, by Application 2020 & 2033
- Table 12: Global Tin Industry Volume K Tons Forecast, by Application 2020 & 2033
- Table 13: Global Tin Industry Revenue billion Forecast, by End-user Industry 2020 & 2033
- Table 14: Global Tin Industry Volume K Tons Forecast, by End-user Industry 2020 & 2033
- Table 15: Global Tin Industry Revenue billion Forecast, by Country 2020 & 2033
- Table 16: Global Tin Industry Volume K Tons Forecast, by Country 2020 & 2033
- Table 17: Malaysia Tin Industry Revenue (billion) Forecast, by Application 2020 & 2033
- Table 18: Malaysia Tin Industry Volume (K Tons) Forecast, by Application 2020 & 2033
- Table 19: Peru Tin Industry Revenue (billion) Forecast, by Application 2020 & 2033
- Table 20: Peru Tin Industry Volume (K Tons) Forecast, by Application 2020 & 2033
- Table 21: Vietnam Tin Industry Revenue (billion) Forecast, by Application 2020 & 2033
- Table 22: Vietnam Tin Industry Volume (K Tons) Forecast, by Application 2020 & 2033
- Table 23: Other Countries Tin Industry Revenue (billion) Forecast, by Application 2020 & 2033
- Table 24: Other Countries Tin Industry Volume (K Tons) Forecast, by Application 2020 & 2033
- Table 25: Global Tin Industry Revenue billion Forecast, by Product Type 2020 & 2033
- Table 26: Global Tin Industry Volume K Tons Forecast, by Product Type 2020 & 2033
- Table 27: Global Tin Industry Revenue billion Forecast, by Application 2020 & 2033
- Table 28: Global Tin Industry Volume K Tons Forecast, by Application 2020 & 2033
- Table 29: Global Tin Industry Revenue billion Forecast, by End-user Industry 2020 & 2033
- Table 30: Global Tin Industry Volume K Tons Forecast, by End-user Industry 2020 & 2033
- Table 31: Global Tin Industry Revenue billion Forecast, by Country 2020 & 2033
- Table 32: Global Tin Industry Volume K Tons Forecast, by Country 2020 & 2033
- Table 33: Global Tin Industry Revenue billion Forecast, by Product Type 2020 & 2033
- Table 34: Global Tin Industry Volume K Tons Forecast, by Product Type 2020 & 2033
- Table 35: Global Tin Industry Revenue billion Forecast, by Application 2020 & 2033
- Table 36: Global Tin Industry Volume K Tons Forecast, by Application 2020 & 2033
- Table 37: Global Tin Industry Revenue billion Forecast, by End-user Industry 2020 & 2033
- Table 38: Global Tin Industry Volume K Tons Forecast, by End-user Industry 2020 & 2033
- Table 39: Global Tin Industry Revenue billion Forecast, by Country 2020 & 2033
- Table 40: Global Tin Industry Volume K Tons Forecast, by Country 2020 & 2033
- Table 41: Global Tin Industry Revenue billion Forecast, by Product Type 2020 & 2033
- Table 42: Global Tin Industry Volume K Tons Forecast, by Product Type 2020 & 2033
- Table 43: Global Tin Industry Revenue billion Forecast, by Application 2020 & 2033
- Table 44: Global Tin Industry Volume K Tons Forecast, by Application 2020 & 2033
- Table 45: Global Tin Industry Revenue billion Forecast, by End-user Industry 2020 & 2033
- Table 46: Global Tin Industry Volume K Tons Forecast, by End-user Industry 2020 & 2033
- Table 47: Global Tin Industry Revenue billion Forecast, by Country 2020 & 2033
- Table 48: Global Tin Industry Volume K Tons Forecast, by Country 2020 & 2033
- Table 49: Global Tin Industry Revenue billion Forecast, by Product Type 2020 & 2033
- Table 50: Global Tin Industry Volume K Tons Forecast, by Product Type 2020 & 2033
- Table 51: Global Tin Industry Revenue billion Forecast, by Application 2020 & 2033
- Table 52: Global Tin Industry Volume K Tons Forecast, by Application 2020 & 2033
- Table 53: Global Tin Industry Revenue billion Forecast, by End-user Industry 2020 & 2033
- Table 54: Global Tin Industry Volume K Tons Forecast, by End-user Industry 2020 & 2033
- Table 55: Global Tin Industry Revenue billion Forecast, by Country 2020 & 2033
- Table 56: Global Tin Industry Volume K Tons Forecast, by Country 2020 & 2033
- Table 57: Global Tin Industry Revenue billion Forecast, by Product Type 2020 & 2033
- Table 58: Global Tin Industry Volume K Tons Forecast, by Product Type 2020 & 2033
- Table 59: Global Tin Industry Revenue billion Forecast, by Application 2020 & 2033
- Table 60: Global Tin Industry Volume K Tons Forecast, by Application 2020 & 2033
- Table 61: Global Tin Industry Revenue billion Forecast, by End-user Industry 2020 & 2033
- Table 62: Global Tin Industry Volume K Tons Forecast, by End-user Industry 2020 & 2033
- Table 63: Global Tin Industry Revenue billion Forecast, by Country 2020 & 2033
- Table 64: Global Tin Industry Volume K Tons Forecast, by Country 2020 & 2033
- Table 65: North America Tin Industry Revenue (billion) Forecast, by Application 2020 & 2033
- Table 66: North America Tin Industry Volume (K Tons) Forecast, by Application 2020 & 2033
- Table 67: Global Tin Industry Revenue billion Forecast, by Product Type 2020 & 2033
- Table 68: Global Tin Industry Volume K Tons Forecast, by Product Type 2020 & 2033
- Table 69: Global Tin Industry Revenue billion Forecast, by Application 2020 & 2033
- Table 70: Global Tin Industry Volume K Tons Forecast, by Application 2020 & 2033
- Table 71: Global Tin Industry Revenue billion Forecast, by End-user Industry 2020 & 2033
- Table 72: Global Tin Industry Volume K Tons Forecast, by End-user Industry 2020 & 2033
- Table 73: Global Tin Industry Revenue billion Forecast, by Country 2020 & 2033
- Table 74: Global Tin Industry Volume K Tons Forecast, by Country 2020 & 2033
- Table 75: Global Tin Industry Revenue billion Forecast, by Product Type 2020 & 2033
- Table 76: Global Tin Industry Volume K Tons Forecast, by Product Type 2020 & 2033
- Table 77: Global Tin Industry Revenue billion Forecast, by Application 2020 & 2033
- Table 78: Global Tin Industry Volume K Tons Forecast, by Application 2020 & 2033
- Table 79: Global Tin Industry Revenue billion Forecast, by End-user Industry 2020 & 2033
- Table 80: Global Tin Industry Volume K Tons Forecast, by End-user Industry 2020 & 2033
- Table 81: Global Tin Industry Revenue billion Forecast, by Country 2020 & 2033
- Table 82: Global Tin Industry Volume K Tons Forecast, by Country 2020 & 2033
- Table 83: Global Tin Industry Revenue billion Forecast, by Product Type 2020 & 2033
- Table 84: Global Tin Industry Volume K Tons Forecast, by Product Type 2020 & 2033
- Table 85: Global Tin Industry Revenue billion Forecast, by Application 2020 & 2033
- Table 86: Global Tin Industry Volume K Tons Forecast, by Application 2020 & 2033
- Table 87: Global Tin Industry Revenue billion Forecast, by End-user Industry 2020 & 2033
- Table 88: Global Tin Industry Volume K Tons Forecast, by End-user Industry 2020 & 2033
- Table 89: Global Tin Industry Revenue billion Forecast, by Country 2020 & 2033
- Table 90: Global Tin Industry Volume K Tons Forecast, by Country 2020 & 2033
- Table 91: Europe Tin Industry Revenue (billion) Forecast, by Application 2020 & 2033
- Table 92: Europe Tin Industry Volume (K Tons) Forecast, by Application 2020 & 2033
- Table 93: Global Tin Industry Revenue billion Forecast, by Product Type 2020 & 2033
- Table 94: Global Tin Industry Volume K Tons Forecast, by Product Type 2020 & 2033
- Table 95: Global Tin Industry Revenue billion Forecast, by Application 2020 & 2033
- Table 96: Global Tin Industry Volume K Tons Forecast, by Application 2020 & 2033
- Table 97: Global Tin Industry Revenue billion Forecast, by End-user Industry 2020 & 2033
- Table 98: Global Tin Industry Volume K Tons Forecast, by End-user Industry 2020 & 2033
- Table 99: Global Tin Industry Revenue billion Forecast, by Country 2020 & 2033
- Table 100: Global Tin Industry Volume K Tons Forecast, by Country 2020 & 2033
- Table 101: Global Tin Industry Revenue billion Forecast, by Product Type 2020 & 2033
- Table 102: Global Tin Industry Volume K Tons Forecast, by Product Type 2020 & 2033
- Table 103: Global Tin Industry Revenue billion Forecast, by Application 2020 & 2033
- Table 104: Global Tin Industry Volume K Tons Forecast, by Application 2020 & 2033
- Table 105: Global Tin Industry Revenue billion Forecast, by End-user Industry 2020 & 2033
- Table 106: Global Tin Industry Volume K Tons Forecast, by End-user Industry 2020 & 2033
- Table 107: Global Tin Industry Revenue billion Forecast, by Country 2020 & 2033
- Table 108: Global Tin Industry Volume K Tons Forecast, by Country 2020 & 2033
- Table 109: Global Tin Industry Revenue billion Forecast, by Product Type 2020 & 2033
- Table 110: Global Tin Industry Volume K Tons Forecast, by Product Type 2020 & 2033
- Table 111: Global Tin Industry Revenue billion Forecast, by Application 2020 & 2033
- Table 112: Global Tin Industry Volume K Tons Forecast, by Application 2020 & 2033
- Table 113: Global Tin Industry Revenue billion Forecast, by End-user Industry 2020 & 2033
- Table 114: Global Tin Industry Volume K Tons Forecast, by End-user Industry 2020 & 2033
- Table 115: Global Tin Industry Revenue billion Forecast, by Country 2020 & 2033
- Table 116: Global Tin Industry Volume K Tons Forecast, by Country 2020 & 2033
- Table 117: Global Tin Industry Revenue billion Forecast, by Product Type 2020 & 2033
- Table 118: Global Tin Industry Volume K Tons Forecast, by Product Type 2020 & 2033
- Table 119: Global Tin Industry Revenue billion Forecast, by Application 2020 & 2033
- Table 120: Global Tin Industry Volume K Tons Forecast, by Application 2020 & 2033
- Table 121: Global Tin Industry Revenue billion Forecast, by End-user Industry 2020 & 2033
- Table 122: Global Tin Industry Volume K Tons Forecast, by End-user Industry 2020 & 2033
- Table 123: Global Tin Industry Revenue billion Forecast, by Country 2020 & 2033
- Table 124: Global Tin Industry Volume K Tons Forecast, by Country 2020 & 2033
- Table 125: Global Tin Industry Revenue billion Forecast, by Product Type 2020 & 2033
- Table 126: Global Tin Industry Volume K Tons Forecast, by Product Type 2020 & 2033
- Table 127: Global Tin Industry Revenue billion Forecast, by Application 2020 & 2033
- Table 128: Global Tin Industry Volume K Tons Forecast, by Application 2020 & 2033
- Table 129: Global Tin Industry Revenue billion Forecast, by End-user Industry 2020 & 2033
- Table 130: Global Tin Industry Volume K Tons Forecast, by End-user Industry 2020 & 2033
- Table 131: Global Tin Industry Revenue billion Forecast, by Country 2020 & 2033
- Table 132: Global Tin Industry Volume K Tons Forecast, by Country 2020 & 2033
- Table 133: Global Tin Industry Revenue billion Forecast, by Product Type 2020 & 2033
- Table 134: Global Tin Industry Volume K Tons Forecast, by Product Type 2020 & 2033
- Table 135: Global Tin Industry Revenue billion Forecast, by Application 2020 & 2033
- Table 136: Global Tin Industry Volume K Tons Forecast, by Application 2020 & 2033
- Table 137: Global Tin Industry Revenue billion Forecast, by End-user Industry 2020 & 2033
- Table 138: Global Tin Industry Volume K Tons Forecast, by End-user Industry 2020 & 2033
- Table 139: Global Tin Industry Revenue billion Forecast, by Country 2020 & 2033
- Table 140: Global Tin Industry Volume K Tons Forecast, by Country 2020 & 2033
- Table 141: South America Tin Industry Revenue (billion) Forecast, by Application 2020 & 2033
- Table 142: South America Tin Industry Volume (K Tons) Forecast, by Application 2020 & 2033
- Table 143: Global Tin Industry Revenue billion Forecast, by Product Type 2020 & 2033
- Table 144: Global Tin Industry Volume K Tons Forecast, by Product Type 2020 & 2033
- Table 145: Global Tin Industry Revenue billion Forecast, by Application 2020 & 2033
- Table 146: Global Tin Industry Volume K Tons Forecast, by Application 2020 & 2033
- Table 147: Global Tin Industry Revenue billion Forecast, by End-user Industry 2020 & 2033
- Table 148: Global Tin Industry Volume K Tons Forecast, by End-user Industry 2020 & 2033
- Table 149: Global Tin Industry Revenue billion Forecast, by Country 2020 & 2033
- Table 150: Global Tin Industry Volume K Tons Forecast, by Country 2020 & 2033
- Table 151: Global Tin Industry Revenue billion Forecast, by Product Type 2020 & 2033
- Table 152: Global Tin Industry Volume K Tons Forecast, by Product Type 2020 & 2033
- Table 153: Global Tin Industry Revenue billion Forecast, by Application 2020 & 2033
- Table 154: Global Tin Industry Volume K Tons Forecast, by Application 2020 & 2033
- Table 155: Global Tin Industry Revenue billion Forecast, by End-user Industry 2020 & 2033
- Table 156: Global Tin Industry Volume K Tons Forecast, by End-user Industry 2020 & 2033
- Table 157: Global Tin Industry Revenue billion Forecast, by Country 2020 & 2033
- Table 158: Global Tin Industry Volume K Tons Forecast, by Country 2020 & 2033
- Table 159: Global Tin Industry Revenue billion Forecast, by Product Type 2020 & 2033
- Table 160: Global Tin Industry Volume K Tons Forecast, by Product Type 2020 & 2033
- Table 161: Global Tin Industry Revenue billion Forecast, by Application 2020 & 2033
- Table 162: Global Tin Industry Volume K Tons Forecast, by Application 2020 & 2033
- Table 163: Global Tin Industry Revenue billion Forecast, by End-user Industry 2020 & 2033
- Table 164: Global Tin Industry Volume K Tons Forecast, by End-user Industry 2020 & 2033
- Table 165: Global Tin Industry Revenue billion Forecast, by Country 2020 & 2033
- Table 166: Global Tin Industry Volume K Tons Forecast, by Country 2020 & 2033
- Table 167: Middle East and Africa Tin Industry Revenue (billion) Forecast, by Application 2020 & 2033
- Table 168: Middle East and Africa Tin Industry Volume (K Tons) Forecast, by Application 2020 & 2033
- Table 169: Global Tin Industry Revenue billion Forecast, by Product Type 2020 & 2033
- Table 170: Global Tin Industry Volume K Tons Forecast, by Product Type 2020 & 2033
- Table 171: Global Tin Industry Revenue billion Forecast, by Application 2020 & 2033
- Table 172: Global Tin Industry Volume K Tons Forecast, by Application 2020 & 2033
- Table 173: Global Tin Industry Revenue billion Forecast, by End-user Industry 2020 & 2033
- Table 174: Global Tin Industry Volume K Tons Forecast, by End-user Industry 2020 & 2033
- Table 175: Global Tin Industry Revenue billion Forecast, by Country 2020 & 2033
- Table 176: Global Tin Industry Volume K Tons Forecast, by Country 2020 & 2033
- Table 177: Global Tin Industry Revenue billion Forecast, by Product Type 2020 & 2033
- Table 178: Global Tin Industry Volume K Tons Forecast, by Product Type 2020 & 2033
- Table 179: Global Tin Industry Revenue billion Forecast, by Application 2020 & 2033
- Table 180: Global Tin Industry Volume K Tons Forecast, by Application 2020 & 2033
- Table 181: Global Tin Industry Revenue billion Forecast, by End-user Industry 2020 & 2033
- Table 182: Global Tin Industry Volume K Tons Forecast, by End-user Industry 2020 & 2033
- Table 183: Global Tin Industry Revenue billion Forecast, by Country 2020 & 2033
- Table 184: Global Tin Industry Volume K Tons Forecast, by Country 2020 & 2033
- Table 185: Global Tin Industry Revenue billion Forecast, by Product Type 2020 & 2033
- Table 186: Global Tin Industry Volume K Tons Forecast, by Product Type 2020 & 2033
- Table 187: Global Tin Industry Revenue billion Forecast, by Application 2020 & 2033
- Table 188: Global Tin Industry Volume K Tons Forecast, by Application 2020 & 2033
- Table 189: Global Tin Industry Revenue billion Forecast, by End-user Industry 2020 & 2033
- Table 190: Global Tin Industry Volume K Tons Forecast, by End-user Industry 2020 & 2033
- Table 191: Global Tin Industry Revenue billion Forecast, by Country 2020 & 2033
- Table 192: Global Tin Industry Volume K Tons Forecast, by Country 2020 & 2033
Frequently Asked Questions
1. What is the projected Compound Annual Growth Rate (CAGR) of the Tin Industry?
The projected CAGR is approximately 3.751%.
2. Which companies are prominent players in the Tin Industry?
Key companies in the market include Malaysia Smelting Corporation Berhad, Indium Corporation, ArcelorMittal, MINSUR, Aurubis AG, Avalon Advanced Materials Inc, Timah, YUNNAN TIN COMPANY GROUP LIMITED, Yunnan Chengfeng Non-ferrous Metals Co Ltd, Jiangxi New Nanshan Technology Co Ltd, Thailand Smelting and Refining Co Ltd.
3. What are the main segments of the Tin Industry?
The market segments include Product Type, Application, End-user Industry.
4. Can you provide details about the market size?
The market size is estimated to be USD 7.65 billion as of 2022.
5. What are some drivers contributing to market growth?
Surging Demand from the Electric Vehicle Market; Increasing Applications in the Electrical and the Electronics Industry; Other Drivers.
6. What are the notable trends driving market growth?
The Electronic Segment to Dominate the Market Growth.
7. Are there any restraints impacting market growth?
Presence of Subsitutes; Other Restraints.
8. Can you provide examples of recent developments in the market?
November 2023: Cornish Tin secured GBP 1.1 million (USD 1.38 million) from 1,700 investors on Crowdcube, more than 250% of the fundraising goal for its Cornwall tin exploration project, Great Wheal Vor.
9. What pricing options are available for accessing the report?
Pricing options include single-user, multi-user, and enterprise licenses priced at USD 4750, USD 5250, and USD 8750 respectively.
10. Is the market size provided in terms of value or volume?
The market size is provided in terms of value, measured in billion and volume, measured in K Tons.
11. Are there any specific market keywords associated with the report?
Yes, the market keyword associated with the report is "Tin Industry," which aids in identifying and referencing the specific market segment covered.
12. How do I determine which pricing option suits my needs best?
The pricing options vary based on user requirements and access needs. Individual users may opt for single-user licenses, while businesses requiring broader access may choose multi-user or enterprise licenses for cost-effective access to the report.
13. Are there any additional resources or data provided in the Tin Industry report?
While the report offers comprehensive insights, it's advisable to review the specific contents or supplementary materials provided to ascertain if additional resources or data are available.
14. How can I stay updated on further developments or reports in the Tin Industry?
To stay informed about further developments, trends, and reports in the Tin Industry, consider subscribing to industry newsletters, following relevant companies and organizations, or regularly checking reputable industry news sources and publications.
Methodology
Step 1 - Identification of Relevant Samples Size from Population Database


Step 2 - Approaches for Defining Global Market Size (Value, Volume* & Price*)

Note*: In applicable scenarios
Step 3 - Data Sources
Primary Research
- Web Analytics
- Survey Reports
- Research Institute
- Latest Research Reports
- Opinion Leaders
Secondary Research
- Annual Reports
- White Paper
- Latest Press Release
- Industry Association
- Paid Database
- Investor Presentations

Step 4 - Data Triangulation
Involves using different sources of information in order to increase the validity of a study
These sources are likely to be stakeholders in a program - participants, other researchers, program staff, other community members, and so on.
Then we put all data in single framework & apply various statistical tools to find out the dynamic on the market.
During the analysis stage, feedback from the stakeholder groups would be compared to determine areas of agreement as well as areas of divergence