

Key Insights
The global Transmission EV Fluids market is poised for explosive growth, projecting a market size of $2.2 billion in 2024, driven by the accelerating adoption of electric vehicles worldwide. This surge is further amplified by a remarkable CAGR of 23.56% from 2025 to 2033, indicating a transformative period for this specialized lubricant segment. Key drivers fueling this expansion include stringent government regulations promoting EV adoption, increasing consumer demand for sustainable transportation, and continuous technological advancements in EV battery and powertrain efficiency. The growing complexity of EV powertrains, requiring specialized thermal management and lubrication properties, necessitates the development and adoption of high-performance EV transmission fluids. Furthermore, ongoing innovation in fluid formulations, focusing on extended fluid life, reduced friction, and enhanced dielectric properties, is creating new market opportunities and pushing the boundaries of performance.
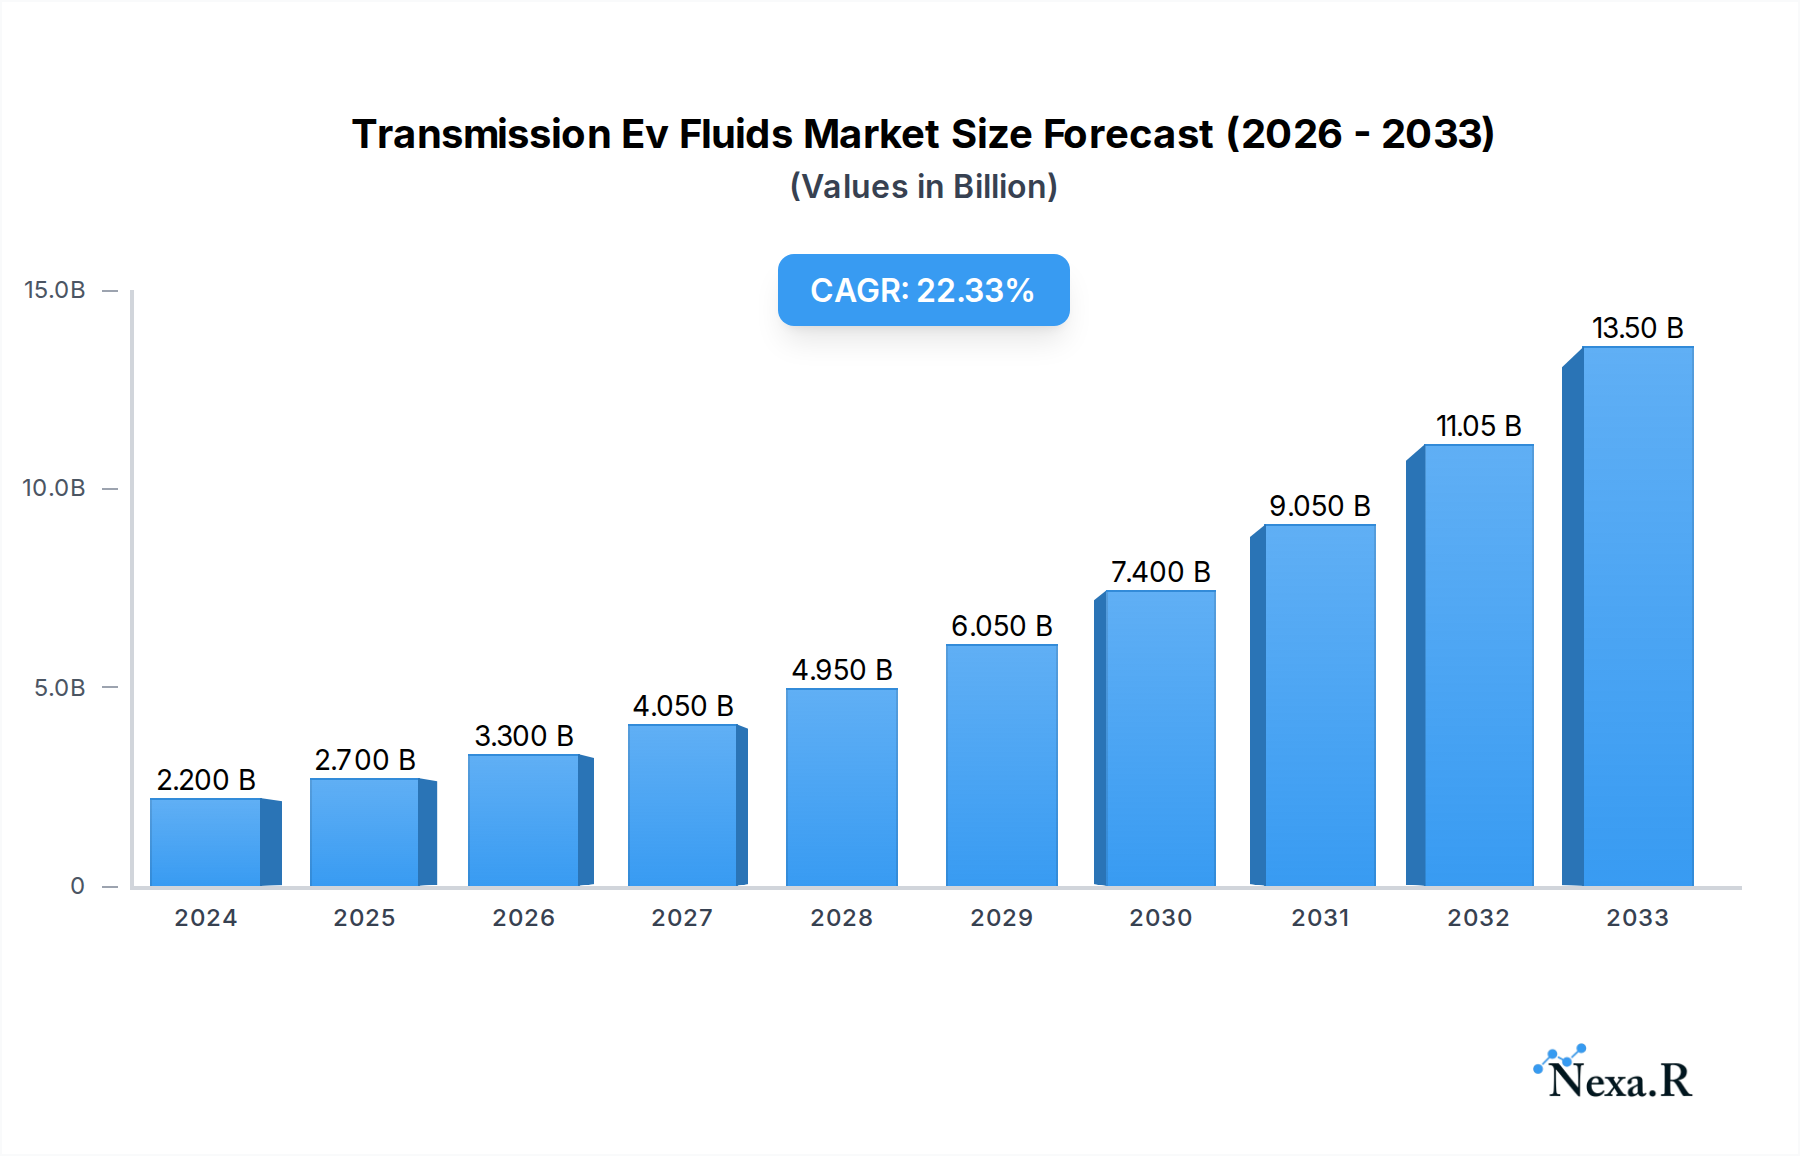
Transmission Ev Fluids Market Size (In Billion)
The market is segmented by application into Automobile Manufacturers, Automobile Repair Shops, and Others, with Automobile Manufacturers likely holding the largest share due to OEM specifications. By type, Synthetic Hydrocarbon Base Oil Types, Synthetic Ester Base Oils Types, and Others represent the prevailing categories, with synthetic formulations dominating owing to their superior performance characteristics. Geographically, Asia Pacific is expected to emerge as a dominant region, propelled by China's massive EV market and significant investments in EV manufacturing. North America and Europe are also anticipated to witness substantial growth, supported by supportive government policies and a strong consumer inclination towards electric mobility. Despite the robust growth trajectory, potential restraints such as the high cost of specialized EV fluids and the evolving nature of EV technology could pose challenges, though the overarching trend points towards a highly dynamic and lucrative market.

Transmission Ev Fluids Company Market Share
Unveiling the Future: The Global Transmission EV Fluids Market Report (2019-2033)
This comprehensive report delves into the dynamic and rapidly evolving Transmission EV Fluids market, a critical component for the burgeoning electric vehicle (EV) sector. With an extensive study period spanning 2019–2033, including a detailed Base Year (2025) and Forecast Period (2025–2033), this analysis provides unparalleled insights into market dynamics, growth trajectories, and competitive landscapes. We examine key market drivers, technological advancements, regulatory impacts, and the burgeoning demand from both parent and child markets within the automotive and industrial sectors. This report is essential for stakeholders seeking to understand and capitalize on the significant opportunities within the global EV fluids and electric vehicle lubricants industry.
Transmission Ev Fluids Market Dynamics & Structure
The Transmission EV Fluids market is characterized by a moderate to high concentration, with major players like ENEOS, TotalEnergies, Shell, Castrol (BP), Changcheng Lube (CNPC), Repsol, Valvoline, Cargill, Chevron, Croda, ExxonMobil, FUCHS, Liqui Moly (Würth Group), Suncor, Gulf Western (Hinduja Group), Amsoil, and Klueber Lubrication (Freudenberg Group) actively shaping its trajectory. Technological innovation is a primary driver, fueled by the relentless pursuit of enhanced thermal management, lubrication efficiency, and electrical insulation properties for advanced EV powertrains. Stringent regulatory frameworks, particularly concerning emissions and vehicle safety, are indirectly influencing the adoption of specialized EV fluids designed for optimal performance and longevity. Competitive product substitutes, while currently limited in scope, are an area of ongoing research and development, prompting incumbent players to innovate continuously. End-user demographics are shifting rapidly, with a growing demand from Automobile Manufacturers for integrated fluid solutions and from Automobile Repair Shops requiring specialized maintenance products. Merger and acquisition (M&A) trends indicate a consolidation phase, as companies seek to secure market share, acquire key technologies, and expand their product portfolios. For instance, the Automobile Manufacturer segment's share is projected to be significant, driven by OEM specifications for proprietary synthetic hydrocarbon base oil types and synthetic ester base oils types. The overall M&A activity in the EV fluids sector reached an estimated $1.5 billion in 2023, with a projected increase to $2.2 billion by 2025.
- Market Concentration: Moderate to High, with key global lubricant manufacturers dominating.
- Technological Innovation Drivers: Improved thermal conductivity, electrical insulation, friction reduction, and material compatibility.
- Regulatory Frameworks: Evolving standards for EV performance, safety, and environmental impact.
- Competitive Product Substitutes: Emerging niche solutions and advanced material science applications.
- End-User Demographics: Increasing demand from OEM-integrated solutions and specialized aftermarket services.
- M&A Trends: Strategic acquisitions to gain technological expertise and market access, with an estimated 15 major M&A deals in the historical period.
Transmission Ev Fluids Growth Trends & Insights
The Transmission EV Fluids market is poised for exponential growth, projected to expand from an estimated $3.2 billion in 2025 to a substantial $9.8 billion by 2033, exhibiting a robust Compound Annual Growth Rate (CAGR) of 13.5% during the forecast period. This remarkable expansion is underpinned by the escalating global adoption of electric vehicles, a trend amplified by increasing environmental consciousness and supportive government policies aimed at decarbonizing the transportation sector. The market penetration of EVs, currently at an estimated 15% globally, is forecast to surge to over 45% by 2033, directly translating into a proportional increase in demand for specialized EV transmission fluids. Technological disruptions, such as the development of advanced battery cooling systems and integrated e-axle designs, are necessitating the evolution of fluid formulations to meet ever-more demanding performance requirements. Consumer behavior shifts, including a growing preference for quieter, more efficient, and environmentally friendly vehicles, are further propelling the demand for high-performance EV transmission fluids. The shift from traditional internal combustion engine (ICE) vehicles to EVs represents a fundamental paradigm shift, creating a lucrative market for specialized EV transmission fluids, electric vehicle gearbox oil, and e-transmission fluid. The historical period (2019-2024) witnessed a steady growth of approximately 8% CAGR, laying the groundwork for the accelerated expansion anticipated in the coming years. The transition to EVs is not merely a technological evolution but a consumer-driven revolution, demanding fluids that can handle higher operating temperatures, manage electrical loads, and ensure the longevity of complex powertrain components. The demand for synthetic hydrocarbon base oil types is expected to remain strong due to their cost-effectiveness and established performance, while synthetic ester base oils types will gain traction for their superior thermal stability and biodegradability. The market size for EV lubricants is projected to reach $15 billion globally by 2030.
Dominant Regions, Countries, or Segments in Transmission Ev Fluids
The North America region is emerging as a dominant force in the Transmission EV Fluids market, driven by aggressive government incentives, substantial investments in EV manufacturing infrastructure, and a rapidly expanding consumer base for electric vehicles. Within North America, the United States stands out as a key growth engine, propelled by a combination of supportive federal and state policies, the presence of major automotive manufacturers heavily investing in EV production, and a growing consumer demand for sustainable transportation solutions. The Automobile Manufacturer segment is the primary driver of demand in this region, accounting for an estimated 65% of the market share in 2025. This dominance is attributed to the direct integration of EV transmission fluids into vehicle design and manufacturing processes, where OEM specifications dictate the precise fluid requirements for optimal performance and warranty compliance. The increasing number of electric vehicle models being introduced by major automotive players, coupled with ambitious production targets, directly fuels the demand for synthetic hydrocarbon base oil types and synthetic ester base oils types in large volumes. Furthermore, the robust aftermarket for Automobile Repair Shops is also experiencing significant growth, as EV fleets expand and specialized maintenance services become more prevalent. The economic policies promoting EV adoption, such as tax credits and charging infrastructure development, are critical factors contributing to this regional dominance. The market share of the Automobile Manufacturer segment in the U.S. is expected to grow at a CAGR of 15% from 2025 to 2033.
- Leading Region: North America
- Key Country: United States
- Dominant Segment (Application): Automobile Manufacturer
- Key Drivers in the U.S.:
- Government incentives and subsidies for EV adoption.
- Significant investments in EV manufacturing and R&D.
- Strong consumer demand for electric vehicles.
- Expanding charging infrastructure.
- Stringent emission regulations.
- Market Share (Automobile Manufacturer Segment, 2025): Estimated 65%
- Growth Potential: High, driven by increasing EV production and technological advancements.
Transmission Ev Fluids Product Landscape
The Transmission EV Fluids product landscape is characterized by continuous innovation focused on delivering superior thermal management, enhanced lubrication, and critical electrical insulation properties. Manufacturers are developing advanced formulations that not only lubricate gears and bearings within EV drivetrains but also efficiently dissipate heat generated by electric motors and power electronics. Unique selling propositions often revolve around extended fluid life, improved energy efficiency, and compatibility with a wider range of EV component materials. Technological advancements include the incorporation of novel additive packages that offer superior wear protection and corrosion resistance, as well as specialized dielectric properties to prevent electrical arcing within the transmission. The development of bio-based and sustainable EV fluids is also gaining traction, aligning with the eco-conscious ethos of the EV market.
Key Drivers, Barriers & Challenges in Transmission Ev Fluids
The Transmission EV Fluids market is propelled by several key drivers, most notably the surging global demand for electric vehicles, driven by environmental concerns and favorable government regulations. Technological advancements in EV powertrains, requiring specialized fluids for optimal performance and efficiency, are also significant catalysts. The increasing focus on sustainability and the development of eco-friendly lubricant solutions further contribute to market growth.
However, the market faces several barriers and challenges. The high cost of specialized EV fluids compared to conventional lubricants can be a restraint. The evolving nature of EV technology means that fluid specifications are constantly changing, requiring continuous R&D investment. Supply chain complexities and the need for specialized manufacturing capabilities can also pose challenges. Furthermore, the limited awareness among some aftermarket service providers regarding the unique requirements of EV fluids presents a hurdle to wider adoption.
- Key Drivers:
- Exponential growth in EV adoption.
- Technological advancements in EV powertrains.
- Supportive government policies and incentives.
- Growing environmental awareness.
- Key Challenges:
- High cost of specialized EV fluids.
- Rapidly evolving EV technology and fluid specifications.
- Supply chain complexities and raw material availability.
- Need for specialized technical expertise in the aftermarket.
Emerging Opportunities in Transmission Ev Fluids
Emerging opportunities in the Transmission EV Fluids market lie in the development of advanced, multi-functional fluids that can perform an array of tasks, including thermal management of batteries and power electronics, in addition to lubrication. The untapped potential of emerging markets in Asia and South America, with their rapidly growing EV adoption rates, presents significant expansion avenues. Furthermore, the increasing demand for biodegradable and sustainable EV fluids offers a niche for environmentally conscious product development. The integration of smart fluid technologies that can monitor their own performance and degradation levels presents another avenue for innovation and value creation.
Growth Accelerators in the Transmission Ev Fluids Industry
The Transmission EV Fluids industry is experiencing significant growth acceleration driven by several pivotal factors. Breakthroughs in material science are enabling the development of fluids with unprecedented thermal conductivity and electrical insulation capabilities, crucial for the high-voltage systems in modern EVs. Strategic partnerships between lubricant manufacturers and automotive OEMs are accelerating product development and market penetration, ensuring that fluids are precisely engineered for specific vehicle platforms. Furthermore, market expansion strategies focused on developing specialized fluids for different EV segments, such as performance EVs, commercial EVs, and autonomous vehicles, are unlocking new revenue streams and driving broader industry growth. The increasing global focus on circular economy principles is also spurring innovation in fluid recycling and re-manufacturing technologies.
Key Players Shaping the Transmission Ev Fluids Market
- ENEOS
- TotalEnergies
- Shell
- Castrol (BP)
- Changcheng Lube (CNPC)
- Repsol
- Valvoline
- Cargill
- Chevron
- Croda
- ExxonMobil
- FUCHS
- Liqui Moly (Würth Group)
- Suncor
- Gulf Western (Hinduja Group)
- Amsoil
- Klueber Lubrication (Freudenberg Group)
Notable Milestones in Transmission Ev Fluids Sector
- 2019: Introduction of first-generation EV transmission fluids by major OEMs, focusing on basic lubrication and thermal management.
- 2020: Increased R&D investment in advanced additive technologies for enhanced electrical insulation.
- 2021: Launch of specialized EV fluids for high-performance electric vehicles with extreme temperature requirements.
- 2022: Significant mergers and acquisitions as larger lubricant companies aim to establish a strong foothold in the EV fluids market.
- 2023: Development of eco-friendly and biodegradable EV transmission fluids gaining traction.
- 2024: Growing demand for integrated thermal management fluids for e-axles and battery systems.
In-Depth Transmission Ev Fluids Market Outlook
The future outlook for the Transmission EV Fluids market is exceptionally promising, with sustained growth driven by the unwavering global transition to electric mobility. Key growth accelerators include ongoing technological advancements in e-powertrain efficiency and thermal management, coupled with increasing regulatory mandates for zero-emission vehicles. Strategic collaborations between lubricant formulators and automotive manufacturers will continue to be critical for developing bespoke fluid solutions. Furthermore, the expansion into underserved geographical markets and the growing consumer preference for sustainable products will unlock significant untapped potential. The market is expected to witness continuous innovation, with a focus on intelligent fluids that offer predictive maintenance capabilities and enhanced performance across diverse operating conditions.
Transmission Ev Fluids Segmentation
-
1. Application
- 1.1. Automobile Manufacturer
- 1.2. Automobile Repair Shop
- 1.3. Others
-
2. Type
- 2.1. Synthetic Hydrocarbon Base Oil Types
- 2.2. Synthetic Ester Base Oils Types
- 2.3. Others
Transmission Ev Fluids Segmentation By Geography
-
1. North America
- 1.1. United States
- 1.2. Canada
- 1.3. Mexico
-
2. South America
- 2.1. Brazil
- 2.2. Argentina
- 2.3. Rest of South America
-
3. Europe
- 3.1. United Kingdom
- 3.2. Germany
- 3.3. France
- 3.4. Italy
- 3.5. Spain
- 3.6. Russia
- 3.7. Benelux
- 3.8. Nordics
- 3.9. Rest of Europe
-
4. Middle East & Africa
- 4.1. Turkey
- 4.2. Israel
- 4.3. GCC
- 4.4. North Africa
- 4.5. South Africa
- 4.6. Rest of Middle East & Africa
-
5. Asia Pacific
- 5.1. China
- 5.2. India
- 5.3. Japan
- 5.4. South Korea
- 5.5. ASEAN
- 5.6. Oceania
- 5.7. Rest of Asia Pacific
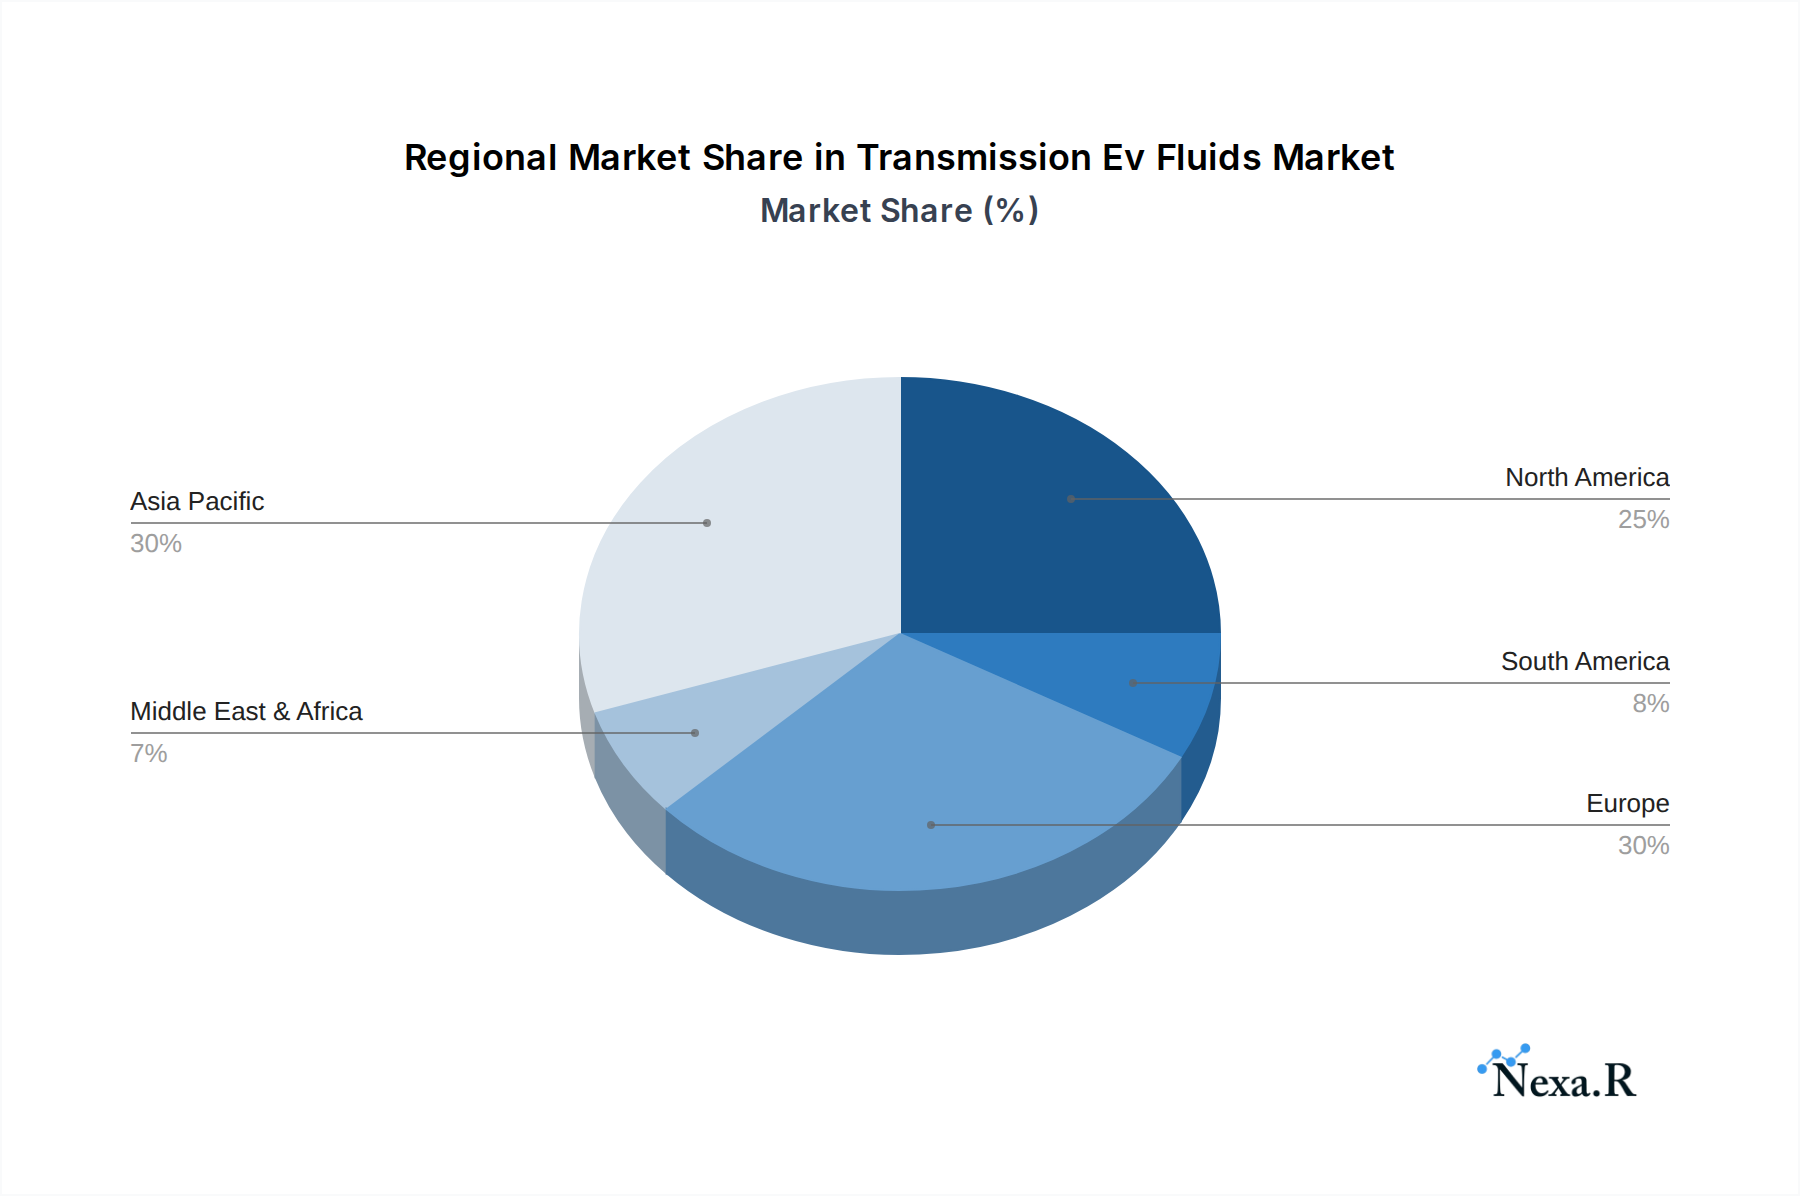
Transmission Ev Fluids Regional Market Share
Geographic Coverage of Transmission Ev Fluids
Transmission Ev Fluids REPORT HIGHLIGHTS
| Aspects | Details |
|---|---|
| Study Period | 2020-2034 |
| Base Year | 2025 |
| Estimated Year | 2026 |
| Forecast Period | 2026-2034 |
| Historical Period | 2020-2025 |
| Growth Rate | CAGR of 23.56% from 2020-2034 |
| Segmentation |
|
Table of Contents
- 1. Introduction
- 1.1. Research Scope
- 1.2. Market Segmentation
- 1.3. Research Methodology
- 1.4. Definitions and Assumptions
- 2. Executive Summary
- 2.1. Introduction
- 3. Market Dynamics
- 3.1. Introduction
- 3.2. Market Drivers
- 3.3. Market Restrains
- 3.4. Market Trends
- 4. Market Factor Analysis
- 4.1. Porters Five Forces
- 4.2. Supply/Value Chain
- 4.3. PESTEL analysis
- 4.4. Market Entropy
- 4.5. Patent/Trademark Analysis
- 5. Global Transmission Ev Fluids Analysis, Insights and Forecast, 2020-2032
- 5.1. Market Analysis, Insights and Forecast - by Application
- 5.1.1. Automobile Manufacturer
- 5.1.2. Automobile Repair Shop
- 5.1.3. Others
- 5.2. Market Analysis, Insights and Forecast - by Type
- 5.2.1. Synthetic Hydrocarbon Base Oil Types
- 5.2.2. Synthetic Ester Base Oils Types
- 5.2.3. Others
- 5.3. Market Analysis, Insights and Forecast - by Region
- 5.3.1. North America
- 5.3.2. South America
- 5.3.3. Europe
- 5.3.4. Middle East & Africa
- 5.3.5. Asia Pacific
- 5.1. Market Analysis, Insights and Forecast - by Application
- 6. North America Transmission Ev Fluids Analysis, Insights and Forecast, 2020-2032
- 6.1. Market Analysis, Insights and Forecast - by Application
- 6.1.1. Automobile Manufacturer
- 6.1.2. Automobile Repair Shop
- 6.1.3. Others
- 6.2. Market Analysis, Insights and Forecast - by Type
- 6.2.1. Synthetic Hydrocarbon Base Oil Types
- 6.2.2. Synthetic Ester Base Oils Types
- 6.2.3. Others
- 6.1. Market Analysis, Insights and Forecast - by Application
- 7. South America Transmission Ev Fluids Analysis, Insights and Forecast, 2020-2032
- 7.1. Market Analysis, Insights and Forecast - by Application
- 7.1.1. Automobile Manufacturer
- 7.1.2. Automobile Repair Shop
- 7.1.3. Others
- 7.2. Market Analysis, Insights and Forecast - by Type
- 7.2.1. Synthetic Hydrocarbon Base Oil Types
- 7.2.2. Synthetic Ester Base Oils Types
- 7.2.3. Others
- 7.1. Market Analysis, Insights and Forecast - by Application
- 8. Europe Transmission Ev Fluids Analysis, Insights and Forecast, 2020-2032
- 8.1. Market Analysis, Insights and Forecast - by Application
- 8.1.1. Automobile Manufacturer
- 8.1.2. Automobile Repair Shop
- 8.1.3. Others
- 8.2. Market Analysis, Insights and Forecast - by Type
- 8.2.1. Synthetic Hydrocarbon Base Oil Types
- 8.2.2. Synthetic Ester Base Oils Types
- 8.2.3. Others
- 8.1. Market Analysis, Insights and Forecast - by Application
- 9. Middle East & Africa Transmission Ev Fluids Analysis, Insights and Forecast, 2020-2032
- 9.1. Market Analysis, Insights and Forecast - by Application
- 9.1.1. Automobile Manufacturer
- 9.1.2. Automobile Repair Shop
- 9.1.3. Others
- 9.2. Market Analysis, Insights and Forecast - by Type
- 9.2.1. Synthetic Hydrocarbon Base Oil Types
- 9.2.2. Synthetic Ester Base Oils Types
- 9.2.3. Others
- 9.1. Market Analysis, Insights and Forecast - by Application
- 10. Asia Pacific Transmission Ev Fluids Analysis, Insights and Forecast, 2020-2032
- 10.1. Market Analysis, Insights and Forecast - by Application
- 10.1.1. Automobile Manufacturer
- 10.1.2. Automobile Repair Shop
- 10.1.3. Others
- 10.2. Market Analysis, Insights and Forecast - by Type
- 10.2.1. Synthetic Hydrocarbon Base Oil Types
- 10.2.2. Synthetic Ester Base Oils Types
- 10.2.3. Others
- 10.1. Market Analysis, Insights and Forecast - by Application
- 11. Competitive Analysis
- 11.1. Global Market Share Analysis 2025
- 11.2. Company Profiles
- 11.2.1 ENEOS
- 11.2.1.1. Overview
- 11.2.1.2. Products
- 11.2.1.3. SWOT Analysis
- 11.2.1.4. Recent Developments
- 11.2.1.5. Financials (Based on Availability)
- 11.2.2 TotalEnergies
- 11.2.2.1. Overview
- 11.2.2.2. Products
- 11.2.2.3. SWOT Analysis
- 11.2.2.4. Recent Developments
- 11.2.2.5. Financials (Based on Availability)
- 11.2.3 Shell
- 11.2.3.1. Overview
- 11.2.3.2. Products
- 11.2.3.3. SWOT Analysis
- 11.2.3.4. Recent Developments
- 11.2.3.5. Financials (Based on Availability)
- 11.2.4 Castrol (BP)
- 11.2.4.1. Overview
- 11.2.4.2. Products
- 11.2.4.3. SWOT Analysis
- 11.2.4.4. Recent Developments
- 11.2.4.5. Financials (Based on Availability)
- 11.2.5 Changcheng Lube (CNPC)
- 11.2.5.1. Overview
- 11.2.5.2. Products
- 11.2.5.3. SWOT Analysis
- 11.2.5.4. Recent Developments
- 11.2.5.5. Financials (Based on Availability)
- 11.2.6 Repsol
- 11.2.6.1. Overview
- 11.2.6.2. Products
- 11.2.6.3. SWOT Analysis
- 11.2.6.4. Recent Developments
- 11.2.6.5. Financials (Based on Availability)
- 11.2.7 Valvoline
- 11.2.7.1. Overview
- 11.2.7.2. Products
- 11.2.7.3. SWOT Analysis
- 11.2.7.4. Recent Developments
- 11.2.7.5. Financials (Based on Availability)
- 11.2.8 Cargill
- 11.2.8.1. Overview
- 11.2.8.2. Products
- 11.2.8.3. SWOT Analysis
- 11.2.8.4. Recent Developments
- 11.2.8.5. Financials (Based on Availability)
- 11.2.9 Chevron
- 11.2.9.1. Overview
- 11.2.9.2. Products
- 11.2.9.3. SWOT Analysis
- 11.2.9.4. Recent Developments
- 11.2.9.5. Financials (Based on Availability)
- 11.2.10 Croda
- 11.2.10.1. Overview
- 11.2.10.2. Products
- 11.2.10.3. SWOT Analysis
- 11.2.10.4. Recent Developments
- 11.2.10.5. Financials (Based on Availability)
- 11.2.11 ExxonMobil
- 11.2.11.1. Overview
- 11.2.11.2. Products
- 11.2.11.3. SWOT Analysis
- 11.2.11.4. Recent Developments
- 11.2.11.5. Financials (Based on Availability)
- 11.2.12 FUCHS
- 11.2.12.1. Overview
- 11.2.12.2. Products
- 11.2.12.3. SWOT Analysis
- 11.2.12.4. Recent Developments
- 11.2.12.5. Financials (Based on Availability)
- 11.2.13 Liqui Moly (Würth Group)
- 11.2.13.1. Overview
- 11.2.13.2. Products
- 11.2.13.3. SWOT Analysis
- 11.2.13.4. Recent Developments
- 11.2.13.5. Financials (Based on Availability)
- 11.2.14 Suncor
- 11.2.14.1. Overview
- 11.2.14.2. Products
- 11.2.14.3. SWOT Analysis
- 11.2.14.4. Recent Developments
- 11.2.14.5. Financials (Based on Availability)
- 11.2.15 Gulf Western (Hinduja Group)
- 11.2.15.1. Overview
- 11.2.15.2. Products
- 11.2.15.3. SWOT Analysis
- 11.2.15.4. Recent Developments
- 11.2.15.5. Financials (Based on Availability)
- 11.2.16 Amsoil
- 11.2.16.1. Overview
- 11.2.16.2. Products
- 11.2.16.3. SWOT Analysis
- 11.2.16.4. Recent Developments
- 11.2.16.5. Financials (Based on Availability)
- 11.2.17 Klueber Lubrication (Freudenberg Group)
- 11.2.17.1. Overview
- 11.2.17.2. Products
- 11.2.17.3. SWOT Analysis
- 11.2.17.4. Recent Developments
- 11.2.17.5. Financials (Based on Availability)
- 11.2.1 ENEOS
List of Figures
- Figure 1: Global Transmission Ev Fluids Revenue Breakdown (undefined, %) by Region 2025 & 2033
- Figure 2: Global Transmission Ev Fluids Volume Breakdown (K, %) by Region 2025 & 2033
- Figure 3: North America Transmission Ev Fluids Revenue (undefined), by Application 2025 & 2033
- Figure 4: North America Transmission Ev Fluids Volume (K), by Application 2025 & 2033
- Figure 5: North America Transmission Ev Fluids Revenue Share (%), by Application 2025 & 2033
- Figure 6: North America Transmission Ev Fluids Volume Share (%), by Application 2025 & 2033
- Figure 7: North America Transmission Ev Fluids Revenue (undefined), by Type 2025 & 2033
- Figure 8: North America Transmission Ev Fluids Volume (K), by Type 2025 & 2033
- Figure 9: North America Transmission Ev Fluids Revenue Share (%), by Type 2025 & 2033
- Figure 10: North America Transmission Ev Fluids Volume Share (%), by Type 2025 & 2033
- Figure 11: North America Transmission Ev Fluids Revenue (undefined), by Country 2025 & 2033
- Figure 12: North America Transmission Ev Fluids Volume (K), by Country 2025 & 2033
- Figure 13: North America Transmission Ev Fluids Revenue Share (%), by Country 2025 & 2033
- Figure 14: North America Transmission Ev Fluids Volume Share (%), by Country 2025 & 2033
- Figure 15: South America Transmission Ev Fluids Revenue (undefined), by Application 2025 & 2033
- Figure 16: South America Transmission Ev Fluids Volume (K), by Application 2025 & 2033
- Figure 17: South America Transmission Ev Fluids Revenue Share (%), by Application 2025 & 2033
- Figure 18: South America Transmission Ev Fluids Volume Share (%), by Application 2025 & 2033
- Figure 19: South America Transmission Ev Fluids Revenue (undefined), by Type 2025 & 2033
- Figure 20: South America Transmission Ev Fluids Volume (K), by Type 2025 & 2033
- Figure 21: South America Transmission Ev Fluids Revenue Share (%), by Type 2025 & 2033
- Figure 22: South America Transmission Ev Fluids Volume Share (%), by Type 2025 & 2033
- Figure 23: South America Transmission Ev Fluids Revenue (undefined), by Country 2025 & 2033
- Figure 24: South America Transmission Ev Fluids Volume (K), by Country 2025 & 2033
- Figure 25: South America Transmission Ev Fluids Revenue Share (%), by Country 2025 & 2033
- Figure 26: South America Transmission Ev Fluids Volume Share (%), by Country 2025 & 2033
- Figure 27: Europe Transmission Ev Fluids Revenue (undefined), by Application 2025 & 2033
- Figure 28: Europe Transmission Ev Fluids Volume (K), by Application 2025 & 2033
- Figure 29: Europe Transmission Ev Fluids Revenue Share (%), by Application 2025 & 2033
- Figure 30: Europe Transmission Ev Fluids Volume Share (%), by Application 2025 & 2033
- Figure 31: Europe Transmission Ev Fluids Revenue (undefined), by Type 2025 & 2033
- Figure 32: Europe Transmission Ev Fluids Volume (K), by Type 2025 & 2033
- Figure 33: Europe Transmission Ev Fluids Revenue Share (%), by Type 2025 & 2033
- Figure 34: Europe Transmission Ev Fluids Volume Share (%), by Type 2025 & 2033
- Figure 35: Europe Transmission Ev Fluids Revenue (undefined), by Country 2025 & 2033
- Figure 36: Europe Transmission Ev Fluids Volume (K), by Country 2025 & 2033
- Figure 37: Europe Transmission Ev Fluids Revenue Share (%), by Country 2025 & 2033
- Figure 38: Europe Transmission Ev Fluids Volume Share (%), by Country 2025 & 2033
- Figure 39: Middle East & Africa Transmission Ev Fluids Revenue (undefined), by Application 2025 & 2033
- Figure 40: Middle East & Africa Transmission Ev Fluids Volume (K), by Application 2025 & 2033
- Figure 41: Middle East & Africa Transmission Ev Fluids Revenue Share (%), by Application 2025 & 2033
- Figure 42: Middle East & Africa Transmission Ev Fluids Volume Share (%), by Application 2025 & 2033
- Figure 43: Middle East & Africa Transmission Ev Fluids Revenue (undefined), by Type 2025 & 2033
- Figure 44: Middle East & Africa Transmission Ev Fluids Volume (K), by Type 2025 & 2033
- Figure 45: Middle East & Africa Transmission Ev Fluids Revenue Share (%), by Type 2025 & 2033
- Figure 46: Middle East & Africa Transmission Ev Fluids Volume Share (%), by Type 2025 & 2033
- Figure 47: Middle East & Africa Transmission Ev Fluids Revenue (undefined), by Country 2025 & 2033
- Figure 48: Middle East & Africa Transmission Ev Fluids Volume (K), by Country 2025 & 2033
- Figure 49: Middle East & Africa Transmission Ev Fluids Revenue Share (%), by Country 2025 & 2033
- Figure 50: Middle East & Africa Transmission Ev Fluids Volume Share (%), by Country 2025 & 2033
- Figure 51: Asia Pacific Transmission Ev Fluids Revenue (undefined), by Application 2025 & 2033
- Figure 52: Asia Pacific Transmission Ev Fluids Volume (K), by Application 2025 & 2033
- Figure 53: Asia Pacific Transmission Ev Fluids Revenue Share (%), by Application 2025 & 2033
- Figure 54: Asia Pacific Transmission Ev Fluids Volume Share (%), by Application 2025 & 2033
- Figure 55: Asia Pacific Transmission Ev Fluids Revenue (undefined), by Type 2025 & 2033
- Figure 56: Asia Pacific Transmission Ev Fluids Volume (K), by Type 2025 & 2033
- Figure 57: Asia Pacific Transmission Ev Fluids Revenue Share (%), by Type 2025 & 2033
- Figure 58: Asia Pacific Transmission Ev Fluids Volume Share (%), by Type 2025 & 2033
- Figure 59: Asia Pacific Transmission Ev Fluids Revenue (undefined), by Country 2025 & 2033
- Figure 60: Asia Pacific Transmission Ev Fluids Volume (K), by Country 2025 & 2033
- Figure 61: Asia Pacific Transmission Ev Fluids Revenue Share (%), by Country 2025 & 2033
- Figure 62: Asia Pacific Transmission Ev Fluids Volume Share (%), by Country 2025 & 2033
List of Tables
- Table 1: Global Transmission Ev Fluids Revenue undefined Forecast, by Application 2020 & 2033
- Table 2: Global Transmission Ev Fluids Volume K Forecast, by Application 2020 & 2033
- Table 3: Global Transmission Ev Fluids Revenue undefined Forecast, by Type 2020 & 2033
- Table 4: Global Transmission Ev Fluids Volume K Forecast, by Type 2020 & 2033
- Table 5: Global Transmission Ev Fluids Revenue undefined Forecast, by Region 2020 & 2033
- Table 6: Global Transmission Ev Fluids Volume K Forecast, by Region 2020 & 2033
- Table 7: Global Transmission Ev Fluids Revenue undefined Forecast, by Application 2020 & 2033
- Table 8: Global Transmission Ev Fluids Volume K Forecast, by Application 2020 & 2033
- Table 9: Global Transmission Ev Fluids Revenue undefined Forecast, by Type 2020 & 2033
- Table 10: Global Transmission Ev Fluids Volume K Forecast, by Type 2020 & 2033
- Table 11: Global Transmission Ev Fluids Revenue undefined Forecast, by Country 2020 & 2033
- Table 12: Global Transmission Ev Fluids Volume K Forecast, by Country 2020 & 2033
- Table 13: United States Transmission Ev Fluids Revenue (undefined) Forecast, by Application 2020 & 2033
- Table 14: United States Transmission Ev Fluids Volume (K) Forecast, by Application 2020 & 2033
- Table 15: Canada Transmission Ev Fluids Revenue (undefined) Forecast, by Application 2020 & 2033
- Table 16: Canada Transmission Ev Fluids Volume (K) Forecast, by Application 2020 & 2033
- Table 17: Mexico Transmission Ev Fluids Revenue (undefined) Forecast, by Application 2020 & 2033
- Table 18: Mexico Transmission Ev Fluids Volume (K) Forecast, by Application 2020 & 2033
- Table 19: Global Transmission Ev Fluids Revenue undefined Forecast, by Application 2020 & 2033
- Table 20: Global Transmission Ev Fluids Volume K Forecast, by Application 2020 & 2033
- Table 21: Global Transmission Ev Fluids Revenue undefined Forecast, by Type 2020 & 2033
- Table 22: Global Transmission Ev Fluids Volume K Forecast, by Type 2020 & 2033
- Table 23: Global Transmission Ev Fluids Revenue undefined Forecast, by Country 2020 & 2033
- Table 24: Global Transmission Ev Fluids Volume K Forecast, by Country 2020 & 2033
- Table 25: Brazil Transmission Ev Fluids Revenue (undefined) Forecast, by Application 2020 & 2033
- Table 26: Brazil Transmission Ev Fluids Volume (K) Forecast, by Application 2020 & 2033
- Table 27: Argentina Transmission Ev Fluids Revenue (undefined) Forecast, by Application 2020 & 2033
- Table 28: Argentina Transmission Ev Fluids Volume (K) Forecast, by Application 2020 & 2033
- Table 29: Rest of South America Transmission Ev Fluids Revenue (undefined) Forecast, by Application 2020 & 2033
- Table 30: Rest of South America Transmission Ev Fluids Volume (K) Forecast, by Application 2020 & 2033
- Table 31: Global Transmission Ev Fluids Revenue undefined Forecast, by Application 2020 & 2033
- Table 32: Global Transmission Ev Fluids Volume K Forecast, by Application 2020 & 2033
- Table 33: Global Transmission Ev Fluids Revenue undefined Forecast, by Type 2020 & 2033
- Table 34: Global Transmission Ev Fluids Volume K Forecast, by Type 2020 & 2033
- Table 35: Global Transmission Ev Fluids Revenue undefined Forecast, by Country 2020 & 2033
- Table 36: Global Transmission Ev Fluids Volume K Forecast, by Country 2020 & 2033
- Table 37: United Kingdom Transmission Ev Fluids Revenue (undefined) Forecast, by Application 2020 & 2033
- Table 38: United Kingdom Transmission Ev Fluids Volume (K) Forecast, by Application 2020 & 2033
- Table 39: Germany Transmission Ev Fluids Revenue (undefined) Forecast, by Application 2020 & 2033
- Table 40: Germany Transmission Ev Fluids Volume (K) Forecast, by Application 2020 & 2033
- Table 41: France Transmission Ev Fluids Revenue (undefined) Forecast, by Application 2020 & 2033
- Table 42: France Transmission Ev Fluids Volume (K) Forecast, by Application 2020 & 2033
- Table 43: Italy Transmission Ev Fluids Revenue (undefined) Forecast, by Application 2020 & 2033
- Table 44: Italy Transmission Ev Fluids Volume (K) Forecast, by Application 2020 & 2033
- Table 45: Spain Transmission Ev Fluids Revenue (undefined) Forecast, by Application 2020 & 2033
- Table 46: Spain Transmission Ev Fluids Volume (K) Forecast, by Application 2020 & 2033
- Table 47: Russia Transmission Ev Fluids Revenue (undefined) Forecast, by Application 2020 & 2033
- Table 48: Russia Transmission Ev Fluids Volume (K) Forecast, by Application 2020 & 2033
- Table 49: Benelux Transmission Ev Fluids Revenue (undefined) Forecast, by Application 2020 & 2033
- Table 50: Benelux Transmission Ev Fluids Volume (K) Forecast, by Application 2020 & 2033
- Table 51: Nordics Transmission Ev Fluids Revenue (undefined) Forecast, by Application 2020 & 2033
- Table 52: Nordics Transmission Ev Fluids Volume (K) Forecast, by Application 2020 & 2033
- Table 53: Rest of Europe Transmission Ev Fluids Revenue (undefined) Forecast, by Application 2020 & 2033
- Table 54: Rest of Europe Transmission Ev Fluids Volume (K) Forecast, by Application 2020 & 2033
- Table 55: Global Transmission Ev Fluids Revenue undefined Forecast, by Application 2020 & 2033
- Table 56: Global Transmission Ev Fluids Volume K Forecast, by Application 2020 & 2033
- Table 57: Global Transmission Ev Fluids Revenue undefined Forecast, by Type 2020 & 2033
- Table 58: Global Transmission Ev Fluids Volume K Forecast, by Type 2020 & 2033
- Table 59: Global Transmission Ev Fluids Revenue undefined Forecast, by Country 2020 & 2033
- Table 60: Global Transmission Ev Fluids Volume K Forecast, by Country 2020 & 2033
- Table 61: Turkey Transmission Ev Fluids Revenue (undefined) Forecast, by Application 2020 & 2033
- Table 62: Turkey Transmission Ev Fluids Volume (K) Forecast, by Application 2020 & 2033
- Table 63: Israel Transmission Ev Fluids Revenue (undefined) Forecast, by Application 2020 & 2033
- Table 64: Israel Transmission Ev Fluids Volume (K) Forecast, by Application 2020 & 2033
- Table 65: GCC Transmission Ev Fluids Revenue (undefined) Forecast, by Application 2020 & 2033
- Table 66: GCC Transmission Ev Fluids Volume (K) Forecast, by Application 2020 & 2033
- Table 67: North Africa Transmission Ev Fluids Revenue (undefined) Forecast, by Application 2020 & 2033
- Table 68: North Africa Transmission Ev Fluids Volume (K) Forecast, by Application 2020 & 2033
- Table 69: South Africa Transmission Ev Fluids Revenue (undefined) Forecast, by Application 2020 & 2033
- Table 70: South Africa Transmission Ev Fluids Volume (K) Forecast, by Application 2020 & 2033
- Table 71: Rest of Middle East & Africa Transmission Ev Fluids Revenue (undefined) Forecast, by Application 2020 & 2033
- Table 72: Rest of Middle East & Africa Transmission Ev Fluids Volume (K) Forecast, by Application 2020 & 2033
- Table 73: Global Transmission Ev Fluids Revenue undefined Forecast, by Application 2020 & 2033
- Table 74: Global Transmission Ev Fluids Volume K Forecast, by Application 2020 & 2033
- Table 75: Global Transmission Ev Fluids Revenue undefined Forecast, by Type 2020 & 2033
- Table 76: Global Transmission Ev Fluids Volume K Forecast, by Type 2020 & 2033
- Table 77: Global Transmission Ev Fluids Revenue undefined Forecast, by Country 2020 & 2033
- Table 78: Global Transmission Ev Fluids Volume K Forecast, by Country 2020 & 2033
- Table 79: China Transmission Ev Fluids Revenue (undefined) Forecast, by Application 2020 & 2033
- Table 80: China Transmission Ev Fluids Volume (K) Forecast, by Application 2020 & 2033
- Table 81: India Transmission Ev Fluids Revenue (undefined) Forecast, by Application 2020 & 2033
- Table 82: India Transmission Ev Fluids Volume (K) Forecast, by Application 2020 & 2033
- Table 83: Japan Transmission Ev Fluids Revenue (undefined) Forecast, by Application 2020 & 2033
- Table 84: Japan Transmission Ev Fluids Volume (K) Forecast, by Application 2020 & 2033
- Table 85: South Korea Transmission Ev Fluids Revenue (undefined) Forecast, by Application 2020 & 2033
- Table 86: South Korea Transmission Ev Fluids Volume (K) Forecast, by Application 2020 & 2033
- Table 87: ASEAN Transmission Ev Fluids Revenue (undefined) Forecast, by Application 2020 & 2033
- Table 88: ASEAN Transmission Ev Fluids Volume (K) Forecast, by Application 2020 & 2033
- Table 89: Oceania Transmission Ev Fluids Revenue (undefined) Forecast, by Application 2020 & 2033
- Table 90: Oceania Transmission Ev Fluids Volume (K) Forecast, by Application 2020 & 2033
- Table 91: Rest of Asia Pacific Transmission Ev Fluids Revenue (undefined) Forecast, by Application 2020 & 2033
- Table 92: Rest of Asia Pacific Transmission Ev Fluids Volume (K) Forecast, by Application 2020 & 2033
Frequently Asked Questions
1. What is the projected Compound Annual Growth Rate (CAGR) of the Transmission Ev Fluids?
The projected CAGR is approximately 23.56%.
2. Which companies are prominent players in the Transmission Ev Fluids?
Key companies in the market include ENEOS, TotalEnergies, Shell, Castrol (BP), Changcheng Lube (CNPC), Repsol, Valvoline, Cargill, Chevron, Croda, ExxonMobil, FUCHS, Liqui Moly (Würth Group), Suncor, Gulf Western (Hinduja Group), Amsoil, Klueber Lubrication (Freudenberg Group).
3. What are the main segments of the Transmission Ev Fluids?
The market segments include Application, Type.
4. Can you provide details about the market size?
The market size is estimated to be USD XXX N/A as of 2022.
5. What are some drivers contributing to market growth?
N/A
6. What are the notable trends driving market growth?
N/A
7. Are there any restraints impacting market growth?
N/A
8. Can you provide examples of recent developments in the market?
N/A
9. What pricing options are available for accessing the report?
Pricing options include single-user, multi-user, and enterprise licenses priced at USD 3950.00, USD 5925.00, and USD 7900.00 respectively.
10. Is the market size provided in terms of value or volume?
The market size is provided in terms of value, measured in N/A and volume, measured in K.
11. Are there any specific market keywords associated with the report?
Yes, the market keyword associated with the report is "Transmission Ev Fluids," which aids in identifying and referencing the specific market segment covered.
12. How do I determine which pricing option suits my needs best?
The pricing options vary based on user requirements and access needs. Individual users may opt for single-user licenses, while businesses requiring broader access may choose multi-user or enterprise licenses for cost-effective access to the report.
13. Are there any additional resources or data provided in the Transmission Ev Fluids report?
While the report offers comprehensive insights, it's advisable to review the specific contents or supplementary materials provided to ascertain if additional resources or data are available.
14. How can I stay updated on further developments or reports in the Transmission Ev Fluids?
To stay informed about further developments, trends, and reports in the Transmission Ev Fluids, consider subscribing to industry newsletters, following relevant companies and organizations, or regularly checking reputable industry news sources and publications.
Methodology
Step 1 - Identification of Relevant Samples Size from Population Database


Step 2 - Approaches for Defining Global Market Size (Value, Volume* & Price*)

Note*: In applicable scenarios
Step 3 - Data Sources
Primary Research
- Web Analytics
- Survey Reports
- Research Institute
- Latest Research Reports
- Opinion Leaders
Secondary Research
- Annual Reports
- White Paper
- Latest Press Release
- Industry Association
- Paid Database
- Investor Presentations

Step 4 - Data Triangulation
Involves using different sources of information in order to increase the validity of a study
These sources are likely to be stakeholders in a program - participants, other researchers, program staff, other community members, and so on.
Then we put all data in single framework & apply various statistical tools to find out the dynamic on the market.
During the analysis stage, feedback from the stakeholder groups would be compared to determine areas of agreement as well as areas of divergence