

Key Insights
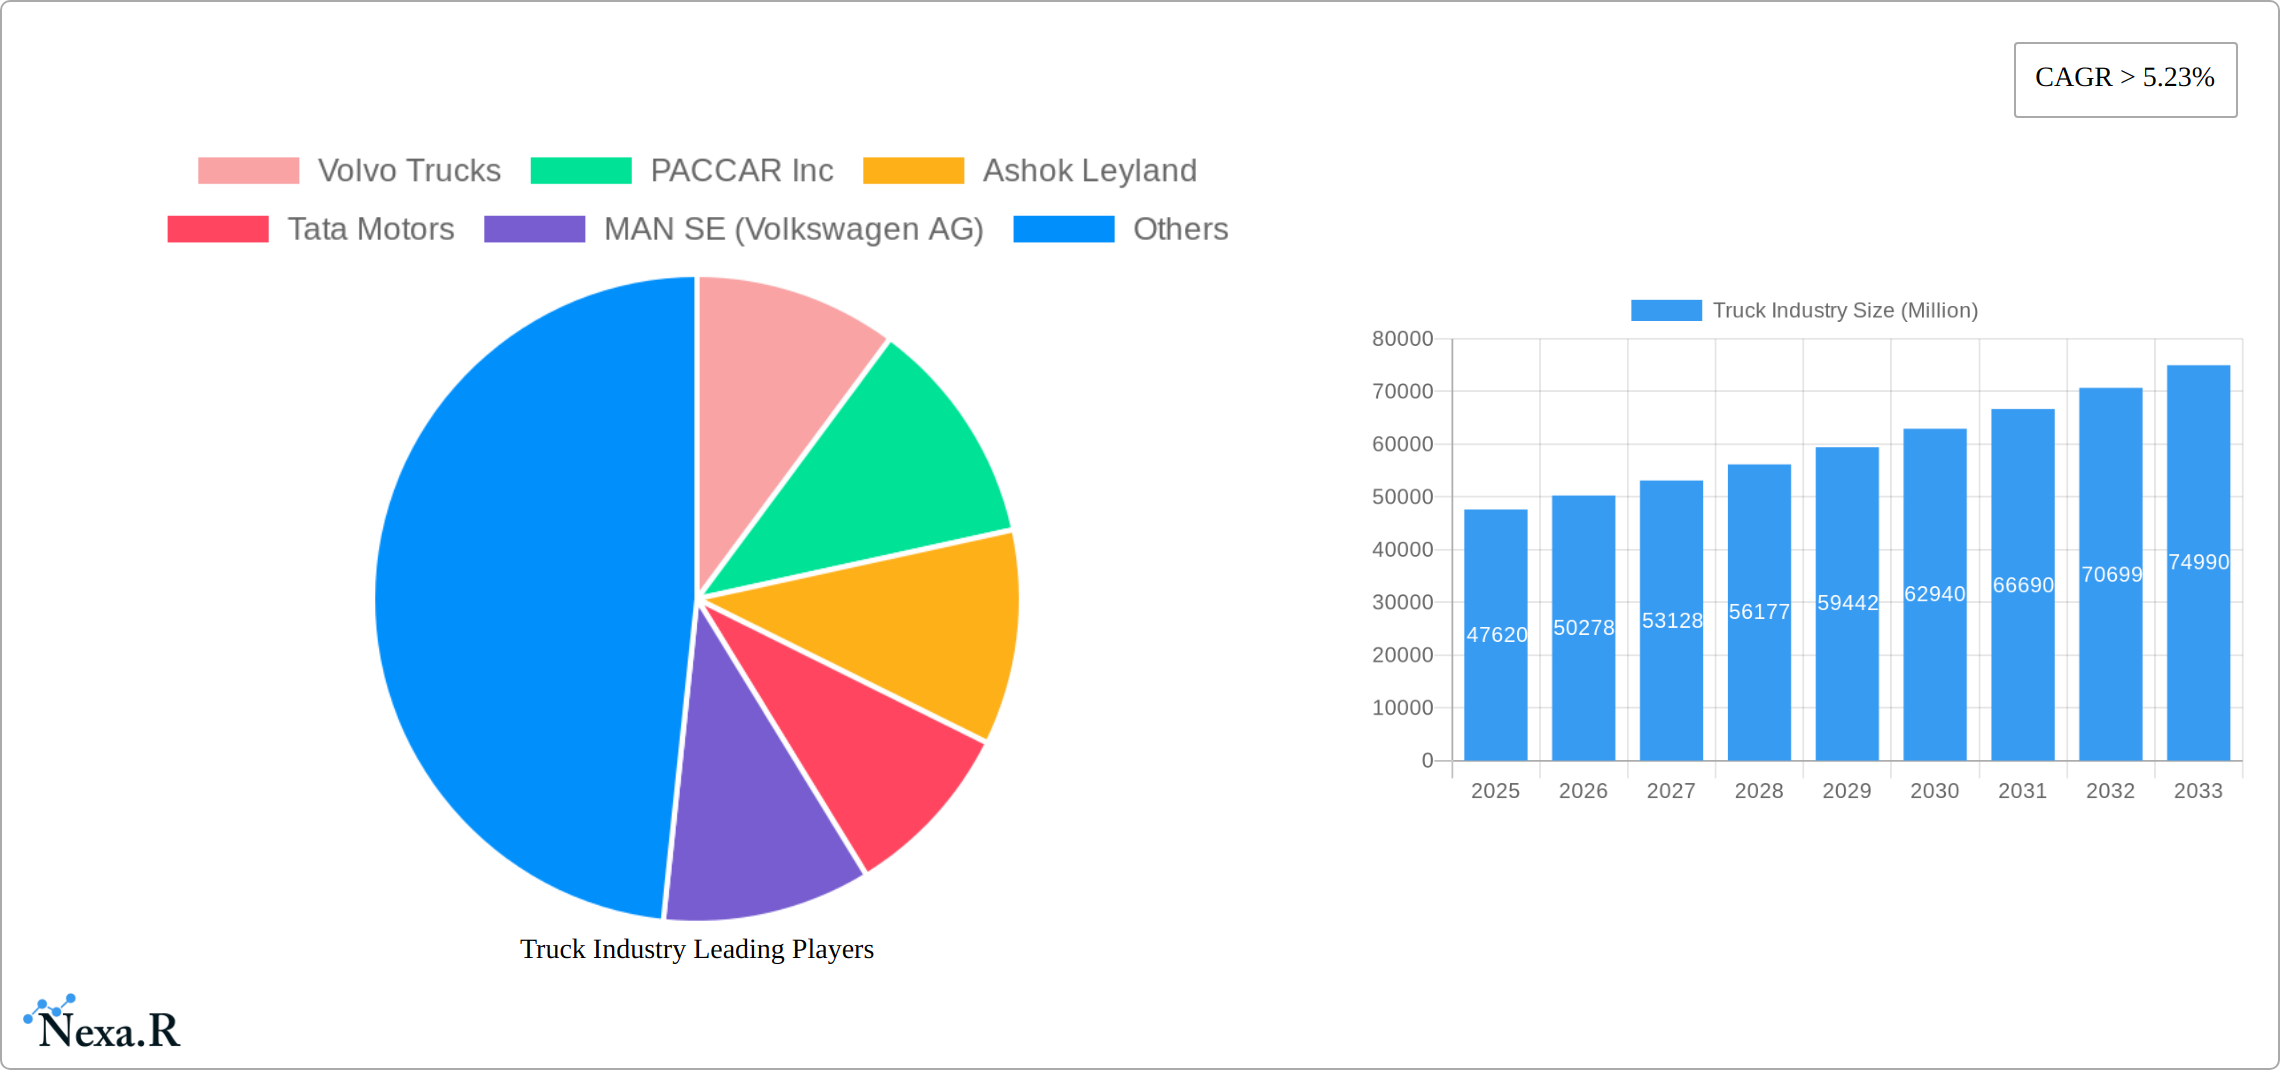
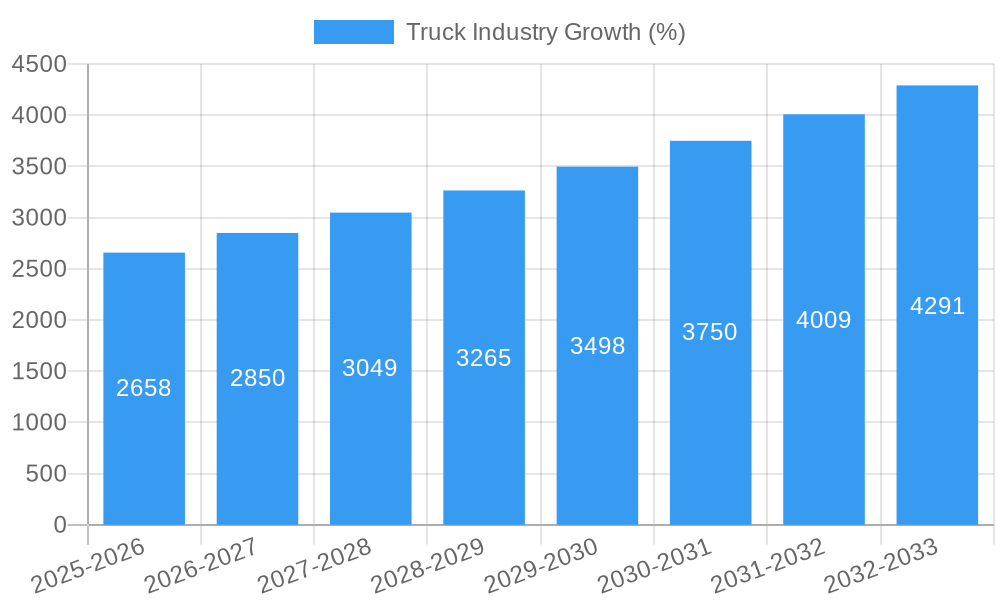
The global used truck market, valued at $47.62 billion in 2025, is projected to experience robust growth, exhibiting a Compound Annual Growth Rate (CAGR) exceeding 5.23% from 2025 to 2033. This expansion is driven by several key factors. Firstly, the increasing demand for efficient logistics and transportation solutions across various sectors, including e-commerce and manufacturing, fuels the need for reliable used trucks. Secondly, the relatively lower acquisition cost of used trucks compared to new ones makes them an attractive option for small and medium-sized enterprises (SMEs), particularly in developing economies. Finally, advancements in truck technology, including improved fuel efficiency and telematics integration, are extending the lifespan and usability of older models, contributing to market growth. The market is segmented by vehicle type (light, medium, and heavy-duty trucks), sales channel (independent dealers, franchised dealers, and peer-to-peer), and geography, with North America, Europe, and Asia-Pacific representing major regional markets. Competition is fierce, with established players like Volvo Trucks, PACCAR Inc., Daimler AG, and Tata Motors vying for market share alongside independent dealers and online platforms.
The market's growth trajectory is influenced by several trends. The rise of online marketplaces and digital platforms is transforming how used trucks are bought and sold, improving transparency and efficiency. Stringent emission regulations are pushing the adoption of more fuel-efficient and environmentally friendly used trucks, while the fluctuating prices of fuel and raw materials impact the overall market dynamics. Potential restraints include the cyclical nature of the trucking industry, susceptibility to economic downturns, and the increasing availability of alternative transportation modes. However, the long-term outlook remains positive, fueled by the continuous growth of global trade and the enduring need for robust transportation infrastructure. Regional variations in market growth will likely reflect economic conditions, infrastructure development, and governmental regulations. The Asia-Pacific region, particularly India and China, is expected to experience substantial growth driven by burgeoning economies and expanding logistics networks.
This comprehensive report provides a detailed analysis of the global truck industry, encompassing market dynamics, growth trends, competitive landscape, and future outlook. The study period covers 2019-2033, with 2025 as the base year and forecast extending to 2033. The report delves into various truck segments, including light, medium, and heavy-duty trucks, and analyzes diverse sales channels like independent dealers, franchised dealers, and peer-to-peer platforms. Key players such as Volvo Trucks, PACCAR Inc., and Daimler AG are profiled, offering invaluable insights for industry professionals, investors, and strategic decision-makers. The report projects a market size of xx Million units by 2033.
Truck Industry Market Dynamics & Structure
The global truck industry is characterized by a moderately concentrated market structure, with a few dominant players holding significant market share. Technological innovation, particularly in areas like electrification, automation, and connectivity, is a key driver of growth. Stringent regulatory frameworks concerning emissions and safety standards are shaping industry practices. Competition from alternative transportation modes, such as rail and shipping, poses a challenge. End-user demographics, primarily focused on logistics, construction, and transportation sectors, are influential in market demand. M&A activity has been moderate, with a focus on consolidating market share and expanding geographical reach.
- Market Concentration: Top 5 players hold approximately xx% of the global market share (2024).
- Technological Drivers: Electrification, autonomous driving, telematics, and connected services are transforming the industry.
- Regulatory Landscape: Stringent emission norms (e.g., Euro VI, BS-VI) and safety regulations influence vehicle design and production.
- Competitive Substitutes: Rail freight, shipping, and air freight present alternative options for long-haul transportation.
- End-User Demographics: Logistics companies, construction firms, and transportation providers constitute major end-users.
- M&A Activity: xx major M&A deals were recorded between 2019-2024, primarily focused on expanding product portfolios and geographical reach. Further consolidation is anticipated.
Truck Industry Growth Trends & Insights
The global truck market witnessed a CAGR of xx% during the historical period (2019-2024), driven by factors such as infrastructure development, e-commerce boom, and growing industrialization. Adoption of new technologies like telematics is steadily increasing, enhancing fleet management efficiency and operational optimization. Consumer behavior shifts towards fuel-efficient and environmentally friendly vehicles are impacting product development. The market is expected to experience a CAGR of xx% during the forecast period (2025-2033), with significant growth anticipated in emerging markets.
- Market Size Evolution: The market size grew from xx Million units in 2019 to xx Million units in 2024.
- Adoption Rates: Telematics adoption rate is projected to reach xx% by 2033.
- Technological Disruptions: Electrification is expected to significantly disrupt the market in the coming years.
- Consumer Behavior Shifts: Demand for fuel-efficient, safe, and technologically advanced trucks is driving innovation.
Dominant Regions, Countries, or Segments in Truck Industry
The North American and European regions currently dominate the global truck market, driven by robust infrastructure, established logistics networks, and high vehicle ownership rates. Within vehicle types, heavy-duty trucks constitute the largest segment, followed by medium-duty and light-duty trucks. Franchised dealers remain the primary sales channel, though peer-to-peer platforms are gaining traction.
- Leading Region: North America (Market Share: xx% in 2024) due to strong demand from logistics sector and infrastructure development.
- Leading Vehicle Type: Heavy-duty trucks (Market Share: xx% in 2024) due to the dominance of long-haul transportation.
- Leading Sales Channel: Franchised Dealers (Market Share: xx% in 2024), offering established networks and warranty support.
- Key Growth Drivers: Economic growth, infrastructure investments, government policies promoting sustainable transportation, and technological advancements.
Truck Industry Product Landscape
The truck industry offers a diverse product landscape, ranging from basic cargo trucks to specialized vehicles equipped with advanced technologies. Innovations focus on enhancing fuel efficiency, safety, payload capacity, and driver comfort. Features such as advanced driver-assistance systems (ADAS), telematics, and connected services are becoming increasingly common. Unique selling propositions often include specific features tailored to end-user needs, such as optimized fuel consumption or enhanced safety measures.
Key Drivers, Barriers & Challenges in Truck Industry
Key Drivers:
- Rising e-commerce and last-mile delivery demands.
- Growth in infrastructure development and construction.
- Government regulations promoting efficient transportation.
- Technological advancements in engine technology and autonomous driving.
Key Challenges:
- Fluctuations in raw material prices.
- Supply chain disruptions impacting production timelines.
- Stringent emission norms increasing vehicle production costs.
- Intense competition from established and emerging players.
Emerging Opportunities in Truck Industry
- Growing demand for electric and alternative fuel trucks.
- Expansion into untapped markets in developing economies.
- Development of specialized trucks for niche applications.
- Integration of artificial intelligence and machine learning for improved efficiency and safety.
Growth Accelerators in the Truck Industry Industry
Technological advancements, particularly in areas of electrification, automation, and connectivity, will significantly accelerate growth in the truck industry. Strategic partnerships between manufacturers and technology providers will unlock innovation and efficiency gains. Expansion into emerging markets and the development of specialized vehicle solutions will further drive market growth.
Key Players Shaping the Truck Industry Market
- Volvo Trucks
- PACCAR Inc
- Ashok Leyland
- Tata Motors
- MAN SE (Volkswagen AG)
- Scania AB (Traton SE)
- Navistar International Corporation
- Eicher
- Renault SA
- Mascus
- Daimler AG (SelecTrucks)
- Enterprise Truck Rental
- AmeriQuest Used Truck
Notable Milestones in Truck Industry Sector
- August 2023: Ashok Leyland launches its e-marketplace 'Re-AL' for used trucks, facilitating vehicle exchange and upgrades.
- June 2023: Daimler introduces the "Bharat Benz Certified" platform for pre-owned trucks, enhancing customer trust and promoting sustainability.
In-Depth Truck Industry Market Outlook
The truck industry is poised for significant growth, driven by technological advancements, expanding infrastructure, and increasing e-commerce activity. Strategic partnerships and a focus on sustainability will shape the future landscape. The market is expected to witness a shift towards electric and autonomous vehicles, creating opportunities for early adopters and innovators. The industry's future success hinges on adapting to evolving consumer needs and regulatory landscapes.
Truck Industry Segmentation
-
1. Vehicle Type
- 1.1. Light Trucks
- 1.2. Medium-duty Trucks
- 1.3. Heavy-duty Trucks
-
2. Sales Channel
- 2.1. Independent Dealer
- 2.2. Franchised Dealer
- 2.3. Peer-to-peer
Truck Industry Segmentation By Geography
-
1. North America
- 1.1. United States
- 1.2. Canada
- 1.3. Rest of North America
-
2. Europe
- 2.1. Germany
- 2.2. United Kingdom
- 2.3. France
- 2.4. Russia
- 2.5. Italy
- 2.6. Rest of Europe
-
3. Asia Pacific
- 3.1. China
- 3.2. Japan
- 3.3. India
- 3.4. South Korea
- 3.5. Rest of Asia Pacific
-
4. Rest of the World
- 4.1. Brazil
- 4.2. South Africa
- 4.3. Other Countries

Truck Industry REPORT HIGHLIGHTS
| Aspects | Details |
|---|---|
| Study Period | 2019-2033 |
| Base Year | 2024 |
| Estimated Year | 2025 |
| Forecast Period | 2025-2033 |
| Historical Period | 2019-2024 |
| Growth Rate | CAGR of > 5.23% from 2019-2033 |
| Segmentation |
|
Table of Contents
- 1. Introduction
- 1.1. Research Scope
- 1.2. Market Segmentation
- 1.3. Research Methodology
- 1.4. Definitions and Assumptions
- 2. Executive Summary
- 2.1. Introduction
- 3. Market Dynamics
- 3.1. Introduction
- 3.2. Market Drivers
- 3.2.1. Increasing Infrastructure and Growing Construction Activities are Driving the Demand for Used Trucks; Cost Effectiveness and Affordability are Fueling the Demand for Used Trucks
- 3.3. Market Restrains
- 3.3.1. Stringent Emission and Safety Standards Present Challenges for the Market
- 3.4. Market Trends
- 3.4.1. Heavy-duty Trucks Will be the Leading Segment
- 4. Market Factor Analysis
- 4.1. Porters Five Forces
- 4.2. Supply/Value Chain
- 4.3. PESTEL analysis
- 4.4. Market Entropy
- 4.5. Patent/Trademark Analysis
- 5. Global Truck Industry Analysis, Insights and Forecast, 2019-2031
- 5.1. Market Analysis, Insights and Forecast - by Vehicle Type
- 5.1.1. Light Trucks
- 5.1.2. Medium-duty Trucks
- 5.1.3. Heavy-duty Trucks
- 5.2. Market Analysis, Insights and Forecast - by Sales Channel
- 5.2.1. Independent Dealer
- 5.2.2. Franchised Dealer
- 5.2.3. Peer-to-peer
- 5.3. Market Analysis, Insights and Forecast - by Region
- 5.3.1. North America
- 5.3.2. Europe
- 5.3.3. Asia Pacific
- 5.3.4. Rest of the World
- 5.1. Market Analysis, Insights and Forecast - by Vehicle Type
- 6. North America Truck Industry Analysis, Insights and Forecast, 2019-2031
- 6.1. Market Analysis, Insights and Forecast - by Vehicle Type
- 6.1.1. Light Trucks
- 6.1.2. Medium-duty Trucks
- 6.1.3. Heavy-duty Trucks
- 6.2. Market Analysis, Insights and Forecast - by Sales Channel
- 6.2.1. Independent Dealer
- 6.2.2. Franchised Dealer
- 6.2.3. Peer-to-peer
- 6.1. Market Analysis, Insights and Forecast - by Vehicle Type
- 7. Europe Truck Industry Analysis, Insights and Forecast, 2019-2031
- 7.1. Market Analysis, Insights and Forecast - by Vehicle Type
- 7.1.1. Light Trucks
- 7.1.2. Medium-duty Trucks
- 7.1.3. Heavy-duty Trucks
- 7.2. Market Analysis, Insights and Forecast - by Sales Channel
- 7.2.1. Independent Dealer
- 7.2.2. Franchised Dealer
- 7.2.3. Peer-to-peer
- 7.1. Market Analysis, Insights and Forecast - by Vehicle Type
- 8. Asia Pacific Truck Industry Analysis, Insights and Forecast, 2019-2031
- 8.1. Market Analysis, Insights and Forecast - by Vehicle Type
- 8.1.1. Light Trucks
- 8.1.2. Medium-duty Trucks
- 8.1.3. Heavy-duty Trucks
- 8.2. Market Analysis, Insights and Forecast - by Sales Channel
- 8.2.1. Independent Dealer
- 8.2.2. Franchised Dealer
- 8.2.3. Peer-to-peer
- 8.1. Market Analysis, Insights and Forecast - by Vehicle Type
- 9. Rest of the World Truck Industry Analysis, Insights and Forecast, 2019-2031
- 9.1. Market Analysis, Insights and Forecast - by Vehicle Type
- 9.1.1. Light Trucks
- 9.1.2. Medium-duty Trucks
- 9.1.3. Heavy-duty Trucks
- 9.2. Market Analysis, Insights and Forecast - by Sales Channel
- 9.2.1. Independent Dealer
- 9.2.2. Franchised Dealer
- 9.2.3. Peer-to-peer
- 9.1. Market Analysis, Insights and Forecast - by Vehicle Type
- 10. North America Truck Industry Analysis, Insights and Forecast, 2019-2031
- 10.1. Market Analysis, Insights and Forecast - By Country/Sub-region
- 10.1.1 United States
- 10.1.2 Canada
- 10.1.3 Rest of North America
- 11. Europe Truck Industry Analysis, Insights and Forecast, 2019-2031
- 11.1. Market Analysis, Insights and Forecast - By Country/Sub-region
- 11.1.1 Germany
- 11.1.2 United Kingdom
- 11.1.3 France
- 11.1.4 Russia
- 11.1.5 Italy
- 11.1.6 Rest of Europe
- 12. Asia Pacific Truck Industry Analysis, Insights and Forecast, 2019-2031
- 12.1. Market Analysis, Insights and Forecast - By Country/Sub-region
- 12.1.1 China
- 12.1.2 Japan
- 12.1.3 India
- 12.1.4 South Korea
- 12.1.5 Rest of Asia Pacific
- 13. Rest of the World Truck Industry Analysis, Insights and Forecast, 2019-2031
- 13.1. Market Analysis, Insights and Forecast - By Country/Sub-region
- 13.1.1 Brazil
- 13.1.2 South Africa
- 13.1.3 Other Countries
- 14. Competitive Analysis
- 14.1. Global Market Share Analysis 2024
- 14.2. Company Profiles
- 14.2.1 Volvo Trucks
- 14.2.1.1. Overview
- 14.2.1.2. Products
- 14.2.1.3. SWOT Analysis
- 14.2.1.4. Recent Developments
- 14.2.1.5. Financials (Based on Availability)
- 14.2.2 PACCAR Inc
- 14.2.2.1. Overview
- 14.2.2.2. Products
- 14.2.2.3. SWOT Analysis
- 14.2.2.4. Recent Developments
- 14.2.2.5. Financials (Based on Availability)
- 14.2.3 Ashok Leyland
- 14.2.3.1. Overview
- 14.2.3.2. Products
- 14.2.3.3. SWOT Analysis
- 14.2.3.4. Recent Developments
- 14.2.3.5. Financials (Based on Availability)
- 14.2.4 Tata Motors
- 14.2.4.1. Overview
- 14.2.4.2. Products
- 14.2.4.3. SWOT Analysis
- 14.2.4.4. Recent Developments
- 14.2.4.5. Financials (Based on Availability)
- 14.2.5 MAN SE (Volkswagen AG)
- 14.2.5.1. Overview
- 14.2.5.2. Products
- 14.2.5.3. SWOT Analysis
- 14.2.5.4. Recent Developments
- 14.2.5.5. Financials (Based on Availability)
- 14.2.6 Scania AB ( Traton SE)
- 14.2.6.1. Overview
- 14.2.6.2. Products
- 14.2.6.3. SWOT Analysis
- 14.2.6.4. Recent Developments
- 14.2.6.5. Financials (Based on Availability)
- 14.2.7 Navistar International Corporation
- 14.2.7.1. Overview
- 14.2.7.2. Products
- 14.2.7.3. SWOT Analysis
- 14.2.7.4. Recent Developments
- 14.2.7.5. Financials (Based on Availability)
- 14.2.8 Eicher
- 14.2.8.1. Overview
- 14.2.8.2. Products
- 14.2.8.3. SWOT Analysis
- 14.2.8.4. Recent Developments
- 14.2.8.5. Financials (Based on Availability)
- 14.2.9 Renault SA
- 14.2.9.1. Overview
- 14.2.9.2. Products
- 14.2.9.3. SWOT Analysis
- 14.2.9.4. Recent Developments
- 14.2.9.5. Financials (Based on Availability)
- 14.2.10 Mascus
- 14.2.10.1. Overview
- 14.2.10.2. Products
- 14.2.10.3. SWOT Analysis
- 14.2.10.4. Recent Developments
- 14.2.10.5. Financials (Based on Availability)
- 14.2.11 Daimler AG (SelecTrucks)
- 14.2.11.1. Overview
- 14.2.11.2. Products
- 14.2.11.3. SWOT Analysis
- 14.2.11.4. Recent Developments
- 14.2.11.5. Financials (Based on Availability)
- 14.2.12 Enterprise Truck Rental
- 14.2.12.1. Overview
- 14.2.12.2. Products
- 14.2.12.3. SWOT Analysis
- 14.2.12.4. Recent Developments
- 14.2.12.5. Financials (Based on Availability)
- 14.2.13 AmeriQuest Used Truck
- 14.2.13.1. Overview
- 14.2.13.2. Products
- 14.2.13.3. SWOT Analysis
- 14.2.13.4. Recent Developments
- 14.2.13.5. Financials (Based on Availability)
- 14.2.1 Volvo Trucks
List of Figures
- Figure 1: Global Truck Industry Revenue Breakdown (Million, %) by Region 2024 & 2032
- Figure 2: North America Truck Industry Revenue (Million), by Country 2024 & 2032
- Figure 3: North America Truck Industry Revenue Share (%), by Country 2024 & 2032
- Figure 4: Europe Truck Industry Revenue (Million), by Country 2024 & 2032
- Figure 5: Europe Truck Industry Revenue Share (%), by Country 2024 & 2032
- Figure 6: Asia Pacific Truck Industry Revenue (Million), by Country 2024 & 2032
- Figure 7: Asia Pacific Truck Industry Revenue Share (%), by Country 2024 & 2032
- Figure 8: Rest of the World Truck Industry Revenue (Million), by Country 2024 & 2032
- Figure 9: Rest of the World Truck Industry Revenue Share (%), by Country 2024 & 2032
- Figure 10: North America Truck Industry Revenue (Million), by Vehicle Type 2024 & 2032
- Figure 11: North America Truck Industry Revenue Share (%), by Vehicle Type 2024 & 2032
- Figure 12: North America Truck Industry Revenue (Million), by Sales Channel 2024 & 2032
- Figure 13: North America Truck Industry Revenue Share (%), by Sales Channel 2024 & 2032
- Figure 14: North America Truck Industry Revenue (Million), by Country 2024 & 2032
- Figure 15: North America Truck Industry Revenue Share (%), by Country 2024 & 2032
- Figure 16: Europe Truck Industry Revenue (Million), by Vehicle Type 2024 & 2032
- Figure 17: Europe Truck Industry Revenue Share (%), by Vehicle Type 2024 & 2032
- Figure 18: Europe Truck Industry Revenue (Million), by Sales Channel 2024 & 2032
- Figure 19: Europe Truck Industry Revenue Share (%), by Sales Channel 2024 & 2032
- Figure 20: Europe Truck Industry Revenue (Million), by Country 2024 & 2032
- Figure 21: Europe Truck Industry Revenue Share (%), by Country 2024 & 2032
- Figure 22: Asia Pacific Truck Industry Revenue (Million), by Vehicle Type 2024 & 2032
- Figure 23: Asia Pacific Truck Industry Revenue Share (%), by Vehicle Type 2024 & 2032
- Figure 24: Asia Pacific Truck Industry Revenue (Million), by Sales Channel 2024 & 2032
- Figure 25: Asia Pacific Truck Industry Revenue Share (%), by Sales Channel 2024 & 2032
- Figure 26: Asia Pacific Truck Industry Revenue (Million), by Country 2024 & 2032
- Figure 27: Asia Pacific Truck Industry Revenue Share (%), by Country 2024 & 2032
- Figure 28: Rest of the World Truck Industry Revenue (Million), by Vehicle Type 2024 & 2032
- Figure 29: Rest of the World Truck Industry Revenue Share (%), by Vehicle Type 2024 & 2032
- Figure 30: Rest of the World Truck Industry Revenue (Million), by Sales Channel 2024 & 2032
- Figure 31: Rest of the World Truck Industry Revenue Share (%), by Sales Channel 2024 & 2032
- Figure 32: Rest of the World Truck Industry Revenue (Million), by Country 2024 & 2032
- Figure 33: Rest of the World Truck Industry Revenue Share (%), by Country 2024 & 2032
List of Tables
- Table 1: Global Truck Industry Revenue Million Forecast, by Region 2019 & 2032
- Table 2: Global Truck Industry Revenue Million Forecast, by Vehicle Type 2019 & 2032
- Table 3: Global Truck Industry Revenue Million Forecast, by Sales Channel 2019 & 2032
- Table 4: Global Truck Industry Revenue Million Forecast, by Region 2019 & 2032
- Table 5: Global Truck Industry Revenue Million Forecast, by Country 2019 & 2032
- Table 6: United States Truck Industry Revenue (Million) Forecast, by Application 2019 & 2032
- Table 7: Canada Truck Industry Revenue (Million) Forecast, by Application 2019 & 2032
- Table 8: Rest of North America Truck Industry Revenue (Million) Forecast, by Application 2019 & 2032
- Table 9: Global Truck Industry Revenue Million Forecast, by Country 2019 & 2032
- Table 10: Germany Truck Industry Revenue (Million) Forecast, by Application 2019 & 2032
- Table 11: United Kingdom Truck Industry Revenue (Million) Forecast, by Application 2019 & 2032
- Table 12: France Truck Industry Revenue (Million) Forecast, by Application 2019 & 2032
- Table 13: Russia Truck Industry Revenue (Million) Forecast, by Application 2019 & 2032
- Table 14: Italy Truck Industry Revenue (Million) Forecast, by Application 2019 & 2032
- Table 15: Rest of Europe Truck Industry Revenue (Million) Forecast, by Application 2019 & 2032
- Table 16: Global Truck Industry Revenue Million Forecast, by Country 2019 & 2032
- Table 17: China Truck Industry Revenue (Million) Forecast, by Application 2019 & 2032
- Table 18: Japan Truck Industry Revenue (Million) Forecast, by Application 2019 & 2032
- Table 19: India Truck Industry Revenue (Million) Forecast, by Application 2019 & 2032
- Table 20: South Korea Truck Industry Revenue (Million) Forecast, by Application 2019 & 2032
- Table 21: Rest of Asia Pacific Truck Industry Revenue (Million) Forecast, by Application 2019 & 2032
- Table 22: Global Truck Industry Revenue Million Forecast, by Country 2019 & 2032
- Table 23: Brazil Truck Industry Revenue (Million) Forecast, by Application 2019 & 2032
- Table 24: South Africa Truck Industry Revenue (Million) Forecast, by Application 2019 & 2032
- Table 25: Other Countries Truck Industry Revenue (Million) Forecast, by Application 2019 & 2032
- Table 26: Global Truck Industry Revenue Million Forecast, by Vehicle Type 2019 & 2032
- Table 27: Global Truck Industry Revenue Million Forecast, by Sales Channel 2019 & 2032
- Table 28: Global Truck Industry Revenue Million Forecast, by Country 2019 & 2032
- Table 29: United States Truck Industry Revenue (Million) Forecast, by Application 2019 & 2032
- Table 30: Canada Truck Industry Revenue (Million) Forecast, by Application 2019 & 2032
- Table 31: Rest of North America Truck Industry Revenue (Million) Forecast, by Application 2019 & 2032
- Table 32: Global Truck Industry Revenue Million Forecast, by Vehicle Type 2019 & 2032
- Table 33: Global Truck Industry Revenue Million Forecast, by Sales Channel 2019 & 2032
- Table 34: Global Truck Industry Revenue Million Forecast, by Country 2019 & 2032
- Table 35: Germany Truck Industry Revenue (Million) Forecast, by Application 2019 & 2032
- Table 36: United Kingdom Truck Industry Revenue (Million) Forecast, by Application 2019 & 2032
- Table 37: France Truck Industry Revenue (Million) Forecast, by Application 2019 & 2032
- Table 38: Russia Truck Industry Revenue (Million) Forecast, by Application 2019 & 2032
- Table 39: Italy Truck Industry Revenue (Million) Forecast, by Application 2019 & 2032
- Table 40: Rest of Europe Truck Industry Revenue (Million) Forecast, by Application 2019 & 2032
- Table 41: Global Truck Industry Revenue Million Forecast, by Vehicle Type 2019 & 2032
- Table 42: Global Truck Industry Revenue Million Forecast, by Sales Channel 2019 & 2032
- Table 43: Global Truck Industry Revenue Million Forecast, by Country 2019 & 2032
- Table 44: China Truck Industry Revenue (Million) Forecast, by Application 2019 & 2032
- Table 45: Japan Truck Industry Revenue (Million) Forecast, by Application 2019 & 2032
- Table 46: India Truck Industry Revenue (Million) Forecast, by Application 2019 & 2032
- Table 47: South Korea Truck Industry Revenue (Million) Forecast, by Application 2019 & 2032
- Table 48: Rest of Asia Pacific Truck Industry Revenue (Million) Forecast, by Application 2019 & 2032
- Table 49: Global Truck Industry Revenue Million Forecast, by Vehicle Type 2019 & 2032
- Table 50: Global Truck Industry Revenue Million Forecast, by Sales Channel 2019 & 2032
- Table 51: Global Truck Industry Revenue Million Forecast, by Country 2019 & 2032
- Table 52: Brazil Truck Industry Revenue (Million) Forecast, by Application 2019 & 2032
- Table 53: South Africa Truck Industry Revenue (Million) Forecast, by Application 2019 & 2032
- Table 54: Other Countries Truck Industry Revenue (Million) Forecast, by Application 2019 & 2032
Frequently Asked Questions
1. What is the projected Compound Annual Growth Rate (CAGR) of the Truck Industry?
The projected CAGR is approximately > 5.23%.
2. Which companies are prominent players in the Truck Industry?
Key companies in the market include Volvo Trucks, PACCAR Inc, Ashok Leyland, Tata Motors, MAN SE (Volkswagen AG), Scania AB ( Traton SE), Navistar International Corporation, Eicher, Renault SA, Mascus, Daimler AG (SelecTrucks), Enterprise Truck Rental, AmeriQuest Used Truck.
3. What are the main segments of the Truck Industry?
The market segments include Vehicle Type, Sales Channel.
4. Can you provide details about the market size?
The market size is estimated to be USD 47.62 Million as of 2022.
5. What are some drivers contributing to market growth?
Increasing Infrastructure and Growing Construction Activities are Driving the Demand for Used Trucks; Cost Effectiveness and Affordability are Fueling the Demand for Used Trucks.
6. What are the notable trends driving market growth?
Heavy-duty Trucks Will be the Leading Segment.
7. Are there any restraints impacting market growth?
Stringent Emission and Safety Standards Present Challenges for the Market.
8. Can you provide examples of recent developments in the market?
August 2023: Ashok Leyland introduced its e-marketplace 'Re-AL', dedicated to the sale of used trucks. The platform enables customers to exchange their existing commercial vehicles and upgrade to new Ashok Leyland trucks and buses. The e-marketplace provides customers with various features to help them easily locate vehicles of their choice, including verified images of the vehicles, validated documents, and evaluation reports.
9. What pricing options are available for accessing the report?
Pricing options include single-user, multi-user, and enterprise licenses priced at USD 4750, USD 5250, and USD 8750 respectively.
10. Is the market size provided in terms of value or volume?
The market size is provided in terms of value, measured in Million.
11. Are there any specific market keywords associated with the report?
Yes, the market keyword associated with the report is "Truck Industry," which aids in identifying and referencing the specific market segment covered.
12. How do I determine which pricing option suits my needs best?
The pricing options vary based on user requirements and access needs. Individual users may opt for single-user licenses, while businesses requiring broader access may choose multi-user or enterprise licenses for cost-effective access to the report.
13. Are there any additional resources or data provided in the Truck Industry report?
While the report offers comprehensive insights, it's advisable to review the specific contents or supplementary materials provided to ascertain if additional resources or data are available.
14. How can I stay updated on further developments or reports in the Truck Industry?
To stay informed about further developments, trends, and reports in the Truck Industry, consider subscribing to industry newsletters, following relevant companies and organizations, or regularly checking reputable industry news sources and publications.
Methodology
Step 1 - Identification of Relevant Samples Size from Population Database


Step 2 - Approaches for Defining Global Market Size (Value, Volume* & Price*)

Note*: In applicable scenarios
Step 3 - Data Sources
Primary Research
- Web Analytics
- Survey Reports
- Research Institute
- Latest Research Reports
- Opinion Leaders
Secondary Research
- Annual Reports
- White Paper
- Latest Press Release
- Industry Association
- Paid Database
- Investor Presentations

Step 4 - Data Triangulation
Involves using different sources of information in order to increase the validity of a study
These sources are likely to be stakeholders in a program - participants, other researchers, program staff, other community members, and so on.
Then we put all data in single framework & apply various statistical tools to find out the dynamic on the market.
During the analysis stage, feedback from the stakeholder groups would be compared to determine areas of agreement as well as areas of divergence
