

Key Insights
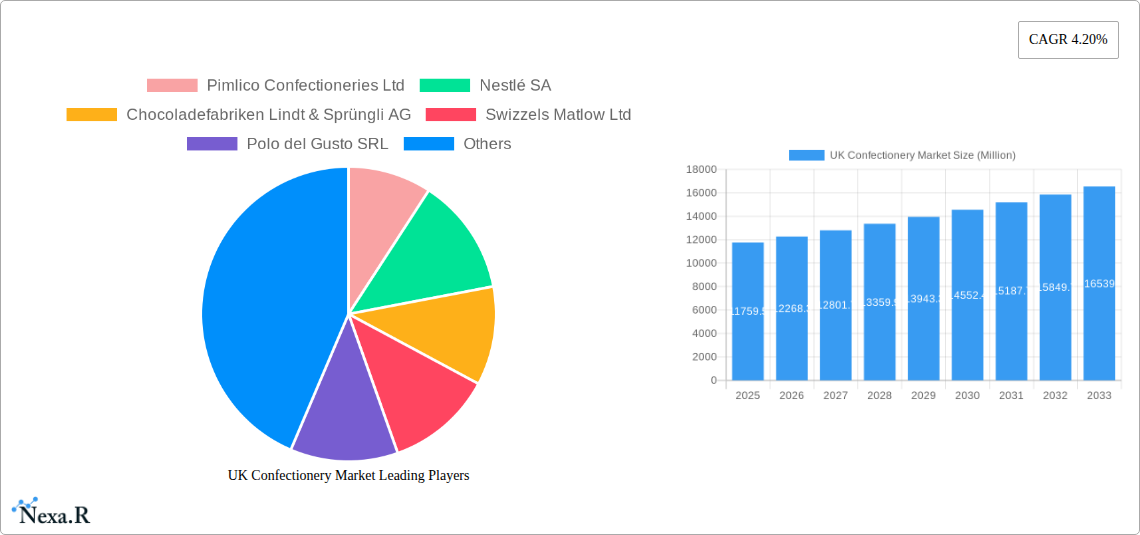
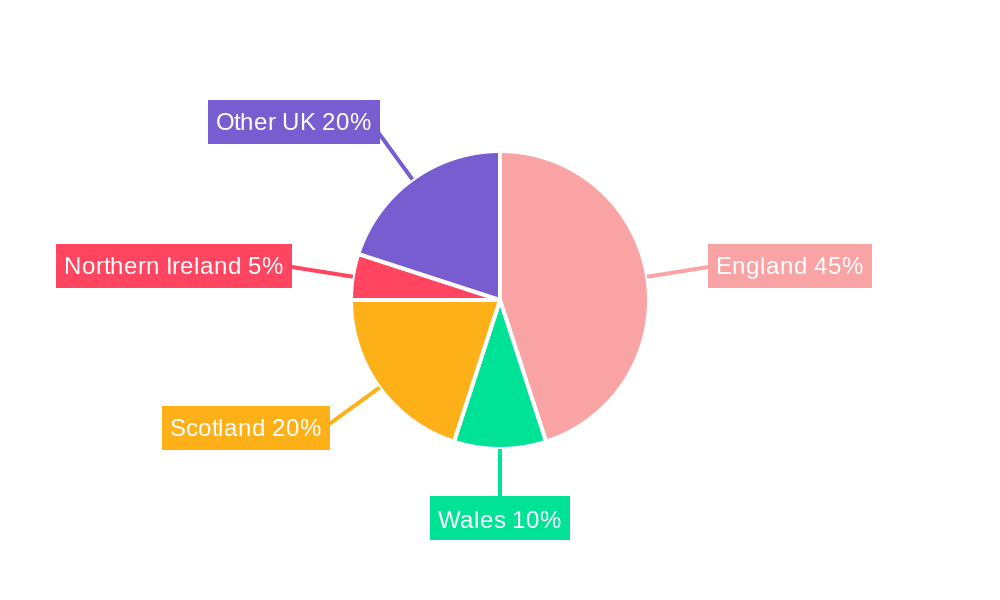
The UK confectionery market, valued at £11,759.5 million in 2025, is projected to experience steady growth, driven by several key factors. The rising disposable incomes and increasing urbanization in the UK contribute to higher consumer spending on confectionery products, particularly within the premium chocolate segment. Changing consumer preferences towards healthier options and increasing demand for organic and ethically sourced ingredients are shaping market trends. Convenience stores and online retail stores are experiencing significant growth as distribution channels, catering to the changing lifestyles and shopping habits of consumers. While the market faces restraints such as fluctuating raw material prices and growing health concerns related to sugar consumption, innovation in product offerings, such as sugar-reduced options and unique flavour combinations, is mitigating these challenges. Key players like Nestlé, Mars, and Ferrero are strategically investing in product diversification and marketing campaigns to maintain their market share. The regional distribution within the UK shows consistent demand across England, Wales, Scotland, and Northern Ireland, although regional variations in consumer preferences might exist. The forecast period (2025-2033) anticipates a continued, albeit moderate, expansion of the market, largely driven by the ongoing evolution of consumer preferences and the strategic initiatives of market leaders.
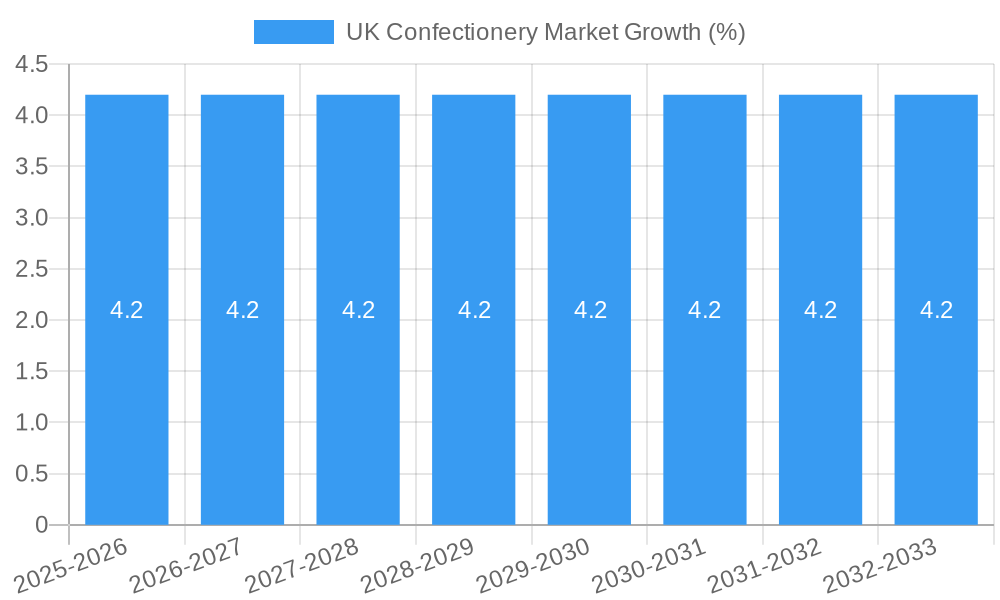
The consistent 4.20% CAGR indicates a stable growth trajectory, although it's crucial to monitor macroeconomic factors that could impact consumer spending. The segmentation reveals a strong demand for chocolate confections, which are expected to remain the dominant segment throughout the forecast period. The growth of online retail channels presents opportunities for smaller confectionery brands to expand their reach beyond traditional brick-and-mortar stores. Competition within the market remains intense, with established multinational companies facing challenges from emerging local brands specializing in unique and artisanal confectionery products. Future market growth will likely depend on the ability of manufacturers to adapt to changing consumer health consciousness while maintaining product appeal and affordability.
UK Confectionery Market: A Comprehensive Market Report (2019-2033)
This in-depth report provides a comprehensive analysis of the UK confectionery market, encompassing market dynamics, growth trends, key players, and future outlook. The report covers the period 2019-2033, with a focus on the forecast period 2025-2033 (Base Year: 2025, Estimated Year: 2025). This report is crucial for industry professionals, investors, and stakeholders seeking a clear understanding of this dynamic market. The market is segmented by product (Confections: Chocolate, Others) and distribution channel (Convenience Store, Online Retail Store, Supermarket/Hypermarket, Others).
UK Confectionery Market Dynamics & Structure
The UK confectionery market is a highly competitive landscape characterized by a mix of multinational giants and smaller, specialized players. Market concentration is moderate, with a few dominant players holding significant market share, while numerous smaller companies cater to niche segments. Technological innovation, particularly in areas like sustainable packaging and healthier confectionery options, is a key driver. Stringent regulatory frameworks concerning sugar content, labeling, and marketing influence product development and sales strategies. Competitive product substitutes, such as healthier snacks and alternative desserts, pose a challenge to traditional confectionery. End-user demographics, particularly the growing health-conscious consumer segment, are reshaping consumer preferences. M&A activity has been moderate in recent years, with larger players strategically acquiring smaller companies to expand their product portfolio or market reach.
- Market Concentration: Moderate, with top 5 players holding xx% market share (2024).
- Technological Innovation: Focus on sustainable packaging, healthier formulations, and personalized offerings.
- Regulatory Framework: Stringent regulations on sugar content, labeling, and marketing impacting product development.
- Competitive Substitutes: Growth of healthier snack options and alternative desserts presenting competitive pressure.
- M&A Activity: xx deals in the past 5 years, primarily focused on portfolio expansion and market consolidation.
- Innovation Barriers: High R&D costs, consumer preference for traditional tastes, and regulatory hurdles.
UK Confectionery Market Growth Trends & Insights
The UK confectionery market has experienced steady growth over the historical period (2019-2024), driven by factors such as increasing disposable incomes and changing consumer preferences. However, the growth rate has been impacted by health concerns around sugar consumption and a growing preference for healthier alternatives. The market is expected to witness a CAGR of xx% during the forecast period (2025-2033), propelled by factors such as product innovation, expansion of online retail channels, and targeted marketing campaigns focusing on specific consumer segments. Technological disruptions, such as the rise of e-commerce and personalized product offerings, are reshaping the market landscape. Consumer behavior shifts, towards healthier options and more sustainable products, are creating both opportunities and challenges for established players. Market size evolution is expected to see a shift from traditional channels towards online platforms. Adoption rates of new technologies, like personalized recommendations and subscription boxes, are increasing.
Dominant Regions, Countries, or Segments in UK Confectionery Market
The supermarket/hypermarket channel remains the dominant distribution channel, accounting for xx% of the market in 2024, followed by convenience stores at xx%. The chocolate confectionery segment holds the largest market share, driven by strong consumer demand and continuous product innovation from major players. London and other major urban centers are key regional growth drivers. The growth is influenced by factors like high population density, strong consumer spending, and easy accessibility to various retail channels.
- Key Drivers: High population density in urban areas, strong consumer spending power, and extensive retail infrastructure.
- Dominance Factors: Established retail networks, preference for convenience, and wide product availability.
- Growth Potential: Expansion into smaller towns and cities, increasing penetration of online channels.
UK Confectionery Market Product Landscape
The UK confectionery market features a diverse range of products, including chocolate bars, candies, gums, and other confectionery items. Significant innovation focuses on healthier formulations with reduced sugar, natural ingredients, and functional benefits. Product differentiation is achieved through unique flavors, packaging designs, and brand storytelling. Performance metrics such as market share, sales volume, and consumer satisfaction are used to evaluate product success.
Key Drivers, Barriers & Challenges in UK Confectionery Market
Key Drivers:
- Growing disposable incomes and consumer spending.
- Increasing demand for premium and specialized confectionery products.
- Expanding online retail channels and e-commerce platforms.
Challenges and Restraints:
- Growing health concerns regarding sugar consumption leading to reduced demand for traditional confectionery.
- Increasing competition from healthier snack options.
- Fluctuating prices of raw materials and packaging impacting profitability.
- Supply chain disruptions due to geopolitical events or pandemics.
Emerging Opportunities in UK Confectionery Market
- Growing demand for vegan, gluten-free, and other specialized confectionery options.
- Increasing popularity of personalized and customized confectionery products.
- Growing trend towards premiumization and indulgence in the confectionery sector.
- Opportunities in emerging channels like subscription boxes and online gifting platforms.
Growth Accelerators in the UK Confectionery Market Industry
The UK confectionery market's growth will be accelerated by factors such as strategic partnerships, technological advancements in product formulation and packaging, and successful expansion into new market segments like online retail and personalized products. These will help companies differentiate their offerings and cater to evolving consumer demands.
Key Players Shaping the UK Confectionery Market Market
- Pimlico Confectioneries Ltd
- Nestlé SA
- Chocoladefabriken Lindt & Sprüngli AG
- Swizzels Matlow Ltd
- Polo del Gusto SRL
- August Storck KG
- Ferrero International SA
- Mars Incorporated
- Barry Callebaut AG
- Arcor S A I C
- HARIBO Holding GmbH & Co KG
- The Hershey Company
- Mondelēz International Inc
- Alfred Ritter GmbH & Co KG
- Confiserie Leonidas SA
Notable Milestones in UK Confectionery Market Sector
- March 2023: Nestlé launched new dual-flavored chocolate bars (Purple One and Green Triangle).
- April 2023: The Hershey Company launched a Peanut Butter & Jelly Flavored Protein Bar under the ONE brand.
- April 2023: Swizzels Sweets partnered with Applied Nutrition to launch sports nutrition products using Swizzels' flavors.
In-Depth UK Confectionery Market Market Outlook
The UK confectionery market holds significant future potential, driven by innovation in product formulations, expansion into new retail channels, and targeted marketing strategies catering to evolving consumer preferences. Strategic partnerships and investments in sustainable practices will further shape the market landscape. Opportunities exist in premiumization, healthier options, and specialized confectionery to cater to niche consumer groups. The market is poised for continued growth, albeit at a moderated pace compared to previous years, as consumers become more health-conscious while still seeking indulgent treats.
UK Confectionery Market Segmentation
-
1. Confections
-
1.1. Chocolate
-
1.1.1. By Confectionery Variant
- 1.1.1.1. Dark Chocolate
- 1.1.1.2. Milk and White Chocolate
-
1.1.1. By Confectionery Variant
-
1.2. Gums
- 1.2.1. Bubble Gum
-
1.2.2. Chewing Gum
-
1.2.2.1. By Sugar Content
- 1.2.2.1.1. Sugar Chewing Gum
- 1.2.2.1.2. Sugar-free Chewing Gum
-
1.2.2.1. By Sugar Content
-
1.3. Snack Bar
- 1.3.1. Cereal Bar
- 1.3.2. Fruit & Nut Bar
- 1.3.3. Protein Bar
-
1.4. Sugar Confectionery
- 1.4.1. Hard Candy
- 1.4.2. Lollipops
- 1.4.3. Mints
- 1.4.4. Pastilles, Gummies, and Jellies
- 1.4.5. Toffees and Nougats
- 1.4.6. Others
-
1.1. Chocolate
-
2. Distribution Channel
- 2.1. Convenience Store
- 2.2. Online Retail Store
- 2.3. Supermarket/Hypermarket
- 2.4. Others
UK Confectionery Market Segmentation By Geography
-
1. North America
- 1.1. United States
- 1.2. Canada
- 1.3. Mexico
-
2. South America
- 2.1. Brazil
- 2.2. Argentina
- 2.3. Rest of South America
-
3. Europe
- 3.1. United Kingdom
- 3.2. Germany
- 3.3. France
- 3.4. Italy
- 3.5. Spain
- 3.6. Russia
- 3.7. Benelux
- 3.8. Nordics
- 3.9. Rest of Europe
-
4. Middle East & Africa
- 4.1. Turkey
- 4.2. Israel
- 4.3. GCC
- 4.4. North Africa
- 4.5. South Africa
- 4.6. Rest of Middle East & Africa
-
5. Asia Pacific
- 5.1. China
- 5.2. India
- 5.3. Japan
- 5.4. South Korea
- 5.5. ASEAN
- 5.6. Oceania
- 5.7. Rest of Asia Pacific
UK Confectionery Market REPORT HIGHLIGHTS
| Aspects | Details |
|---|---|
| Study Period | 2019-2033 |
| Base Year | 2024 |
| Estimated Year | 2025 |
| Forecast Period | 2025-2033 |
| Historical Period | 2019-2024 |
| Growth Rate | CAGR of 4.20% from 2019-2033 |
| Segmentation |
|
Table of Contents
- 1. Introduction
- 1.1. Research Scope
- 1.2. Market Segmentation
- 1.3. Research Methodology
- 1.4. Definitions and Assumptions
- 2. Executive Summary
- 2.1. Introduction
- 3. Market Dynamics
- 3.1. Introduction
- 3.2. Market Drivers
- 3.2.1. Escalating Demand for Processed Poultry Products; Favorable Government Initiatives to Boost Production
- 3.3. Market Restrains
- 3.3.1. Rising Vegan Trend among Young Consumers; Deeper Penetration of Red Meat Across Saudi Arabia
- 3.4. Market Trends
- 3.4.1. OTHER KEY INDUSTRY TRENDS COVERED IN THE REPORT
- 4. Market Factor Analysis
- 4.1. Porters Five Forces
- 4.2. Supply/Value Chain
- 4.3. PESTEL analysis
- 4.4. Market Entropy
- 4.5. Patent/Trademark Analysis
- 5. Global UK Confectionery Market Analysis, Insights and Forecast, 2019-2031
- 5.1. Market Analysis, Insights and Forecast - by Confections
- 5.1.1. Chocolate
- 5.1.1.1. By Confectionery Variant
- 5.1.1.1.1. Dark Chocolate
- 5.1.1.1.2. Milk and White Chocolate
- 5.1.1.1. By Confectionery Variant
- 5.1.2. Gums
- 5.1.2.1. Bubble Gum
- 5.1.2.2. Chewing Gum
- 5.1.2.2.1. By Sugar Content
- 5.1.2.2.1.1. Sugar Chewing Gum
- 5.1.2.2.1.2. Sugar-free Chewing Gum
- 5.1.2.2.1. By Sugar Content
- 5.1.3. Snack Bar
- 5.1.3.1. Cereal Bar
- 5.1.3.2. Fruit & Nut Bar
- 5.1.3.3. Protein Bar
- 5.1.4. Sugar Confectionery
- 5.1.4.1. Hard Candy
- 5.1.4.2. Lollipops
- 5.1.4.3. Mints
- 5.1.4.4. Pastilles, Gummies, and Jellies
- 5.1.4.5. Toffees and Nougats
- 5.1.4.6. Others
- 5.1.1. Chocolate
- 5.2. Market Analysis, Insights and Forecast - by Distribution Channel
- 5.2.1. Convenience Store
- 5.2.2. Online Retail Store
- 5.2.3. Supermarket/Hypermarket
- 5.2.4. Others
- 5.3. Market Analysis, Insights and Forecast - by Region
- 5.3.1. North America
- 5.3.2. South America
- 5.3.3. Europe
- 5.3.4. Middle East & Africa
- 5.3.5. Asia Pacific
- 5.1. Market Analysis, Insights and Forecast - by Confections
- 6. North America UK Confectionery Market Analysis, Insights and Forecast, 2019-2031
- 6.1. Market Analysis, Insights and Forecast - by Confections
- 6.1.1. Chocolate
- 6.1.1.1. By Confectionery Variant
- 6.1.1.1.1. Dark Chocolate
- 6.1.1.1.2. Milk and White Chocolate
- 6.1.1.1. By Confectionery Variant
- 6.1.2. Gums
- 6.1.2.1. Bubble Gum
- 6.1.2.2. Chewing Gum
- 6.1.2.2.1. By Sugar Content
- 6.1.2.2.1.1. Sugar Chewing Gum
- 6.1.2.2.1.2. Sugar-free Chewing Gum
- 6.1.2.2.1. By Sugar Content
- 6.1.3. Snack Bar
- 6.1.3.1. Cereal Bar
- 6.1.3.2. Fruit & Nut Bar
- 6.1.3.3. Protein Bar
- 6.1.4. Sugar Confectionery
- 6.1.4.1. Hard Candy
- 6.1.4.2. Lollipops
- 6.1.4.3. Mints
- 6.1.4.4. Pastilles, Gummies, and Jellies
- 6.1.4.5. Toffees and Nougats
- 6.1.4.6. Others
- 6.1.1. Chocolate
- 6.2. Market Analysis, Insights and Forecast - by Distribution Channel
- 6.2.1. Convenience Store
- 6.2.2. Online Retail Store
- 6.2.3. Supermarket/Hypermarket
- 6.2.4. Others
- 6.1. Market Analysis, Insights and Forecast - by Confections
- 7. South America UK Confectionery Market Analysis, Insights and Forecast, 2019-2031
- 7.1. Market Analysis, Insights and Forecast - by Confections
- 7.1.1. Chocolate
- 7.1.1.1. By Confectionery Variant
- 7.1.1.1.1. Dark Chocolate
- 7.1.1.1.2. Milk and White Chocolate
- 7.1.1.1. By Confectionery Variant
- 7.1.2. Gums
- 7.1.2.1. Bubble Gum
- 7.1.2.2. Chewing Gum
- 7.1.2.2.1. By Sugar Content
- 7.1.2.2.1.1. Sugar Chewing Gum
- 7.1.2.2.1.2. Sugar-free Chewing Gum
- 7.1.2.2.1. By Sugar Content
- 7.1.3. Snack Bar
- 7.1.3.1. Cereal Bar
- 7.1.3.2. Fruit & Nut Bar
- 7.1.3.3. Protein Bar
- 7.1.4. Sugar Confectionery
- 7.1.4.1. Hard Candy
- 7.1.4.2. Lollipops
- 7.1.4.3. Mints
- 7.1.4.4. Pastilles, Gummies, and Jellies
- 7.1.4.5. Toffees and Nougats
- 7.1.4.6. Others
- 7.1.1. Chocolate
- 7.2. Market Analysis, Insights and Forecast - by Distribution Channel
- 7.2.1. Convenience Store
- 7.2.2. Online Retail Store
- 7.2.3. Supermarket/Hypermarket
- 7.2.4. Others
- 7.1. Market Analysis, Insights and Forecast - by Confections
- 8. Europe UK Confectionery Market Analysis, Insights and Forecast, 2019-2031
- 8.1. Market Analysis, Insights and Forecast - by Confections
- 8.1.1. Chocolate
- 8.1.1.1. By Confectionery Variant
- 8.1.1.1.1. Dark Chocolate
- 8.1.1.1.2. Milk and White Chocolate
- 8.1.1.1. By Confectionery Variant
- 8.1.2. Gums
- 8.1.2.1. Bubble Gum
- 8.1.2.2. Chewing Gum
- 8.1.2.2.1. By Sugar Content
- 8.1.2.2.1.1. Sugar Chewing Gum
- 8.1.2.2.1.2. Sugar-free Chewing Gum
- 8.1.2.2.1. By Sugar Content
- 8.1.3. Snack Bar
- 8.1.3.1. Cereal Bar
- 8.1.3.2. Fruit & Nut Bar
- 8.1.3.3. Protein Bar
- 8.1.4. Sugar Confectionery
- 8.1.4.1. Hard Candy
- 8.1.4.2. Lollipops
- 8.1.4.3. Mints
- 8.1.4.4. Pastilles, Gummies, and Jellies
- 8.1.4.5. Toffees and Nougats
- 8.1.4.6. Others
- 8.1.1. Chocolate
- 8.2. Market Analysis, Insights and Forecast - by Distribution Channel
- 8.2.1. Convenience Store
- 8.2.2. Online Retail Store
- 8.2.3. Supermarket/Hypermarket
- 8.2.4. Others
- 8.1. Market Analysis, Insights and Forecast - by Confections
- 9. Middle East & Africa UK Confectionery Market Analysis, Insights and Forecast, 2019-2031
- 9.1. Market Analysis, Insights and Forecast - by Confections
- 9.1.1. Chocolate
- 9.1.1.1. By Confectionery Variant
- 9.1.1.1.1. Dark Chocolate
- 9.1.1.1.2. Milk and White Chocolate
- 9.1.1.1. By Confectionery Variant
- 9.1.2. Gums
- 9.1.2.1. Bubble Gum
- 9.1.2.2. Chewing Gum
- 9.1.2.2.1. By Sugar Content
- 9.1.2.2.1.1. Sugar Chewing Gum
- 9.1.2.2.1.2. Sugar-free Chewing Gum
- 9.1.2.2.1. By Sugar Content
- 9.1.3. Snack Bar
- 9.1.3.1. Cereal Bar
- 9.1.3.2. Fruit & Nut Bar
- 9.1.3.3. Protein Bar
- 9.1.4. Sugar Confectionery
- 9.1.4.1. Hard Candy
- 9.1.4.2. Lollipops
- 9.1.4.3. Mints
- 9.1.4.4. Pastilles, Gummies, and Jellies
- 9.1.4.5. Toffees and Nougats
- 9.1.4.6. Others
- 9.1.1. Chocolate
- 9.2. Market Analysis, Insights and Forecast - by Distribution Channel
- 9.2.1. Convenience Store
- 9.2.2. Online Retail Store
- 9.2.3. Supermarket/Hypermarket
- 9.2.4. Others
- 9.1. Market Analysis, Insights and Forecast - by Confections
- 10. Asia Pacific UK Confectionery Market Analysis, Insights and Forecast, 2019-2031
- 10.1. Market Analysis, Insights and Forecast - by Confections
- 10.1.1. Chocolate
- 10.1.1.1. By Confectionery Variant
- 10.1.1.1.1. Dark Chocolate
- 10.1.1.1.2. Milk and White Chocolate
- 10.1.1.1. By Confectionery Variant
- 10.1.2. Gums
- 10.1.2.1. Bubble Gum
- 10.1.2.2. Chewing Gum
- 10.1.2.2.1. By Sugar Content
- 10.1.2.2.1.1. Sugar Chewing Gum
- 10.1.2.2.1.2. Sugar-free Chewing Gum
- 10.1.2.2.1. By Sugar Content
- 10.1.3. Snack Bar
- 10.1.3.1. Cereal Bar
- 10.1.3.2. Fruit & Nut Bar
- 10.1.3.3. Protein Bar
- 10.1.4. Sugar Confectionery
- 10.1.4.1. Hard Candy
- 10.1.4.2. Lollipops
- 10.1.4.3. Mints
- 10.1.4.4. Pastilles, Gummies, and Jellies
- 10.1.4.5. Toffees and Nougats
- 10.1.4.6. Others
- 10.1.1. Chocolate
- 10.2. Market Analysis, Insights and Forecast - by Distribution Channel
- 10.2.1. Convenience Store
- 10.2.2. Online Retail Store
- 10.2.3. Supermarket/Hypermarket
- 10.2.4. Others
- 10.1. Market Analysis, Insights and Forecast - by Confections
- 11. England UK Confectionery Market Analysis, Insights and Forecast, 2019-2031
- 12. Wales UK Confectionery Market Analysis, Insights and Forecast, 2019-2031
- 13. Scotland UK Confectionery Market Analysis, Insights and Forecast, 2019-2031
- 14. Northern UK Confectionery Market Analysis, Insights and Forecast, 2019-2031
- 15. Ireland UK Confectionery Market Analysis, Insights and Forecast, 2019-2031
- 16. Competitive Analysis
- 16.1. Global Market Share Analysis 2024
- 16.2. Company Profiles
- 16.2.1 Pimlico Confectioneries Ltd
- 16.2.1.1. Overview
- 16.2.1.2. Products
- 16.2.1.3. SWOT Analysis
- 16.2.1.4. Recent Developments
- 16.2.1.5. Financials (Based on Availability)
- 16.2.2 Nestlé SA
- 16.2.2.1. Overview
- 16.2.2.2. Products
- 16.2.2.3. SWOT Analysis
- 16.2.2.4. Recent Developments
- 16.2.2.5. Financials (Based on Availability)
- 16.2.3 Chocoladefabriken Lindt & Sprüngli AG
- 16.2.3.1. Overview
- 16.2.3.2. Products
- 16.2.3.3. SWOT Analysis
- 16.2.3.4. Recent Developments
- 16.2.3.5. Financials (Based on Availability)
- 16.2.4 Swizzels Matlow Ltd
- 16.2.4.1. Overview
- 16.2.4.2. Products
- 16.2.4.3. SWOT Analysis
- 16.2.4.4. Recent Developments
- 16.2.4.5. Financials (Based on Availability)
- 16.2.5 Polo del Gusto SRL
- 16.2.5.1. Overview
- 16.2.5.2. Products
- 16.2.5.3. SWOT Analysis
- 16.2.5.4. Recent Developments
- 16.2.5.5. Financials (Based on Availability)
- 16.2.6 August Storck KG
- 16.2.6.1. Overview
- 16.2.6.2. Products
- 16.2.6.3. SWOT Analysis
- 16.2.6.4. Recent Developments
- 16.2.6.5. Financials (Based on Availability)
- 16.2.7 Ferrero International SA
- 16.2.7.1. Overview
- 16.2.7.2. Products
- 16.2.7.3. SWOT Analysis
- 16.2.7.4. Recent Developments
- 16.2.7.5. Financials (Based on Availability)
- 16.2.8 Mars Incorporated
- 16.2.8.1. Overview
- 16.2.8.2. Products
- 16.2.8.3. SWOT Analysis
- 16.2.8.4. Recent Developments
- 16.2.8.5. Financials (Based on Availability)
- 16.2.9 Barry Callebaut AG
- 16.2.9.1. Overview
- 16.2.9.2. Products
- 16.2.9.3. SWOT Analysis
- 16.2.9.4. Recent Developments
- 16.2.9.5. Financials (Based on Availability)
- 16.2.10 Arcor S A I C
- 16.2.10.1. Overview
- 16.2.10.2. Products
- 16.2.10.3. SWOT Analysis
- 16.2.10.4. Recent Developments
- 16.2.10.5. Financials (Based on Availability)
- 16.2.11 HARIBO Holding GmbH & Co KG
- 16.2.11.1. Overview
- 16.2.11.2. Products
- 16.2.11.3. SWOT Analysis
- 16.2.11.4. Recent Developments
- 16.2.11.5. Financials (Based on Availability)
- 16.2.12 The Hershey Compan
- 16.2.12.1. Overview
- 16.2.12.2. Products
- 16.2.12.3. SWOT Analysis
- 16.2.12.4. Recent Developments
- 16.2.12.5. Financials (Based on Availability)
- 16.2.13 Mondelēz International Inc
- 16.2.13.1. Overview
- 16.2.13.2. Products
- 16.2.13.3. SWOT Analysis
- 16.2.13.4. Recent Developments
- 16.2.13.5. Financials (Based on Availability)
- 16.2.14 Alfred Ritter GmbH & Co KG
- 16.2.14.1. Overview
- 16.2.14.2. Products
- 16.2.14.3. SWOT Analysis
- 16.2.14.4. Recent Developments
- 16.2.14.5. Financials (Based on Availability)
- 16.2.15 Confiserie Leonidas SA
- 16.2.15.1. Overview
- 16.2.15.2. Products
- 16.2.15.3. SWOT Analysis
- 16.2.15.4. Recent Developments
- 16.2.15.5. Financials (Based on Availability)
- 16.2.1 Pimlico Confectioneries Ltd
List of Figures
- Figure 1: Global UK Confectionery Market Revenue Breakdown (Million, %) by Region 2024 & 2032
- Figure 2: Global UK Confectionery Market Volume Breakdown (K Tons, %) by Region 2024 & 2032
- Figure 3: United kingdom Region UK Confectionery Market Revenue (Million), by Country 2024 & 2032
- Figure 4: United kingdom Region UK Confectionery Market Volume (K Tons), by Country 2024 & 2032
- Figure 5: United kingdom Region UK Confectionery Market Revenue Share (%), by Country 2024 & 2032
- Figure 6: United kingdom Region UK Confectionery Market Volume Share (%), by Country 2024 & 2032
- Figure 7: North America UK Confectionery Market Revenue (Million), by Confections 2024 & 2032
- Figure 8: North America UK Confectionery Market Volume (K Tons), by Confections 2024 & 2032
- Figure 9: North America UK Confectionery Market Revenue Share (%), by Confections 2024 & 2032
- Figure 10: North America UK Confectionery Market Volume Share (%), by Confections 2024 & 2032
- Figure 11: North America UK Confectionery Market Revenue (Million), by Distribution Channel 2024 & 2032
- Figure 12: North America UK Confectionery Market Volume (K Tons), by Distribution Channel 2024 & 2032
- Figure 13: North America UK Confectionery Market Revenue Share (%), by Distribution Channel 2024 & 2032
- Figure 14: North America UK Confectionery Market Volume Share (%), by Distribution Channel 2024 & 2032
- Figure 15: North America UK Confectionery Market Revenue (Million), by Country 2024 & 2032
- Figure 16: North America UK Confectionery Market Volume (K Tons), by Country 2024 & 2032
- Figure 17: North America UK Confectionery Market Revenue Share (%), by Country 2024 & 2032
- Figure 18: North America UK Confectionery Market Volume Share (%), by Country 2024 & 2032
- Figure 19: South America UK Confectionery Market Revenue (Million), by Confections 2024 & 2032
- Figure 20: South America UK Confectionery Market Volume (K Tons), by Confections 2024 & 2032
- Figure 21: South America UK Confectionery Market Revenue Share (%), by Confections 2024 & 2032
- Figure 22: South America UK Confectionery Market Volume Share (%), by Confections 2024 & 2032
- Figure 23: South America UK Confectionery Market Revenue (Million), by Distribution Channel 2024 & 2032
- Figure 24: South America UK Confectionery Market Volume (K Tons), by Distribution Channel 2024 & 2032
- Figure 25: South America UK Confectionery Market Revenue Share (%), by Distribution Channel 2024 & 2032
- Figure 26: South America UK Confectionery Market Volume Share (%), by Distribution Channel 2024 & 2032
- Figure 27: South America UK Confectionery Market Revenue (Million), by Country 2024 & 2032
- Figure 28: South America UK Confectionery Market Volume (K Tons), by Country 2024 & 2032
- Figure 29: South America UK Confectionery Market Revenue Share (%), by Country 2024 & 2032
- Figure 30: South America UK Confectionery Market Volume Share (%), by Country 2024 & 2032
- Figure 31: Europe UK Confectionery Market Revenue (Million), by Confections 2024 & 2032
- Figure 32: Europe UK Confectionery Market Volume (K Tons), by Confections 2024 & 2032
- Figure 33: Europe UK Confectionery Market Revenue Share (%), by Confections 2024 & 2032
- Figure 34: Europe UK Confectionery Market Volume Share (%), by Confections 2024 & 2032
- Figure 35: Europe UK Confectionery Market Revenue (Million), by Distribution Channel 2024 & 2032
- Figure 36: Europe UK Confectionery Market Volume (K Tons), by Distribution Channel 2024 & 2032
- Figure 37: Europe UK Confectionery Market Revenue Share (%), by Distribution Channel 2024 & 2032
- Figure 38: Europe UK Confectionery Market Volume Share (%), by Distribution Channel 2024 & 2032
- Figure 39: Europe UK Confectionery Market Revenue (Million), by Country 2024 & 2032
- Figure 40: Europe UK Confectionery Market Volume (K Tons), by Country 2024 & 2032
- Figure 41: Europe UK Confectionery Market Revenue Share (%), by Country 2024 & 2032
- Figure 42: Europe UK Confectionery Market Volume Share (%), by Country 2024 & 2032
- Figure 43: Middle East & Africa UK Confectionery Market Revenue (Million), by Confections 2024 & 2032
- Figure 44: Middle East & Africa UK Confectionery Market Volume (K Tons), by Confections 2024 & 2032
- Figure 45: Middle East & Africa UK Confectionery Market Revenue Share (%), by Confections 2024 & 2032
- Figure 46: Middle East & Africa UK Confectionery Market Volume Share (%), by Confections 2024 & 2032
- Figure 47: Middle East & Africa UK Confectionery Market Revenue (Million), by Distribution Channel 2024 & 2032
- Figure 48: Middle East & Africa UK Confectionery Market Volume (K Tons), by Distribution Channel 2024 & 2032
- Figure 49: Middle East & Africa UK Confectionery Market Revenue Share (%), by Distribution Channel 2024 & 2032
- Figure 50: Middle East & Africa UK Confectionery Market Volume Share (%), by Distribution Channel 2024 & 2032
- Figure 51: Middle East & Africa UK Confectionery Market Revenue (Million), by Country 2024 & 2032
- Figure 52: Middle East & Africa UK Confectionery Market Volume (K Tons), by Country 2024 & 2032
- Figure 53: Middle East & Africa UK Confectionery Market Revenue Share (%), by Country 2024 & 2032
- Figure 54: Middle East & Africa UK Confectionery Market Volume Share (%), by Country 2024 & 2032
- Figure 55: Asia Pacific UK Confectionery Market Revenue (Million), by Confections 2024 & 2032
- Figure 56: Asia Pacific UK Confectionery Market Volume (K Tons), by Confections 2024 & 2032
- Figure 57: Asia Pacific UK Confectionery Market Revenue Share (%), by Confections 2024 & 2032
- Figure 58: Asia Pacific UK Confectionery Market Volume Share (%), by Confections 2024 & 2032
- Figure 59: Asia Pacific UK Confectionery Market Revenue (Million), by Distribution Channel 2024 & 2032
- Figure 60: Asia Pacific UK Confectionery Market Volume (K Tons), by Distribution Channel 2024 & 2032
- Figure 61: Asia Pacific UK Confectionery Market Revenue Share (%), by Distribution Channel 2024 & 2032
- Figure 62: Asia Pacific UK Confectionery Market Volume Share (%), by Distribution Channel 2024 & 2032
- Figure 63: Asia Pacific UK Confectionery Market Revenue (Million), by Country 2024 & 2032
- Figure 64: Asia Pacific UK Confectionery Market Volume (K Tons), by Country 2024 & 2032
- Figure 65: Asia Pacific UK Confectionery Market Revenue Share (%), by Country 2024 & 2032
- Figure 66: Asia Pacific UK Confectionery Market Volume Share (%), by Country 2024 & 2032
List of Tables
- Table 1: Global UK Confectionery Market Revenue Million Forecast, by Region 2019 & 2032
- Table 2: Global UK Confectionery Market Volume K Tons Forecast, by Region 2019 & 2032
- Table 3: Global UK Confectionery Market Revenue Million Forecast, by Confections 2019 & 2032
- Table 4: Global UK Confectionery Market Volume K Tons Forecast, by Confections 2019 & 2032
- Table 5: Global UK Confectionery Market Revenue Million Forecast, by Distribution Channel 2019 & 2032
- Table 6: Global UK Confectionery Market Volume K Tons Forecast, by Distribution Channel 2019 & 2032
- Table 7: Global UK Confectionery Market Revenue Million Forecast, by Region 2019 & 2032
- Table 8: Global UK Confectionery Market Volume K Tons Forecast, by Region 2019 & 2032
- Table 9: Global UK Confectionery Market Revenue Million Forecast, by Country 2019 & 2032
- Table 10: Global UK Confectionery Market Volume K Tons Forecast, by Country 2019 & 2032
- Table 11: England UK Confectionery Market Revenue (Million) Forecast, by Application 2019 & 2032
- Table 12: England UK Confectionery Market Volume (K Tons) Forecast, by Application 2019 & 2032
- Table 13: Wales UK Confectionery Market Revenue (Million) Forecast, by Application 2019 & 2032
- Table 14: Wales UK Confectionery Market Volume (K Tons) Forecast, by Application 2019 & 2032
- Table 15: Scotland UK Confectionery Market Revenue (Million) Forecast, by Application 2019 & 2032
- Table 16: Scotland UK Confectionery Market Volume (K Tons) Forecast, by Application 2019 & 2032
- Table 17: Northern UK Confectionery Market Revenue (Million) Forecast, by Application 2019 & 2032
- Table 18: Northern UK Confectionery Market Volume (K Tons) Forecast, by Application 2019 & 2032
- Table 19: Ireland UK Confectionery Market Revenue (Million) Forecast, by Application 2019 & 2032
- Table 20: Ireland UK Confectionery Market Volume (K Tons) Forecast, by Application 2019 & 2032
- Table 21: Global UK Confectionery Market Revenue Million Forecast, by Confections 2019 & 2032
- Table 22: Global UK Confectionery Market Volume K Tons Forecast, by Confections 2019 & 2032
- Table 23: Global UK Confectionery Market Revenue Million Forecast, by Distribution Channel 2019 & 2032
- Table 24: Global UK Confectionery Market Volume K Tons Forecast, by Distribution Channel 2019 & 2032
- Table 25: Global UK Confectionery Market Revenue Million Forecast, by Country 2019 & 2032
- Table 26: Global UK Confectionery Market Volume K Tons Forecast, by Country 2019 & 2032
- Table 27: United States UK Confectionery Market Revenue (Million) Forecast, by Application 2019 & 2032
- Table 28: United States UK Confectionery Market Volume (K Tons) Forecast, by Application 2019 & 2032
- Table 29: Canada UK Confectionery Market Revenue (Million) Forecast, by Application 2019 & 2032
- Table 30: Canada UK Confectionery Market Volume (K Tons) Forecast, by Application 2019 & 2032
- Table 31: Mexico UK Confectionery Market Revenue (Million) Forecast, by Application 2019 & 2032
- Table 32: Mexico UK Confectionery Market Volume (K Tons) Forecast, by Application 2019 & 2032
- Table 33: Global UK Confectionery Market Revenue Million Forecast, by Confections 2019 & 2032
- Table 34: Global UK Confectionery Market Volume K Tons Forecast, by Confections 2019 & 2032
- Table 35: Global UK Confectionery Market Revenue Million Forecast, by Distribution Channel 2019 & 2032
- Table 36: Global UK Confectionery Market Volume K Tons Forecast, by Distribution Channel 2019 & 2032
- Table 37: Global UK Confectionery Market Revenue Million Forecast, by Country 2019 & 2032
- Table 38: Global UK Confectionery Market Volume K Tons Forecast, by Country 2019 & 2032
- Table 39: Brazil UK Confectionery Market Revenue (Million) Forecast, by Application 2019 & 2032
- Table 40: Brazil UK Confectionery Market Volume (K Tons) Forecast, by Application 2019 & 2032
- Table 41: Argentina UK Confectionery Market Revenue (Million) Forecast, by Application 2019 & 2032
- Table 42: Argentina UK Confectionery Market Volume (K Tons) Forecast, by Application 2019 & 2032
- Table 43: Rest of South America UK Confectionery Market Revenue (Million) Forecast, by Application 2019 & 2032
- Table 44: Rest of South America UK Confectionery Market Volume (K Tons) Forecast, by Application 2019 & 2032
- Table 45: Global UK Confectionery Market Revenue Million Forecast, by Confections 2019 & 2032
- Table 46: Global UK Confectionery Market Volume K Tons Forecast, by Confections 2019 & 2032
- Table 47: Global UK Confectionery Market Revenue Million Forecast, by Distribution Channel 2019 & 2032
- Table 48: Global UK Confectionery Market Volume K Tons Forecast, by Distribution Channel 2019 & 2032
- Table 49: Global UK Confectionery Market Revenue Million Forecast, by Country 2019 & 2032
- Table 50: Global UK Confectionery Market Volume K Tons Forecast, by Country 2019 & 2032
- Table 51: United Kingdom UK Confectionery Market Revenue (Million) Forecast, by Application 2019 & 2032
- Table 52: United Kingdom UK Confectionery Market Volume (K Tons) Forecast, by Application 2019 & 2032
- Table 53: Germany UK Confectionery Market Revenue (Million) Forecast, by Application 2019 & 2032
- Table 54: Germany UK Confectionery Market Volume (K Tons) Forecast, by Application 2019 & 2032
- Table 55: France UK Confectionery Market Revenue (Million) Forecast, by Application 2019 & 2032
- Table 56: France UK Confectionery Market Volume (K Tons) Forecast, by Application 2019 & 2032
- Table 57: Italy UK Confectionery Market Revenue (Million) Forecast, by Application 2019 & 2032
- Table 58: Italy UK Confectionery Market Volume (K Tons) Forecast, by Application 2019 & 2032
- Table 59: Spain UK Confectionery Market Revenue (Million) Forecast, by Application 2019 & 2032
- Table 60: Spain UK Confectionery Market Volume (K Tons) Forecast, by Application 2019 & 2032
- Table 61: Russia UK Confectionery Market Revenue (Million) Forecast, by Application 2019 & 2032
- Table 62: Russia UK Confectionery Market Volume (K Tons) Forecast, by Application 2019 & 2032
- Table 63: Benelux UK Confectionery Market Revenue (Million) Forecast, by Application 2019 & 2032
- Table 64: Benelux UK Confectionery Market Volume (K Tons) Forecast, by Application 2019 & 2032
- Table 65: Nordics UK Confectionery Market Revenue (Million) Forecast, by Application 2019 & 2032
- Table 66: Nordics UK Confectionery Market Volume (K Tons) Forecast, by Application 2019 & 2032
- Table 67: Rest of Europe UK Confectionery Market Revenue (Million) Forecast, by Application 2019 & 2032
- Table 68: Rest of Europe UK Confectionery Market Volume (K Tons) Forecast, by Application 2019 & 2032
- Table 69: Global UK Confectionery Market Revenue Million Forecast, by Confections 2019 & 2032
- Table 70: Global UK Confectionery Market Volume K Tons Forecast, by Confections 2019 & 2032
- Table 71: Global UK Confectionery Market Revenue Million Forecast, by Distribution Channel 2019 & 2032
- Table 72: Global UK Confectionery Market Volume K Tons Forecast, by Distribution Channel 2019 & 2032
- Table 73: Global UK Confectionery Market Revenue Million Forecast, by Country 2019 & 2032
- Table 74: Global UK Confectionery Market Volume K Tons Forecast, by Country 2019 & 2032
- Table 75: Turkey UK Confectionery Market Revenue (Million) Forecast, by Application 2019 & 2032
- Table 76: Turkey UK Confectionery Market Volume (K Tons) Forecast, by Application 2019 & 2032
- Table 77: Israel UK Confectionery Market Revenue (Million) Forecast, by Application 2019 & 2032
- Table 78: Israel UK Confectionery Market Volume (K Tons) Forecast, by Application 2019 & 2032
- Table 79: GCC UK Confectionery Market Revenue (Million) Forecast, by Application 2019 & 2032
- Table 80: GCC UK Confectionery Market Volume (K Tons) Forecast, by Application 2019 & 2032
- Table 81: North Africa UK Confectionery Market Revenue (Million) Forecast, by Application 2019 & 2032
- Table 82: North Africa UK Confectionery Market Volume (K Tons) Forecast, by Application 2019 & 2032
- Table 83: South Africa UK Confectionery Market Revenue (Million) Forecast, by Application 2019 & 2032
- Table 84: South Africa UK Confectionery Market Volume (K Tons) Forecast, by Application 2019 & 2032
- Table 85: Rest of Middle East & Africa UK Confectionery Market Revenue (Million) Forecast, by Application 2019 & 2032
- Table 86: Rest of Middle East & Africa UK Confectionery Market Volume (K Tons) Forecast, by Application 2019 & 2032
- Table 87: Global UK Confectionery Market Revenue Million Forecast, by Confections 2019 & 2032
- Table 88: Global UK Confectionery Market Volume K Tons Forecast, by Confections 2019 & 2032
- Table 89: Global UK Confectionery Market Revenue Million Forecast, by Distribution Channel 2019 & 2032
- Table 90: Global UK Confectionery Market Volume K Tons Forecast, by Distribution Channel 2019 & 2032
- Table 91: Global UK Confectionery Market Revenue Million Forecast, by Country 2019 & 2032
- Table 92: Global UK Confectionery Market Volume K Tons Forecast, by Country 2019 & 2032
- Table 93: China UK Confectionery Market Revenue (Million) Forecast, by Application 2019 & 2032
- Table 94: China UK Confectionery Market Volume (K Tons) Forecast, by Application 2019 & 2032
- Table 95: India UK Confectionery Market Revenue (Million) Forecast, by Application 2019 & 2032
- Table 96: India UK Confectionery Market Volume (K Tons) Forecast, by Application 2019 & 2032
- Table 97: Japan UK Confectionery Market Revenue (Million) Forecast, by Application 2019 & 2032
- Table 98: Japan UK Confectionery Market Volume (K Tons) Forecast, by Application 2019 & 2032
- Table 99: South Korea UK Confectionery Market Revenue (Million) Forecast, by Application 2019 & 2032
- Table 100: South Korea UK Confectionery Market Volume (K Tons) Forecast, by Application 2019 & 2032
- Table 101: ASEAN UK Confectionery Market Revenue (Million) Forecast, by Application 2019 & 2032
- Table 102: ASEAN UK Confectionery Market Volume (K Tons) Forecast, by Application 2019 & 2032
- Table 103: Oceania UK Confectionery Market Revenue (Million) Forecast, by Application 2019 & 2032
- Table 104: Oceania UK Confectionery Market Volume (K Tons) Forecast, by Application 2019 & 2032
- Table 105: Rest of Asia Pacific UK Confectionery Market Revenue (Million) Forecast, by Application 2019 & 2032
- Table 106: Rest of Asia Pacific UK Confectionery Market Volume (K Tons) Forecast, by Application 2019 & 2032
Frequently Asked Questions
1. What is the projected Compound Annual Growth Rate (CAGR) of the UK Confectionery Market?
The projected CAGR is approximately 4.20%.
2. Which companies are prominent players in the UK Confectionery Market?
Key companies in the market include Pimlico Confectioneries Ltd, Nestlé SA, Chocoladefabriken Lindt & Sprüngli AG, Swizzels Matlow Ltd, Polo del Gusto SRL, August Storck KG, Ferrero International SA, Mars Incorporated, Barry Callebaut AG, Arcor S A I C, HARIBO Holding GmbH & Co KG, The Hershey Compan, Mondelēz International Inc, Alfred Ritter GmbH & Co KG, Confiserie Leonidas SA.
3. What are the main segments of the UK Confectionery Market?
The market segments include Confections, Distribution Channel.
4. Can you provide details about the market size?
The market size is estimated to be USD 11,759.5 Million as of 2022.
5. What are some drivers contributing to market growth?
Escalating Demand for Processed Poultry Products; Favorable Government Initiatives to Boost Production.
6. What are the notable trends driving market growth?
OTHER KEY INDUSTRY TRENDS COVERED IN THE REPORT.
7. Are there any restraints impacting market growth?
Rising Vegan Trend among Young Consumers; Deeper Penetration of Red Meat Across Saudi Arabia.
8. Can you provide examples of recent developments in the market?
April 2023: Swizzels Sweets has partnered with Applied Nutrition to launch a range of sports nutrition products in several of Swizzels’ well-known flavors. The sports brand Applied Nutrition announced Drumstick flavor lollies of both its bestselling hydration drink, BodyFuel, and a 60 ml shot variant of its popular pre-workout, A.B.E.April 2023: Under the ONE brand, The Hershey Company launched the Peanut Butter & Jelly Flavored Protein Bar. The ONE Limited Edition Peanut Butter & Jelly flavored bars are packed with 20 g of protein, 1 g of sugar, and the familiar taste of peanut butter and strawberry jelly flavors.March 2023: Nestlé launched a new chocolate bar fused with two flavors, i.e., the Purple One and Green Triangle. These chocolate bars are available in supermarkets across the United Kingdom.
9. What pricing options are available for accessing the report?
Pricing options include single-user, multi-user, and enterprise licenses priced at USD 3800, USD 4500, and USD 5800 respectively.
10. Is the market size provided in terms of value or volume?
The market size is provided in terms of value, measured in Million and volume, measured in K Tons.
11. Are there any specific market keywords associated with the report?
Yes, the market keyword associated with the report is "UK Confectionery Market," which aids in identifying and referencing the specific market segment covered.
12. How do I determine which pricing option suits my needs best?
The pricing options vary based on user requirements and access needs. Individual users may opt for single-user licenses, while businesses requiring broader access may choose multi-user or enterprise licenses for cost-effective access to the report.
13. Are there any additional resources or data provided in the UK Confectionery Market report?
While the report offers comprehensive insights, it's advisable to review the specific contents or supplementary materials provided to ascertain if additional resources or data are available.
14. How can I stay updated on further developments or reports in the UK Confectionery Market?
To stay informed about further developments, trends, and reports in the UK Confectionery Market, consider subscribing to industry newsletters, following relevant companies and organizations, or regularly checking reputable industry news sources and publications.
Methodology
Step 1 - Identification of Relevant Samples Size from Population Database


Step 2 - Approaches for Defining Global Market Size (Value, Volume* & Price*)

Note*: In applicable scenarios
Step 3 - Data Sources
Primary Research
- Web Analytics
- Survey Reports
- Research Institute
- Latest Research Reports
- Opinion Leaders
Secondary Research
- Annual Reports
- White Paper
- Latest Press Release
- Industry Association
- Paid Database
- Investor Presentations

Step 4 - Data Triangulation
Involves using different sources of information in order to increase the validity of a study
These sources are likely to be stakeholders in a program - participants, other researchers, program staff, other community members, and so on.
Then we put all data in single framework & apply various statistical tools to find out the dynamic on the market.
During the analysis stage, feedback from the stakeholder groups would be compared to determine areas of agreement as well as areas of divergence
