

Key Insights
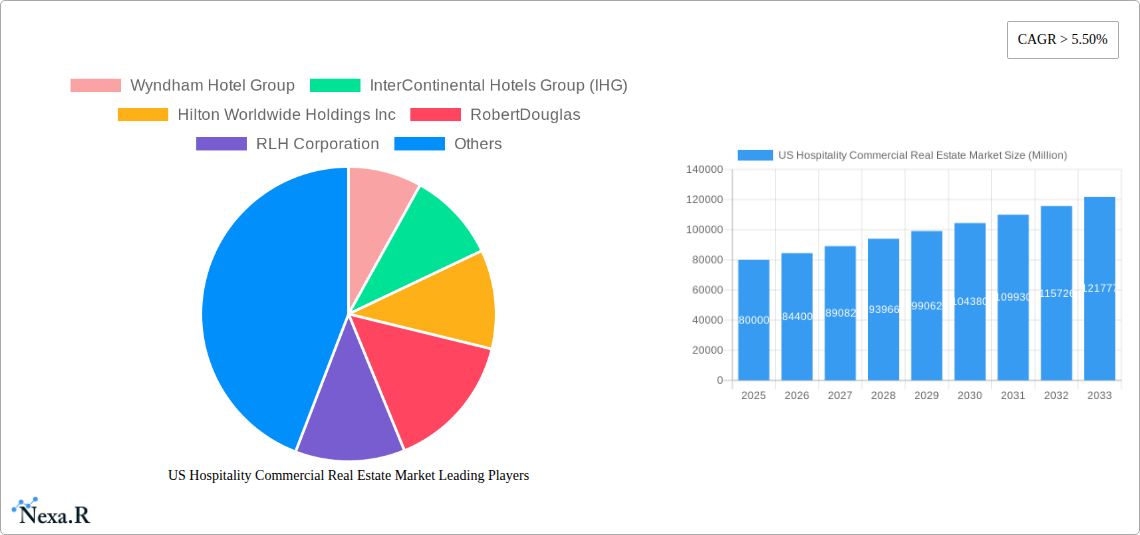
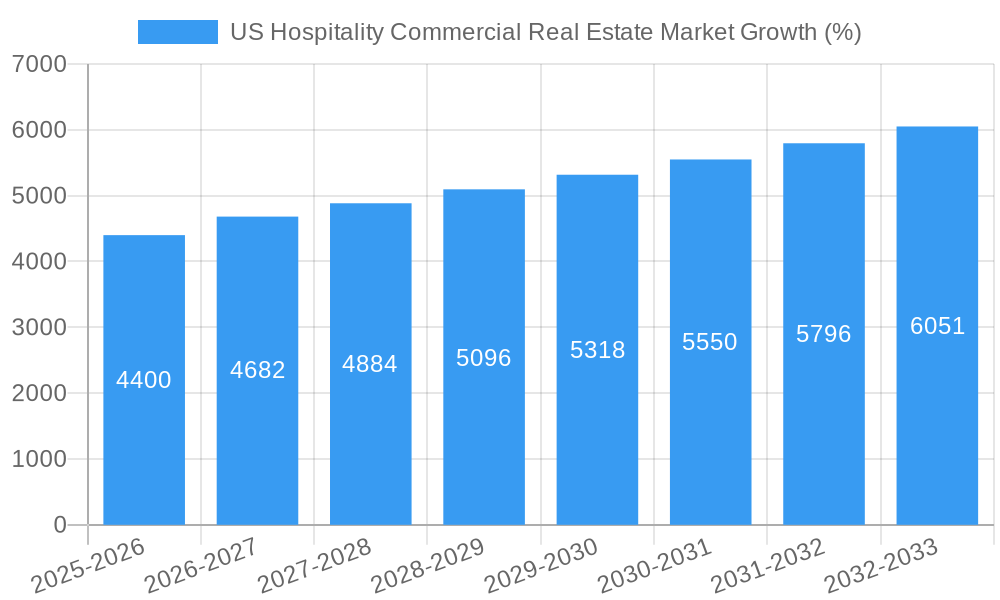
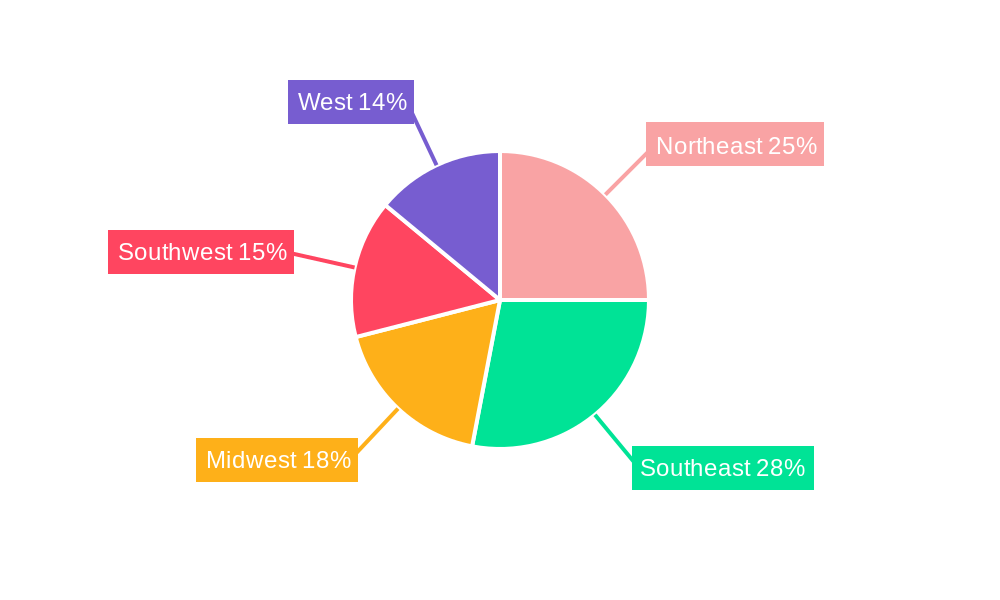
The US hospitality commercial real estate market is experiencing robust growth, projected to maintain a CAGR exceeding 5.5% from 2025 to 2033. This expansion is fueled by several key factors. Increased domestic and international tourism, coupled with a rising affluent middle class with greater disposable income for leisure travel and experiences, significantly boosts demand for hotel accommodations, resorts, and spas. Furthermore, the ongoing trend of experiential travel, where consumers prioritize unique and memorable experiences over simply lodging, is driving investment in high-end properties and unique hospitality offerings. The market is segmented by property type, with hotels and accommodations holding the largest share, followed by spas and resorts and other property types like vacation rentals and extended-stay hotels. Key players like Wyndham, IHG, Hilton, and Marriott International are strategically expanding their portfolios and optimizing operations to capitalize on this growth. However, challenges remain, including potential economic downturns impacting consumer spending and the ongoing impact of inflation on construction and operational costs. The market's regional performance varies, with strong growth projected across all regions – Northeast, Southeast, Midwest, Southwest, and West – though specific growth rates may differ based on local economic conditions and tourism patterns. Competition is intensifying, with established players facing pressure from smaller boutique hotels and innovative hospitality ventures. Future growth will depend on successful adaptation to changing consumer preferences, effective management of operational costs, and strategic investments in sustainable and technologically advanced properties.
The competitive landscape is characterized by a mix of large multinational corporations and smaller, regional players. The larger companies benefit from brand recognition, extensive distribution networks, and economies of scale, allowing them to effectively manage operations and navigate economic fluctuations. Smaller companies, conversely, are often more agile and responsive to localized market demands, catering to niche segments and providing unique experiences to compete successfully. The ongoing trend of mergers and acquisitions further shapes the market dynamics, with larger players actively consolidating their market share and expanding their presence across various segments. Technological advancements, such as the increasing use of property management systems, online booking platforms, and data analytics, significantly impact operational efficiency and customer experience. The industry's future growth hinges on embracing innovation, maintaining high service standards, and providing travelers with memorable and personalized experiences.
US Hospitality Commercial Real Estate Market: A Comprehensive Report (2019-2033)
This comprehensive report provides an in-depth analysis of the US Hospitality Commercial Real Estate Market, offering invaluable insights for investors, developers, and industry professionals. We examine market dynamics, growth trends, key players, and emerging opportunities across various segments, including Hotels and Accommodation, Spas and Resorts, and Other Property Types. The report covers the period from 2019 to 2033, with a focus on the base year 2025 and a forecast period extending to 2033.
US Hospitality Commercial Real Estate Market Dynamics & Structure
This section analyzes the market's competitive landscape, technological advancements, regulatory environment, and M&A activity. The US hospitality commercial real estate market is characterized by a dynamic interplay of established players and emerging disruptors. Market concentration is moderately high, with a handful of major players holding significant market share. However, the market also features a large number of smaller independent operators, especially within specific niches like boutique hotels or specialized resorts.
- Market Concentration: The top 5 players command approximately xx% of the market share in 2025 (estimated). Consolidation through mergers and acquisitions (M&A) continues to shape the landscape.
- M&A Activity: The historical period (2019-2024) witnessed xx M&A deals, totaling an estimated value of $xx million. The forecast period is expected to see a rise in M&A activity, driven by expansion strategies and portfolio diversification.
- Technological Innovation: Technological advancements such as revenue management systems, online booking platforms, and smart hotel technologies are driving efficiency and enhancing guest experiences. However, barriers to entry, including high initial investment costs and integration complexities, limit widespread adoption among smaller operators.
- Regulatory Frameworks: Local, state, and federal regulations significantly impact development, operations, and financing. Compliance requirements, zoning laws, and environmental regulations pose both challenges and opportunities for market participants.
- Competitive Product Substitutes: The rise of alternative accommodations (e.g., Airbnb, VRBO) presents a competitive challenge, forcing traditional hospitality operators to adapt their offerings and pricing strategies.
- End-User Demographics: Shifting demographics and travel preferences are shaping demand. Millennial and Gen Z travelers are driving demand for unique experiences and sustainable tourism practices.
US Hospitality Commercial Real Estate Market Growth Trends & Insights
The US Hospitality Commercial Real Estate Market experienced significant growth in the historical period (2019-2024), impacted by factors such as economic conditions, tourism trends, and technological advancements. Market size grew from $xx million in 2019 to an estimated $xx million in 2024, representing a CAGR of xx%. The forecast period (2025-2033) is projected to see continued growth, driven by factors such as increasing disposable income, rising tourism numbers, and expansion of the hospitality sector. Technological disruptions, such as AI-powered personalization and contactless check-in, are enhancing guest experiences and improving operational efficiencies. Consumer behavior shifts towards experiential travel and sustainable options are also impacting the market. However, macroeconomic uncertainties and potential economic downturns could influence the growth trajectory. Market penetration of technology-driven services is expected to increase, with a projected penetration rate of xx% by 2033.
Dominant Regions, Countries, or Segments in US Hospitality Commercial Real Estate Market
The Hotels and Accommodation segment dominates the US hospitality commercial real estate market, accounting for the largest share of market revenue and exhibiting the highest growth potential. Key drivers include the robust tourism sector, increasing business travel, and the continuous development of new hotels and accommodation facilities across major metropolitan areas and popular tourist destinations.
- Key Drivers for Hotels and Accommodation:
- Strong domestic and international tourism.
- Growth in business travel.
- Increasing demand for diverse accommodation types (budget hotels, luxury resorts, boutique hotels).
- Development of new infrastructure and transportation networks.
- Favorable economic policies and investment incentives.
- Regional Dominance: Major metropolitan areas like New York City, Los Angeles, Las Vegas, and Orlando consistently demonstrate high occupancy rates and strong revenue generation, contributing significantly to the market's overall dominance.
US Hospitality Commercial Real Estate Market Product Landscape
The product landscape is diverse, ranging from budget-friendly hotels and extended-stay accommodations to luxurious resorts and spas. Innovation focuses on enhancing guest experiences through technological integration (e.g., smart room controls, mobile check-in), personalized services, and sustainable practices. Unique selling propositions increasingly center on offering curated experiences, emphasizing local culture and community engagement. The use of data analytics to optimize pricing, personalize services, and improve operational efficiency is a significant advancement.
Key Drivers, Barriers & Challenges in US Hospitality Commercial Real Estate Market
Key Drivers: Strong tourism, increasing disposable income, rising business travel, and technological advancements are major drivers of market growth. Government initiatives promoting tourism and infrastructure development further contribute to the market's expansion.
Challenges: High construction and operating costs, intense competition from alternative accommodations, regulatory hurdles (zoning, environmental permits), and labor shortages represent significant challenges. Supply chain disruptions, particularly regarding materials and labor, can cause delays and increase project costs. The impact of these challenges can be measured in decreased profitability and reduced development activity.
Emerging Opportunities in US Hospitality Commercial Real Estate Market
Emerging opportunities lie in sustainable tourism, experiential travel, and the growth of niche market segments (e.g., wellness resorts, glamping). Untapped markets in rural areas and smaller cities also present significant potential for growth. The integration of technology to enhance personalization and operational efficiency remains a key focus, creating further avenues for innovation.
Growth Accelerators in the US Hospitality Commercial Real Estate Market Industry
Technological breakthroughs in areas like AI-powered guest services and sustainable building practices are accelerating market growth. Strategic partnerships between hospitality operators and technology companies are enhancing efficiency and guest experience. Expansion into new markets, particularly in underserved regions, presents significant opportunities.
Key Players Shaping the US Hospitality Commercial Real Estate Market Market
- Wyndham Hotel Group
- InterContinental Hotels Group (IHG)
- Hilton Worldwide Holdings Inc
- RobertDouglas
- RLH Corporation
- Best Western Hotels & Resorts
- Marriott International
- Noble Investment Group
- G6 Hospitality
- Choice Hotels International
- Host Hotels & Resorts
- Coast Hotels
- HEI Hotels & Resorts
- Canyon Equity LLC
- DiamondRock Hospitality Company
Notable Milestones in US Hospitality Commercial Real Estate Market Sector
- 2020: Significant downturn due to the COVID-19 pandemic.
- 2021-2022: Recovery and rebound in travel and tourism.
- 2023: Increased focus on sustainable tourism practices.
- 2024: Continued technological advancements in the sector. (Specific dates and details for milestones will require further research based on available data)
In-Depth US Hospitality Commercial Real Estate Market Market Outlook
The US Hospitality Commercial Real Estate Market is poised for continued growth, driven by a resurgence in travel, technological innovation, and the expansion of niche market segments. Strategic opportunities exist for investors focusing on sustainable development, technological integration, and catering to evolving consumer preferences. The market's long-term outlook remains positive, with sustained growth projected throughout the forecast period (2025-2033).
US Hospitality Commercial Real Estate Market Segmentation
-
1. Property Type
- 1.1. Hotels and Accommodation
- 1.2. Spas and Resorts
- 1.3. Other Property Types
US Hospitality Commercial Real Estate Market Segmentation By Geography
-
1. North America
- 1.1. United States
- 1.2. Canada
- 1.3. Mexico
-
2. South America
- 2.1. Brazil
- 2.2. Argentina
- 2.3. Rest of South America
-
3. Europe
- 3.1. United Kingdom
- 3.2. Germany
- 3.3. France
- 3.4. Italy
- 3.5. Spain
- 3.6. Russia
- 3.7. Benelux
- 3.8. Nordics
- 3.9. Rest of Europe
-
4. Middle East & Africa
- 4.1. Turkey
- 4.2. Israel
- 4.3. GCC
- 4.4. North Africa
- 4.5. South Africa
- 4.6. Rest of Middle East & Africa
-
5. Asia Pacific
- 5.1. China
- 5.2. India
- 5.3. Japan
- 5.4. South Korea
- 5.5. ASEAN
- 5.6. Oceania
- 5.7. Rest of Asia Pacific
US Hospitality Commercial Real Estate Market REPORT HIGHLIGHTS
| Aspects | Details |
|---|---|
| Study Period | 2019-2033 |
| Base Year | 2024 |
| Estimated Year | 2025 |
| Forecast Period | 2025-2033 |
| Historical Period | 2019-2024 |
| Growth Rate | CAGR of > 5.50% from 2019-2033 |
| Segmentation |
|
Table of Contents
- 1. Introduction
- 1.1. Research Scope
- 1.2. Market Segmentation
- 1.3. Research Methodology
- 1.4. Definitions and Assumptions
- 2. Executive Summary
- 2.1. Introduction
- 3. Market Dynamics
- 3.1. Introduction
- 3.2. Market Drivers
- 3.3. Market Restrains
- 3.4. Market Trends
- 3.4.1. Increase in Number of Hotels
- 4. Market Factor Analysis
- 4.1. Porters Five Forces
- 4.2. Supply/Value Chain
- 4.3. PESTEL analysis
- 4.4. Market Entropy
- 4.5. Patent/Trademark Analysis
- 5. Global US Hospitality Commercial Real Estate Market Analysis, Insights and Forecast, 2019-2031
- 5.1. Market Analysis, Insights and Forecast - by Property Type
- 5.1.1. Hotels and Accommodation
- 5.1.2. Spas and Resorts
- 5.1.3. Other Property Types
- 5.2. Market Analysis, Insights and Forecast - by Region
- 5.2.1. North America
- 5.2.2. South America
- 5.2.3. Europe
- 5.2.4. Middle East & Africa
- 5.2.5. Asia Pacific
- 5.1. Market Analysis, Insights and Forecast - by Property Type
- 6. North America US Hospitality Commercial Real Estate Market Analysis, Insights and Forecast, 2019-2031
- 6.1. Market Analysis, Insights and Forecast - by Property Type
- 6.1.1. Hotels and Accommodation
- 6.1.2. Spas and Resorts
- 6.1.3. Other Property Types
- 6.1. Market Analysis, Insights and Forecast - by Property Type
- 7. South America US Hospitality Commercial Real Estate Market Analysis, Insights and Forecast, 2019-2031
- 7.1. Market Analysis, Insights and Forecast - by Property Type
- 7.1.1. Hotels and Accommodation
- 7.1.2. Spas and Resorts
- 7.1.3. Other Property Types
- 7.1. Market Analysis, Insights and Forecast - by Property Type
- 8. Europe US Hospitality Commercial Real Estate Market Analysis, Insights and Forecast, 2019-2031
- 8.1. Market Analysis, Insights and Forecast - by Property Type
- 8.1.1. Hotels and Accommodation
- 8.1.2. Spas and Resorts
- 8.1.3. Other Property Types
- 8.1. Market Analysis, Insights and Forecast - by Property Type
- 9. Middle East & Africa US Hospitality Commercial Real Estate Market Analysis, Insights and Forecast, 2019-2031
- 9.1. Market Analysis, Insights and Forecast - by Property Type
- 9.1.1. Hotels and Accommodation
- 9.1.2. Spas and Resorts
- 9.1.3. Other Property Types
- 9.1. Market Analysis, Insights and Forecast - by Property Type
- 10. Asia Pacific US Hospitality Commercial Real Estate Market Analysis, Insights and Forecast, 2019-2031
- 10.1. Market Analysis, Insights and Forecast - by Property Type
- 10.1.1. Hotels and Accommodation
- 10.1.2. Spas and Resorts
- 10.1.3. Other Property Types
- 10.1. Market Analysis, Insights and Forecast - by Property Type
- 11. Northeast US Hospitality Commercial Real Estate Market Analysis, Insights and Forecast, 2019-2031
- 12. Southeast US Hospitality Commercial Real Estate Market Analysis, Insights and Forecast, 2019-2031
- 13. Midwest US Hospitality Commercial Real Estate Market Analysis, Insights and Forecast, 2019-2031
- 14. Southwest US Hospitality Commercial Real Estate Market Analysis, Insights and Forecast, 2019-2031
- 15. West US Hospitality Commercial Real Estate Market Analysis, Insights and Forecast, 2019-2031
- 16. Competitive Analysis
- 16.1. Global Market Share Analysis 2024
- 16.2. Company Profiles
- 16.2.1 Wyndham Hotel Group
- 16.2.1.1. Overview
- 16.2.1.2. Products
- 16.2.1.3. SWOT Analysis
- 16.2.1.4. Recent Developments
- 16.2.1.5. Financials (Based on Availability)
- 16.2.2 InterContinental Hotels Group (IHG)
- 16.2.2.1. Overview
- 16.2.2.2. Products
- 16.2.2.3. SWOT Analysis
- 16.2.2.4. Recent Developments
- 16.2.2.5. Financials (Based on Availability)
- 16.2.3 Hilton Worldwide Holdings Inc
- 16.2.3.1. Overview
- 16.2.3.2. Products
- 16.2.3.3. SWOT Analysis
- 16.2.3.4. Recent Developments
- 16.2.3.5. Financials (Based on Availability)
- 16.2.4 RobertDouglas
- 16.2.4.1. Overview
- 16.2.4.2. Products
- 16.2.4.3. SWOT Analysis
- 16.2.4.4. Recent Developments
- 16.2.4.5. Financials (Based on Availability)
- 16.2.5 RLH Corporation
- 16.2.5.1. Overview
- 16.2.5.2. Products
- 16.2.5.3. SWOT Analysis
- 16.2.5.4. Recent Developments
- 16.2.5.5. Financials (Based on Availability)
- 16.2.6 Best Western Hotels & Resorts
- 16.2.6.1. Overview
- 16.2.6.2. Products
- 16.2.6.3. SWOT Analysis
- 16.2.6.4. Recent Developments
- 16.2.6.5. Financials (Based on Availability)
- 16.2.7 6 COMPETITVE INTELLIGENCE6 1 Market Concentration6 2 Company profiles
- 16.2.7.1. Overview
- 16.2.7.2. Products
- 16.2.7.3. SWOT Analysis
- 16.2.7.4. Recent Developments
- 16.2.7.5. Financials (Based on Availability)
- 16.2.8 Marriott International
- 16.2.8.1. Overview
- 16.2.8.2. Products
- 16.2.8.3. SWOT Analysis
- 16.2.8.4. Recent Developments
- 16.2.8.5. Financials (Based on Availability)
- 16.2.9 Noble Investment Group
- 16.2.9.1. Overview
- 16.2.9.2. Products
- 16.2.9.3. SWOT Analysis
- 16.2.9.4. Recent Developments
- 16.2.9.5. Financials (Based on Availability)
- 16.2.10 G6 Hospitality
- 16.2.10.1. Overview
- 16.2.10.2. Products
- 16.2.10.3. SWOT Analysis
- 16.2.10.4. Recent Developments
- 16.2.10.5. Financials (Based on Availability)
- 16.2.11 Choice Hotels International
- 16.2.11.1. Overview
- 16.2.11.2. Products
- 16.2.11.3. SWOT Analysis
- 16.2.11.4. Recent Developments
- 16.2.11.5. Financials (Based on Availability)
- 16.2.12 Host Hotels & Resorts
- 16.2.12.1. Overview
- 16.2.12.2. Products
- 16.2.12.3. SWOT Analysis
- 16.2.12.4. Recent Developments
- 16.2.12.5. Financials (Based on Availability)
- 16.2.13 Coast Hotels**List Not Exhaustive
- 16.2.13.1. Overview
- 16.2.13.2. Products
- 16.2.13.3. SWOT Analysis
- 16.2.13.4. Recent Developments
- 16.2.13.5. Financials (Based on Availability)
- 16.2.14 HEI Hotels & Resorts
- 16.2.14.1. Overview
- 16.2.14.2. Products
- 16.2.14.3. SWOT Analysis
- 16.2.14.4. Recent Developments
- 16.2.14.5. Financials (Based on Availability)
- 16.2.15 Canyon Equity LLC
- 16.2.15.1. Overview
- 16.2.15.2. Products
- 16.2.15.3. SWOT Analysis
- 16.2.15.4. Recent Developments
- 16.2.15.5. Financials (Based on Availability)
- 16.2.16 DiamondRock Hospitality Company
- 16.2.16.1. Overview
- 16.2.16.2. Products
- 16.2.16.3. SWOT Analysis
- 16.2.16.4. Recent Developments
- 16.2.16.5. Financials (Based on Availability)
- 16.2.1 Wyndham Hotel Group
List of Figures
- Figure 1: Global US Hospitality Commercial Real Estate Market Revenue Breakdown (Million, %) by Region 2024 & 2032
- Figure 2: United states US Hospitality Commercial Real Estate Market Revenue (Million), by Country 2024 & 2032
- Figure 3: United states US Hospitality Commercial Real Estate Market Revenue Share (%), by Country 2024 & 2032
- Figure 4: North America US Hospitality Commercial Real Estate Market Revenue (Million), by Property Type 2024 & 2032
- Figure 5: North America US Hospitality Commercial Real Estate Market Revenue Share (%), by Property Type 2024 & 2032
- Figure 6: North America US Hospitality Commercial Real Estate Market Revenue (Million), by Country 2024 & 2032
- Figure 7: North America US Hospitality Commercial Real Estate Market Revenue Share (%), by Country 2024 & 2032
- Figure 8: South America US Hospitality Commercial Real Estate Market Revenue (Million), by Property Type 2024 & 2032
- Figure 9: South America US Hospitality Commercial Real Estate Market Revenue Share (%), by Property Type 2024 & 2032
- Figure 10: South America US Hospitality Commercial Real Estate Market Revenue (Million), by Country 2024 & 2032
- Figure 11: South America US Hospitality Commercial Real Estate Market Revenue Share (%), by Country 2024 & 2032
- Figure 12: Europe US Hospitality Commercial Real Estate Market Revenue (Million), by Property Type 2024 & 2032
- Figure 13: Europe US Hospitality Commercial Real Estate Market Revenue Share (%), by Property Type 2024 & 2032
- Figure 14: Europe US Hospitality Commercial Real Estate Market Revenue (Million), by Country 2024 & 2032
- Figure 15: Europe US Hospitality Commercial Real Estate Market Revenue Share (%), by Country 2024 & 2032
- Figure 16: Middle East & Africa US Hospitality Commercial Real Estate Market Revenue (Million), by Property Type 2024 & 2032
- Figure 17: Middle East & Africa US Hospitality Commercial Real Estate Market Revenue Share (%), by Property Type 2024 & 2032
- Figure 18: Middle East & Africa US Hospitality Commercial Real Estate Market Revenue (Million), by Country 2024 & 2032
- Figure 19: Middle East & Africa US Hospitality Commercial Real Estate Market Revenue Share (%), by Country 2024 & 2032
- Figure 20: Asia Pacific US Hospitality Commercial Real Estate Market Revenue (Million), by Property Type 2024 & 2032
- Figure 21: Asia Pacific US Hospitality Commercial Real Estate Market Revenue Share (%), by Property Type 2024 & 2032
- Figure 22: Asia Pacific US Hospitality Commercial Real Estate Market Revenue (Million), by Country 2024 & 2032
- Figure 23: Asia Pacific US Hospitality Commercial Real Estate Market Revenue Share (%), by Country 2024 & 2032
List of Tables
- Table 1: Global US Hospitality Commercial Real Estate Market Revenue Million Forecast, by Region 2019 & 2032
- Table 2: Global US Hospitality Commercial Real Estate Market Revenue Million Forecast, by Property Type 2019 & 2032
- Table 3: Global US Hospitality Commercial Real Estate Market Revenue Million Forecast, by Region 2019 & 2032
- Table 4: Global US Hospitality Commercial Real Estate Market Revenue Million Forecast, by Country 2019 & 2032
- Table 5: Northeast US Hospitality Commercial Real Estate Market Revenue (Million) Forecast, by Application 2019 & 2032
- Table 6: Southeast US Hospitality Commercial Real Estate Market Revenue (Million) Forecast, by Application 2019 & 2032
- Table 7: Midwest US Hospitality Commercial Real Estate Market Revenue (Million) Forecast, by Application 2019 & 2032
- Table 8: Southwest US Hospitality Commercial Real Estate Market Revenue (Million) Forecast, by Application 2019 & 2032
- Table 9: West US Hospitality Commercial Real Estate Market Revenue (Million) Forecast, by Application 2019 & 2032
- Table 10: Global US Hospitality Commercial Real Estate Market Revenue Million Forecast, by Property Type 2019 & 2032
- Table 11: Global US Hospitality Commercial Real Estate Market Revenue Million Forecast, by Country 2019 & 2032
- Table 12: United States US Hospitality Commercial Real Estate Market Revenue (Million) Forecast, by Application 2019 & 2032
- Table 13: Canada US Hospitality Commercial Real Estate Market Revenue (Million) Forecast, by Application 2019 & 2032
- Table 14: Mexico US Hospitality Commercial Real Estate Market Revenue (Million) Forecast, by Application 2019 & 2032
- Table 15: Global US Hospitality Commercial Real Estate Market Revenue Million Forecast, by Property Type 2019 & 2032
- Table 16: Global US Hospitality Commercial Real Estate Market Revenue Million Forecast, by Country 2019 & 2032
- Table 17: Brazil US Hospitality Commercial Real Estate Market Revenue (Million) Forecast, by Application 2019 & 2032
- Table 18: Argentina US Hospitality Commercial Real Estate Market Revenue (Million) Forecast, by Application 2019 & 2032
- Table 19: Rest of South America US Hospitality Commercial Real Estate Market Revenue (Million) Forecast, by Application 2019 & 2032
- Table 20: Global US Hospitality Commercial Real Estate Market Revenue Million Forecast, by Property Type 2019 & 2032
- Table 21: Global US Hospitality Commercial Real Estate Market Revenue Million Forecast, by Country 2019 & 2032
- Table 22: United Kingdom US Hospitality Commercial Real Estate Market Revenue (Million) Forecast, by Application 2019 & 2032
- Table 23: Germany US Hospitality Commercial Real Estate Market Revenue (Million) Forecast, by Application 2019 & 2032
- Table 24: France US Hospitality Commercial Real Estate Market Revenue (Million) Forecast, by Application 2019 & 2032
- Table 25: Italy US Hospitality Commercial Real Estate Market Revenue (Million) Forecast, by Application 2019 & 2032
- Table 26: Spain US Hospitality Commercial Real Estate Market Revenue (Million) Forecast, by Application 2019 & 2032
- Table 27: Russia US Hospitality Commercial Real Estate Market Revenue (Million) Forecast, by Application 2019 & 2032
- Table 28: Benelux US Hospitality Commercial Real Estate Market Revenue (Million) Forecast, by Application 2019 & 2032
- Table 29: Nordics US Hospitality Commercial Real Estate Market Revenue (Million) Forecast, by Application 2019 & 2032
- Table 30: Rest of Europe US Hospitality Commercial Real Estate Market Revenue (Million) Forecast, by Application 2019 & 2032
- Table 31: Global US Hospitality Commercial Real Estate Market Revenue Million Forecast, by Property Type 2019 & 2032
- Table 32: Global US Hospitality Commercial Real Estate Market Revenue Million Forecast, by Country 2019 & 2032
- Table 33: Turkey US Hospitality Commercial Real Estate Market Revenue (Million) Forecast, by Application 2019 & 2032
- Table 34: Israel US Hospitality Commercial Real Estate Market Revenue (Million) Forecast, by Application 2019 & 2032
- Table 35: GCC US Hospitality Commercial Real Estate Market Revenue (Million) Forecast, by Application 2019 & 2032
- Table 36: North Africa US Hospitality Commercial Real Estate Market Revenue (Million) Forecast, by Application 2019 & 2032
- Table 37: South Africa US Hospitality Commercial Real Estate Market Revenue (Million) Forecast, by Application 2019 & 2032
- Table 38: Rest of Middle East & Africa US Hospitality Commercial Real Estate Market Revenue (Million) Forecast, by Application 2019 & 2032
- Table 39: Global US Hospitality Commercial Real Estate Market Revenue Million Forecast, by Property Type 2019 & 2032
- Table 40: Global US Hospitality Commercial Real Estate Market Revenue Million Forecast, by Country 2019 & 2032
- Table 41: China US Hospitality Commercial Real Estate Market Revenue (Million) Forecast, by Application 2019 & 2032
- Table 42: India US Hospitality Commercial Real Estate Market Revenue (Million) Forecast, by Application 2019 & 2032
- Table 43: Japan US Hospitality Commercial Real Estate Market Revenue (Million) Forecast, by Application 2019 & 2032
- Table 44: South Korea US Hospitality Commercial Real Estate Market Revenue (Million) Forecast, by Application 2019 & 2032
- Table 45: ASEAN US Hospitality Commercial Real Estate Market Revenue (Million) Forecast, by Application 2019 & 2032
- Table 46: Oceania US Hospitality Commercial Real Estate Market Revenue (Million) Forecast, by Application 2019 & 2032
- Table 47: Rest of Asia Pacific US Hospitality Commercial Real Estate Market Revenue (Million) Forecast, by Application 2019 & 2032
Frequently Asked Questions
1. What is the projected Compound Annual Growth Rate (CAGR) of the US Hospitality Commercial Real Estate Market?
The projected CAGR is approximately > 5.50%.
2. Which companies are prominent players in the US Hospitality Commercial Real Estate Market?
Key companies in the market include Wyndham Hotel Group, InterContinental Hotels Group (IHG), Hilton Worldwide Holdings Inc, RobertDouglas, RLH Corporation, Best Western Hotels & Resorts, 6 COMPETITVE INTELLIGENCE6 1 Market Concentration6 2 Company profiles, Marriott International, Noble Investment Group, G6 Hospitality, Choice Hotels International, Host Hotels & Resorts, Coast Hotels**List Not Exhaustive, HEI Hotels & Resorts, Canyon Equity LLC, DiamondRock Hospitality Company.
3. What are the main segments of the US Hospitality Commercial Real Estate Market?
The market segments include Property Type.
4. Can you provide details about the market size?
The market size is estimated to be USD XX Million as of 2022.
5. What are some drivers contributing to market growth?
N/A
6. What are the notable trends driving market growth?
Increase in Number of Hotels.
7. Are there any restraints impacting market growth?
N/A
8. Can you provide examples of recent developments in the market?
N/A
9. What pricing options are available for accessing the report?
Pricing options include single-user, multi-user, and enterprise licenses priced at USD 3800, USD 4500, and USD 5800 respectively.
10. Is the market size provided in terms of value or volume?
The market size is provided in terms of value, measured in Million.
11. Are there any specific market keywords associated with the report?
Yes, the market keyword associated with the report is "US Hospitality Commercial Real Estate Market," which aids in identifying and referencing the specific market segment covered.
12. How do I determine which pricing option suits my needs best?
The pricing options vary based on user requirements and access needs. Individual users may opt for single-user licenses, while businesses requiring broader access may choose multi-user or enterprise licenses for cost-effective access to the report.
13. Are there any additional resources or data provided in the US Hospitality Commercial Real Estate Market report?
While the report offers comprehensive insights, it's advisable to review the specific contents or supplementary materials provided to ascertain if additional resources or data are available.
14. How can I stay updated on further developments or reports in the US Hospitality Commercial Real Estate Market?
To stay informed about further developments, trends, and reports in the US Hospitality Commercial Real Estate Market, consider subscribing to industry newsletters, following relevant companies and organizations, or regularly checking reputable industry news sources and publications.
Methodology
Step 1 - Identification of Relevant Samples Size from Population Database


Step 2 - Approaches for Defining Global Market Size (Value, Volume* & Price*)

Note*: In applicable scenarios
Step 3 - Data Sources
Primary Research
- Web Analytics
- Survey Reports
- Research Institute
- Latest Research Reports
- Opinion Leaders
Secondary Research
- Annual Reports
- White Paper
- Latest Press Release
- Industry Association
- Paid Database
- Investor Presentations

Step 4 - Data Triangulation
Involves using different sources of information in order to increase the validity of a study
These sources are likely to be stakeholders in a program - participants, other researchers, program staff, other community members, and so on.
Then we put all data in single framework & apply various statistical tools to find out the dynamic on the market.
During the analysis stage, feedback from the stakeholder groups would be compared to determine areas of agreement as well as areas of divergence
