

Key Insights
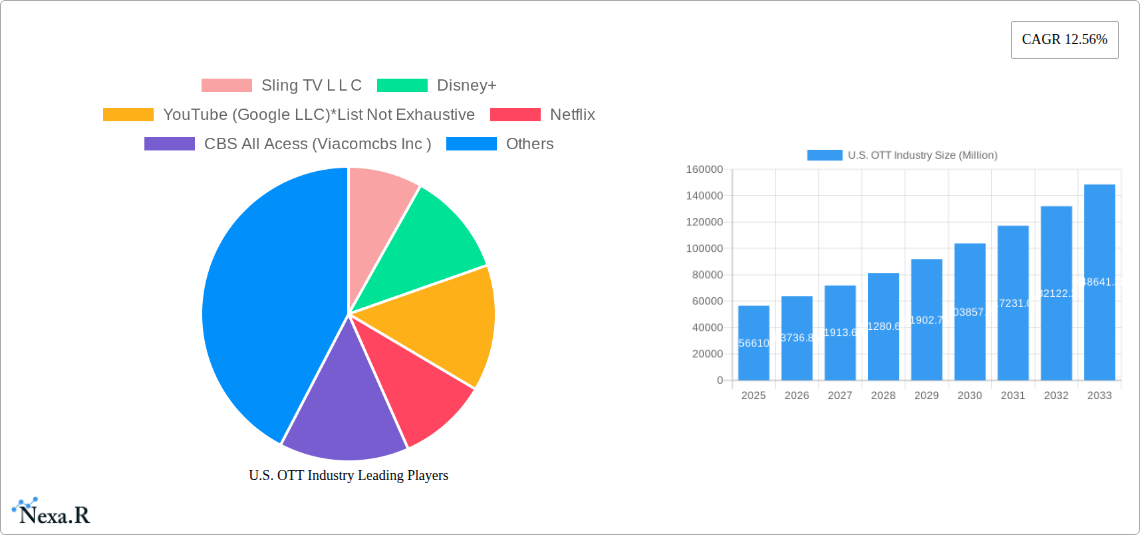
The U.S. Over-the-Top (OTT) video streaming market, valued at $56.61 billion in 2025, is experiencing robust growth, projected to expand at a Compound Annual Growth Rate (CAGR) of 12.56% from 2025 to 2033. This explosive growth is fueled by several key drivers. The increasing affordability and accessibility of high-speed internet, coupled with the proliferation of smart TVs and mobile devices, have significantly broadened the reach of OTT platforms. Consumer preference for on-demand content and personalized viewing experiences is further driving market expansion. The emergence of innovative features like interactive content and personalized recommendations enhances user engagement and strengthens platform loyalty. Competition among major players like Netflix, Disney+, Amazon Prime Video, and Hulu is intense, fostering innovation and pushing prices down, thereby expanding market penetration. The rise of AVOD (ad-supported video on demand) services presents a unique opportunity to cater to budget-conscious consumers, widening the market's overall reach.
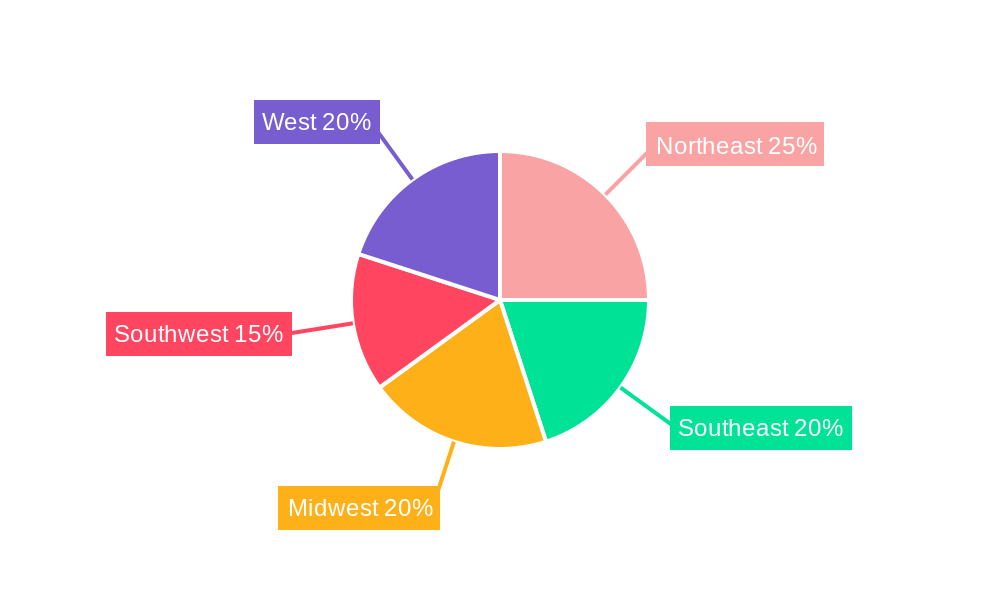
However, the market faces certain challenges. Content licensing costs and the need for continuous investment in original programming represent significant hurdles for smaller players. Concerns about data privacy and security, alongside intense competition for consumer attention and subscription dollars, remain substantial headwinds. Despite these, the dominance of SVOD (subscription video on demand) continues, indicating a healthy demand for premium content. Regional variations exist, with the Northeast and West Coast potentially showing higher adoption rates and average revenue per user due to higher disposable income and technological penetration. The segmentation by type (SVOD, TVOD, AVOD) reflects the evolving consumer preferences and the continuous adaptation of the market to different price points and consumer needs. This diversified landscape ensures future growth and expansion potential within the U.S. OTT market.
U.S. Over-the-Top (OTT) Industry Market Report: 2019-2033
This comprehensive report provides an in-depth analysis of the U.S. OTT industry, covering market dynamics, growth trends, key players, and future outlook. With a focus on SVOD, TVOD, and AVOD segments, this report is essential for industry professionals, investors, and anyone seeking to understand this rapidly evolving landscape. The study period spans 2019-2033, with 2025 as the base and estimated year. The forecast period is 2025-2033, and the historical period is 2019-2024. Market values are presented in millions of units.
U.S. OTT Industry Market Dynamics & Structure
The U.S. OTT market is characterized by intense competition, rapid technological advancements, and evolving regulatory frameworks. Market concentration is high, with a few major players dominating the landscape. However, smaller players continue to emerge, driven by niche content offerings and innovative business models. Mergers and acquisitions (M&A) are frequent, reflecting the industry's consolidation trend and the quest for scale and content libraries.
- Market Concentration: Netflix, Disney+, and Amazon Prime Video hold significant market share (xx%), with other players like Sling TV LLC, YouTube (Google LLC), CBS All Access (ViacomCBS Inc.), Roku, Apple Inc., and HBO Max (AT&T Inc.) vying for market share. The remaining market is fragmented across numerous smaller players (xx%).
- Technological Innovation: The industry is driven by advancements in streaming technology, video compression, personalized recommendations, and immersive viewing experiences (e.g., HDR, 4K). However, innovation barriers exist related to high infrastructure costs and the need for significant content investment.
- Regulatory Frameworks: Government regulations concerning data privacy, net neutrality, and content licensing significantly impact the industry. The regulatory landscape continues to evolve, posing both opportunities and challenges.
- Competitive Product Substitutes: Traditional cable and satellite television remain significant substitutes, although their market share is declining. Other substitutes include free ad-supported streaming services and social media platforms offering video content.
- End-User Demographics: The U.S. OTT market is broadly diversified across age groups and demographics. However, significant growth opportunities exist in expanding reach to older demographics and underserved communities.
- M&A Trends: The past five years saw xx M&A deals, primarily focused on content acquisition and technological integration. This trend is expected to continue as companies seek scale and diversify their content offerings.
U.S. OTT Industry Growth Trends & Insights
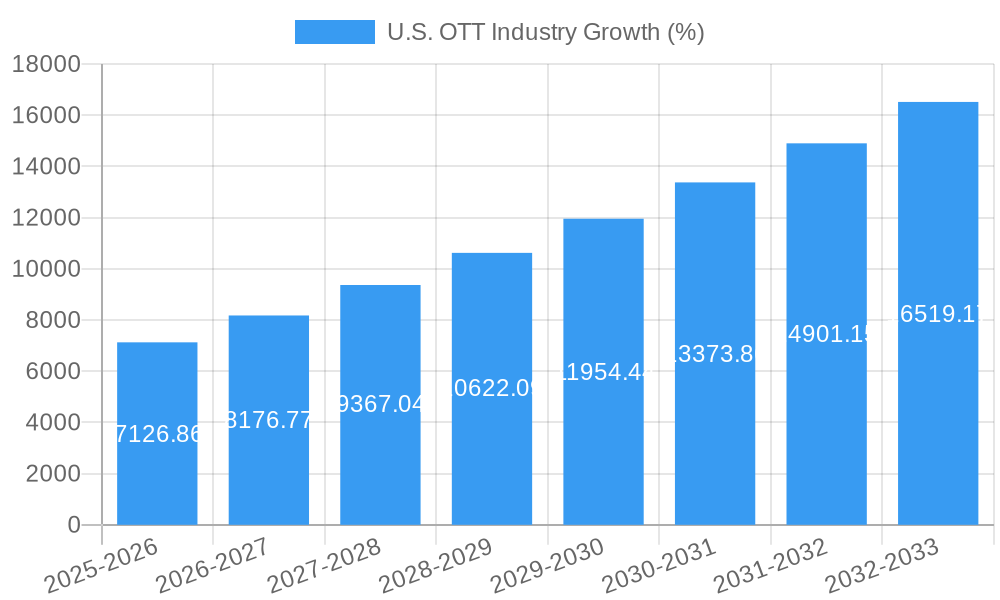
The U.S. OTT market experienced significant growth during the historical period (2019-2024), with a Compound Annual Growth Rate (CAGR) of xx%. This growth is attributed to factors like increasing broadband penetration, declining cable TV subscriptions, and the rising popularity of on-demand streaming services. Market penetration increased from xx% in 2019 to xx% in 2024. Technological disruptions such as the rise of 4K streaming and improvements in mobile streaming capabilities have fueled adoption. Consumer behavior shifts towards personalized content consumption and convenient access have also driven growth. The forecast period (2025-2033) projects continued growth, although at a slightly slower CAGR of xx%, driven by market saturation and increasing competition.
Dominant Regions, Countries, or Segments in U.S. OTT Industry
The U.S. OTT market is largely homogenous across regions, reflecting the widespread availability of broadband internet access. However, SVOD remains the dominant segment by type, accounting for xx% of the market in 2024, followed by AVOD (xx%) and TVOD (xx%).
- Key Drivers for SVOD Dominance:
- High consumer preference for on-demand, ad-free viewing experiences.
- Wide availability of diverse and high-quality content libraries.
- Established player dominance and brand recognition.
- Growth Potential: While SVOD continues to dominate, AVOD is experiencing rapid growth, driven by its affordability and accessibility. TVOD is expected to maintain a steady growth trajectory, fueled by the popularity of new movie releases.
U.S. OTT Industry Product Landscape
The U.S. OTT industry showcases a wide array of products, from standalone streaming services offering original and licensed content to integrated platforms bundling streaming and other services. Technological advancements such as improved recommendation algorithms, interactive features, and support for multiple devices are key differentiators. The market is witnessing the rise of personalized content recommendations, offering tailored viewing experiences based on user preferences and viewing history. This trend enhances user engagement and satisfaction, impacting retention rates.
Key Drivers, Barriers & Challenges in U.S. OTT Industry
Key Drivers: Rising broadband penetration, increasing smartphone and smart TV adoption, consumer preference for on-demand content, and the continuous influx of high-quality original programming are major growth drivers. Technological advancements in streaming technology and personalized content recommendations further fuel market expansion.
Key Challenges: Intense competition, high content acquisition costs, the threat of piracy, and evolving regulatory landscapes pose significant challenges. Supply chain disruptions related to content production and distribution can also impact market stability. Competition among major players creates downward pressure on subscription prices, squeezing profit margins for many companies.
Emerging Opportunities in U.S. OTT Industry
The growing demand for hyper-personalized content experiences and the increasing adoption of immersive technologies (VR/AR) present significant opportunities. Untapped markets among older demographics and underserved communities also offer considerable growth potential. The expansion of streaming services into gaming and other interactive entertainment forms presents new revenue streams.
Growth Accelerators in the U.S. OTT Industry
Strategic partnerships between content creators, technology providers, and telecom operators will accelerate growth. Further technological advancements in streaming technology, artificial intelligence (AI) driven personalization, and improved user interface (UI)/user experience (UX) designs will significantly enhance the customer experience, driving wider adoption. Expansion into new geographic markets and the adoption of innovative pricing models, such as freemium or tiered subscription models, also holds considerable growth potential.
Key Players Shaping the U.S. OTT Industry Market
- Sling TV L L C
- Disney+
- YouTube (Google LLC)
- Netflix
- CBS All Access (ViacomCBS Inc.)
- Roku
- Amazon Prime Video
- Apple Inc.
- HBO Max (AT&T Inc.)
Notable Milestones in U.S. OTT Industry Sector
- July 2022: Netflix acquired Animal Logic, accelerating its end-to-end animation production capabilities.
- April 2022: Roku and Amazon extended their distribution agreement, enhancing Prime Video accessibility.
In-Depth U.S. OTT Industry Market Outlook
The U.S. OTT market is poised for continued growth, driven by technological advancements and evolving consumer preferences. Strategic partnerships and aggressive content acquisition strategies will be crucial for companies to maintain market share. The focus on personalization, interactive features, and immersive experiences will shape future market dynamics, leading to new revenue streams and expanded market opportunities.
U.S. OTT Industry Segmentation
-
1. Type
- 1.1. SVoD
- 1.2. TVoD
- 1.3. AVoD
U.S. OTT Industry Segmentation By Geography
- 1. U.S.
U.S. OTT Industry REPORT HIGHLIGHTS
| Aspects | Details |
|---|---|
| Study Period | 2019-2033 |
| Base Year | 2024 |
| Estimated Year | 2025 |
| Forecast Period | 2025-2033 |
| Historical Period | 2019-2024 |
| Growth Rate | CAGR of 12.56% from 2019-2033 |
| Segmentation |
|
Table of Contents
- 1. Introduction
- 1.1. Research Scope
- 1.2. Market Segmentation
- 1.3. Research Methodology
- 1.4. Definitions and Assumptions
- 2. Executive Summary
- 2.1. Introduction
- 3. Market Dynamics
- 3.1. Introduction
- 3.2. Market Drivers
- 3.2.1. High Penetration of Smart TV and the Presence of Major OTT Providers have Contributed to the Growth of OTT Adoption in the Region; Market Consolidation to Result in Emphasis on Collaboration and Partnerships
- 3.3. Market Restrains
- 3.3.1. Growing Threat of Video Content Piracy and Security Threat of User Database Due to Spyware
- 3.4. Market Trends
- 3.4.1. High Penetration of Smart TV Witnesses a Significant Growth
- 4. Market Factor Analysis
- 4.1. Porters Five Forces
- 4.2. Supply/Value Chain
- 4.3. PESTEL analysis
- 4.4. Market Entropy
- 4.5. Patent/Trademark Analysis
- 5. U.S. OTT Industry Analysis, Insights and Forecast, 2019-2031
- 5.1. Market Analysis, Insights and Forecast - by Type
- 5.1.1. SVoD
- 5.1.2. TVoD
- 5.1.3. AVoD
- 5.2. Market Analysis, Insights and Forecast - by Region
- 5.2.1. U.S.
- 5.1. Market Analysis, Insights and Forecast - by Type
- 6. Northeast U.S. OTT Industry Analysis, Insights and Forecast, 2019-2031
- 7. Southeast U.S. OTT Industry Analysis, Insights and Forecast, 2019-2031
- 8. Midwest U.S. OTT Industry Analysis, Insights and Forecast, 2019-2031
- 9. Southwest U.S. OTT Industry Analysis, Insights and Forecast, 2019-2031
- 10. West U.S. OTT Industry Analysis, Insights and Forecast, 2019-2031
- 11. Competitive Analysis
- 11.1. Market Share Analysis 2024
- 11.2. Company Profiles
- 11.2.1 Sling TV L L C
- 11.2.1.1. Overview
- 11.2.1.2. Products
- 11.2.1.3. SWOT Analysis
- 11.2.1.4. Recent Developments
- 11.2.1.5. Financials (Based on Availability)
- 11.2.2 Disney+
- 11.2.2.1. Overview
- 11.2.2.2. Products
- 11.2.2.3. SWOT Analysis
- 11.2.2.4. Recent Developments
- 11.2.2.5. Financials (Based on Availability)
- 11.2.3 YouTube (Google LLC)*List Not Exhaustive
- 11.2.3.1. Overview
- 11.2.3.2. Products
- 11.2.3.3. SWOT Analysis
- 11.2.3.4. Recent Developments
- 11.2.3.5. Financials (Based on Availability)
- 11.2.4 Netflix
- 11.2.4.1. Overview
- 11.2.4.2. Products
- 11.2.4.3. SWOT Analysis
- 11.2.4.4. Recent Developments
- 11.2.4.5. Financials (Based on Availability)
- 11.2.5 CBS All Acess (Viacomcbs Inc )
- 11.2.5.1. Overview
- 11.2.5.2. Products
- 11.2.5.3. SWOT Analysis
- 11.2.5.4. Recent Developments
- 11.2.5.5. Financials (Based on Availability)
- 11.2.6 Roku
- 11.2.6.1. Overview
- 11.2.6.2. Products
- 11.2.6.3. SWOT Analysis
- 11.2.6.4. Recent Developments
- 11.2.6.5. Financials (Based on Availability)
- 11.2.7 Amazon Prime Video
- 11.2.7.1. Overview
- 11.2.7.2. Products
- 11.2.7.3. SWOT Analysis
- 11.2.7.4. Recent Developments
- 11.2.7.5. Financials (Based on Availability)
- 11.2.8 Apple Inc
- 11.2.8.1. Overview
- 11.2.8.2. Products
- 11.2.8.3. SWOT Analysis
- 11.2.8.4. Recent Developments
- 11.2.8.5. Financials (Based on Availability)
- 11.2.9 HBO Max (AT&T Inc )
- 11.2.9.1. Overview
- 11.2.9.2. Products
- 11.2.9.3. SWOT Analysis
- 11.2.9.4. Recent Developments
- 11.2.9.5. Financials (Based on Availability)
- 11.2.1 Sling TV L L C
List of Figures
- Figure 1: U.S. OTT Industry Revenue Breakdown (Million, %) by Product 2024 & 2032
- Figure 2: U.S. OTT Industry Share (%) by Company 2024
List of Tables
- Table 1: U.S. OTT Industry Revenue Million Forecast, by Region 2019 & 2032
- Table 2: U.S. OTT Industry Revenue Million Forecast, by Type 2019 & 2032
- Table 3: U.S. OTT Industry Revenue Million Forecast, by Region 2019 & 2032
- Table 4: U.S. OTT Industry Revenue Million Forecast, by Country 2019 & 2032
- Table 5: Northeast U.S. OTT Industry Revenue (Million) Forecast, by Application 2019 & 2032
- Table 6: Southeast U.S. OTT Industry Revenue (Million) Forecast, by Application 2019 & 2032
- Table 7: Midwest U.S. OTT Industry Revenue (Million) Forecast, by Application 2019 & 2032
- Table 8: Southwest U.S. OTT Industry Revenue (Million) Forecast, by Application 2019 & 2032
- Table 9: West U.S. OTT Industry Revenue (Million) Forecast, by Application 2019 & 2032
- Table 10: U.S. OTT Industry Revenue Million Forecast, by Type 2019 & 2032
- Table 11: U.S. OTT Industry Revenue Million Forecast, by Country 2019 & 2032
Frequently Asked Questions
1. What is the projected Compound Annual Growth Rate (CAGR) of the U.S. OTT Industry?
The projected CAGR is approximately 12.56%.
2. Which companies are prominent players in the U.S. OTT Industry?
Key companies in the market include Sling TV L L C, Disney+, YouTube (Google LLC)*List Not Exhaustive, Netflix, CBS All Acess (Viacomcbs Inc ), Roku, Amazon Prime Video, Apple Inc, HBO Max (AT&T Inc ).
3. What are the main segments of the U.S. OTT Industry?
The market segments include Type.
4. Can you provide details about the market size?
The market size is estimated to be USD 56.61 Million as of 2022.
5. What are some drivers contributing to market growth?
High Penetration of Smart TV and the Presence of Major OTT Providers have Contributed to the Growth of OTT Adoption in the Region; Market Consolidation to Result in Emphasis on Collaboration and Partnerships.
6. What are the notable trends driving market growth?
High Penetration of Smart TV Witnesses a Significant Growth.
7. Are there any restraints impacting market growth?
Growing Threat of Video Content Piracy and Security Threat of User Database Due to Spyware.
8. Can you provide examples of recent developments in the market?
Jul 2022: Netflix acquired Animal Logic, the world's leading independent animation studio. This acquisition is expected to speed up Netflix's development of end-to-end animation production abilities. Netflix Animation and Animal Logic together are anticipated to form a worldwide creative production team as well as an animation studio that will create some of Netflix's most popular animated feature titles.
9. What pricing options are available for accessing the report?
Pricing options include single-user, multi-user, and enterprise licenses priced at USD 3800, USD 4500, and USD 5800 respectively.
10. Is the market size provided in terms of value or volume?
The market size is provided in terms of value, measured in Million.
11. Are there any specific market keywords associated with the report?
Yes, the market keyword associated with the report is "U.S. OTT Industry," which aids in identifying and referencing the specific market segment covered.
12. How do I determine which pricing option suits my needs best?
The pricing options vary based on user requirements and access needs. Individual users may opt for single-user licenses, while businesses requiring broader access may choose multi-user or enterprise licenses for cost-effective access to the report.
13. Are there any additional resources or data provided in the U.S. OTT Industry report?
While the report offers comprehensive insights, it's advisable to review the specific contents or supplementary materials provided to ascertain if additional resources or data are available.
14. How can I stay updated on further developments or reports in the U.S. OTT Industry?
To stay informed about further developments, trends, and reports in the U.S. OTT Industry, consider subscribing to industry newsletters, following relevant companies and organizations, or regularly checking reputable industry news sources and publications.
Methodology
Step 1 - Identification of Relevant Samples Size from Population Database


Step 2 - Approaches for Defining Global Market Size (Value, Volume* & Price*)

Note*: In applicable scenarios
Step 3 - Data Sources
Primary Research
- Web Analytics
- Survey Reports
- Research Institute
- Latest Research Reports
- Opinion Leaders
Secondary Research
- Annual Reports
- White Paper
- Latest Press Release
- Industry Association
- Paid Database
- Investor Presentations

Step 4 - Data Triangulation
Involves using different sources of information in order to increase the validity of a study
These sources are likely to be stakeholders in a program - participants, other researchers, program staff, other community members, and so on.
Then we put all data in single framework & apply various statistical tools to find out the dynamic on the market.
During the analysis stage, feedback from the stakeholder groups would be compared to determine areas of agreement as well as areas of divergence
