

Key Insights
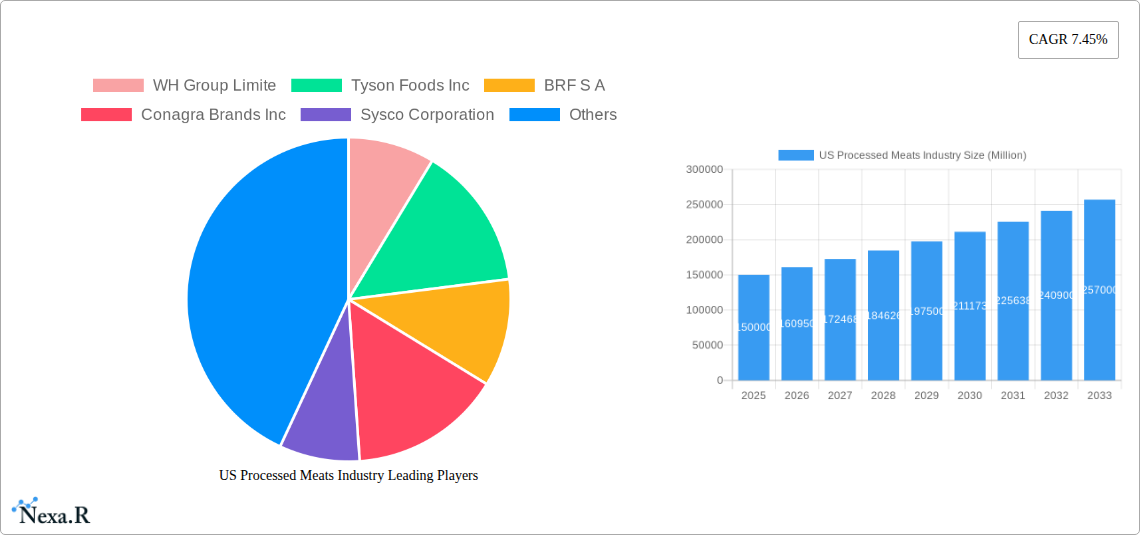
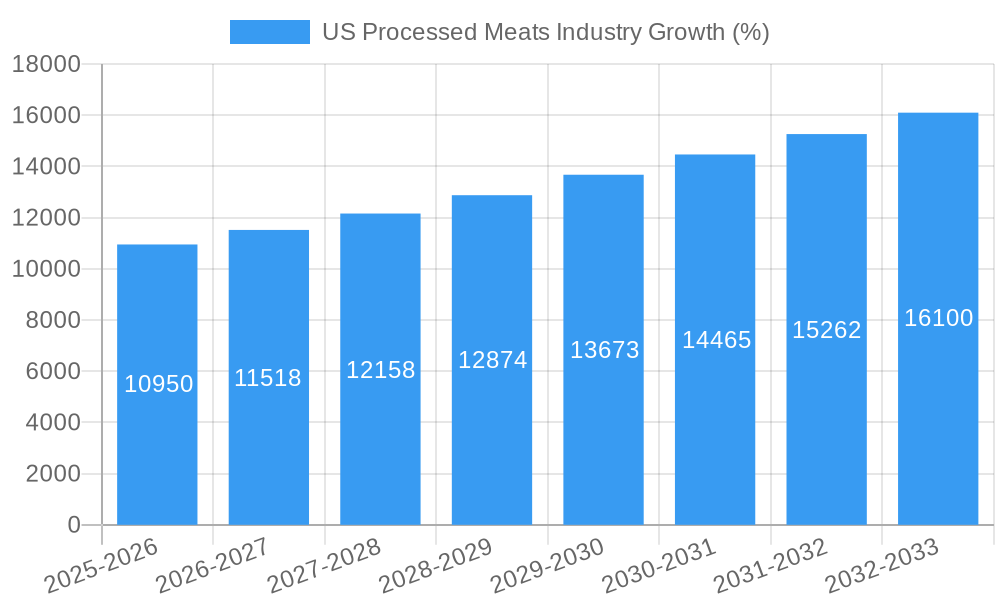
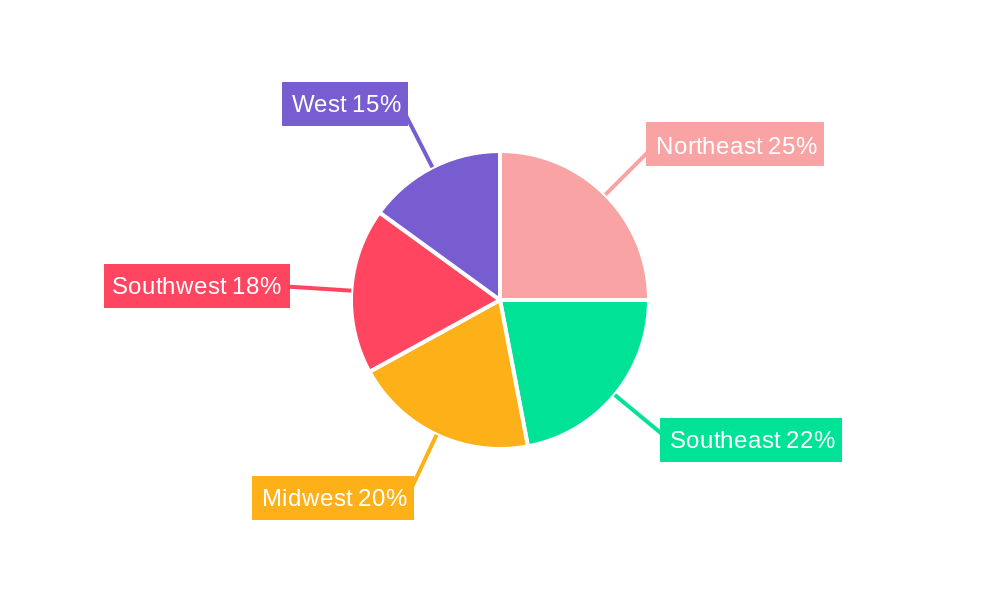
The US processed meats industry, a significant segment of the broader food and beverage sector, is experiencing robust growth, projected at a 7.45% CAGR from 2025 to 2033. This expansion is driven by several key factors. Increased consumer demand for convenient and ready-to-eat meals fuels the market's growth, particularly within the beef, poultry, and pork segments. The rising popularity of processed meat products in various cuisines and food service establishments further contributes to this upward trajectory. However, growing health consciousness among consumers, coupled with increasing awareness of the health implications associated with high sodium and saturated fat content in some processed meats, presents a challenge to the industry. This necessitates the development of healthier alternatives, such as leaner meats, reduced-sodium options, and plant-based meat substitutes. The industry is also witnessing a shift towards premium and value-added processed meat products, reflecting the changing consumer preferences for higher quality and unique flavors. Competitive pressures remain intense, with established players such as Tyson Foods, JBS, and Hormel Foods competing with smaller, niche brands specializing in organic or specialty meats. Geographic distribution shows strong demand across all US regions, with the Northeast and West potentially experiencing slightly higher growth due to greater population density and higher disposable income. The industry is also exploring innovative packaging and preservation techniques to enhance shelf life and reduce food waste. This holistic approach— balancing consumer demands for convenience and health with innovative product development and efficient distribution—will be crucial for sustained growth in the coming years.
The segmentation of the US processed meats market reveals distinct dynamics. Beef, poultry, and pork remain dominant segments, driven by established consumer preferences and culinary traditions. However, the "other meat" category, encompassing various ethnic and specialty meats, is projected to show comparatively higher growth rates due to increasing diversification in food choices. Distribution channels are bifurcated between off-trade (grocery stores, supermarkets, etc.) and on-trade (food service outlets, restaurants, etc.), with the former holding a larger market share due to widespread accessibility. The projected market size for 2025, based on the provided CAGR and considering market trends, is estimated to be in the billions of dollars (exact figure withheld as it is a derived estimate based on the given CAGR, not a provided figure). To sustain growth, companies must adapt to evolving consumer demands, focusing on healthier formulations, sustainable practices, and effective marketing strategies that communicate the value proposition of their products.
US Processed Meats Industry Market Report: 2019-2033
This comprehensive report provides a detailed analysis of the US processed meats industry, encompassing market dynamics, growth trends, key players, and future outlook. With a focus on the parent market (Processed Meats) and child markets (Beef, Pork, Poultry, etc.), this report is an invaluable resource for industry professionals, investors, and strategic decision-makers. The study period covers 2019-2033, with 2025 as the base year and forecast extending to 2033. Market values are presented in millions of USD.
US Processed Meats Industry Market Dynamics & Structure
The US processed meats industry is a highly consolidated market, characterized by intense competition among major players. Market concentration is high, with the top 10 companies holding an estimated xx% market share in 2025. Technological innovation, particularly in processing techniques and packaging, is a key driver. Stringent regulatory frameworks concerning food safety and labeling significantly impact industry operations. The industry faces competition from alternative protein sources, including plant-based meats and cultured meat, impacting overall market dynamics. End-user demographics, with shifting consumer preferences towards convenience and health, further shape the market landscape. M&A activity has been significant in recent years, with xx deals recorded between 2019 and 2024, primarily driven by consolidation and expansion strategies.
- Market Concentration: Top 10 companies hold xx% market share (2025).
- Technological Innovation: Focus on automation, efficient processing, and sustainable packaging.
- Regulatory Framework: Stringent food safety and labeling regulations.
- Competitive Substitutes: Plant-based meats, cultured meat posing a growing threat.
- End-User Demographics: Shifting consumer preferences towards convenience and healthier options.
- M&A Activity: xx deals between 2019 and 2024.
US Processed Meats Industry Growth Trends & Insights
The US processed meats market experienced a CAGR of xx% during the historical period (2019-2024), reaching a market size of xx million in 2024. This growth is attributed to factors such as increasing consumer demand for convenient food options, rising disposable incomes, and the expansion of retail channels. However, growth is expected to moderate slightly in the forecast period (2025-2033), with a projected CAGR of xx%, reaching xx million by 2033. This moderation reflects the growing awareness of health concerns associated with processed meats and increasing competition from alternative protein sources. Technological disruptions, such as advancements in meat processing technologies and the introduction of novel products, are likely to shape market growth trajectories. Consumer behavior shifts, including growing preference for organic and sustainably produced meat, further contribute to market dynamics. Market penetration of processed meat products remains high, with approximately xx% of households consuming processed meat regularly.
Dominant Regions, Countries, or Segments in US Processed Meats Industry
The Midwest and South regions of the US currently dominate the processed meats market, driven by factors such as large livestock populations and established processing infrastructure. Within product segments, beef and poultry consistently hold the largest market share, followed by pork. The off-trade channel (grocery stores, supermarkets) dominates the distribution landscape, but online sales are experiencing growth.
- Leading Regions: Midwest and South.
- Dominant Product Types: Beef, Poultry, Pork.
- Primary Distribution Channel: Off-Trade (Grocery Stores, Supermarkets).
- Growth Drivers: Strong demand, established infrastructure, and increasing retail channels.
US Processed Meats Industry Product Landscape
The processed meats market features a diverse range of products, including fresh and frozen meats, cured meats, ready-to-eat meals, and meat snacks. Recent innovations focus on improving product quality, enhancing taste and texture, extending shelf life, and catering to health-conscious consumers. This includes the introduction of reduced-sodium, organic, and antibiotic-free products. Technological advancements in processing and packaging, such as modified atmosphere packaging and sous vide technology, are enhancing product quality and safety. Unique selling propositions include convenience, variety, and affordability, while technological advancements are primarily aimed at improved safety, extended shelf life, and enhanced taste/texture.
Key Drivers, Barriers & Challenges in US Processed Meats Industry
Key Drivers:
- Increasing demand for convenient and ready-to-eat meals.
- Growing population and rising disposable incomes.
- Expansion of retail and food service channels.
Key Challenges:
- Health concerns associated with high sodium and fat content.
- Increasing competition from alternative protein sources (plant-based meats).
- Fluctuations in raw material costs and supply chain disruptions. The impact of these disruptions was estimated to cost the industry xx million in 2022.
- Stringent regulatory compliance requirements.
Emerging Opportunities in US Processed Meats Industry
Emerging opportunities lie in developing healthier and more sustainable products. This includes exploring plant-based blends, reducing sodium and fat content, and emphasizing organic and antibiotic-free options. Further untapped markets include ethnic food preferences and growing demand for specialized protein sources.
Growth Accelerators in the US Processed Meats Industry Industry
Long-term growth will be driven by technological advancements in processing and packaging, strategic partnerships to expand distribution channels, and increased focus on sustainability and health-conscious product offerings. Expansion into new markets and leveraging e-commerce platforms will further accelerate growth.
Key Players Shaping the US Processed Meats Industry Market
- WH Group Limited
- Tyson Foods Inc
- BRF S A
- Conagra Brands Inc
- Sysco Corporation
- The Kraft Heinz Company
- Hormel Foods Corporation
- Cargill Inc
- Marfrig Global Foods S A
- Maple Leaf Foods
- JBS SA
Notable Milestones in US Processed Meats Industry Sector
- March 2023: Tyson® brand introduces chicken sandwiches and sliders.
- April 2023: Launch of HERDEZ™ Mexican Refrigerated Entrées line.
- May 2023: Tyson Foods Claryville expands cocktail sausage manufacturing capacity (USD 83 million investment).
In-Depth US Processed Meats Industry Market Outlook
The US processed meats market exhibits strong long-term growth potential, driven by continued demand for convenient protein sources and innovative product developments. Strategic partnerships, focusing on sustainable and healthier offerings, coupled with expansion into emerging markets, will create significant opportunities for industry players. The market is poised for further consolidation, with larger players acquiring smaller companies to enhance their market share and product portfolios.
US Processed Meats Industry Segmentation
-
1. Type
- 1.1. Beef
- 1.2. Mutton
- 1.3. Pork
- 1.4. Poultry
- 1.5. Other Meat
-
2. Distribution Channel
-
2.1. Off-Trade
- 2.1.1. Convenience Stores
- 2.1.2. Online Channel
- 2.1.3. Supermarkets and Hypermarkets
- 2.1.4. Others
- 2.2. On-Trade
-
2.1. Off-Trade
US Processed Meats Industry Segmentation By Geography
-
1. North America
- 1.1. United States
- 1.2. Canada
- 1.3. Mexico
-
2. South America
- 2.1. Brazil
- 2.2. Argentina
- 2.3. Rest of South America
-
3. Europe
- 3.1. United Kingdom
- 3.2. Germany
- 3.3. France
- 3.4. Italy
- 3.5. Spain
- 3.6. Russia
- 3.7. Benelux
- 3.8. Nordics
- 3.9. Rest of Europe
-
4. Middle East & Africa
- 4.1. Turkey
- 4.2. Israel
- 4.3. GCC
- 4.4. North Africa
- 4.5. South Africa
- 4.6. Rest of Middle East & Africa
-
5. Asia Pacific
- 5.1. China
- 5.2. India
- 5.3. Japan
- 5.4. South Korea
- 5.5. ASEAN
- 5.6. Oceania
- 5.7. Rest of Asia Pacific
US Processed Meats Industry REPORT HIGHLIGHTS
| Aspects | Details |
|---|---|
| Study Period | 2019-2033 |
| Base Year | 2024 |
| Estimated Year | 2025 |
| Forecast Period | 2025-2033 |
| Historical Period | 2019-2024 |
| Growth Rate | CAGR of 7.45% from 2019-2033 |
| Segmentation |
|
Table of Contents
- 1. Introduction
- 1.1. Research Scope
- 1.2. Market Segmentation
- 1.3. Research Methodology
- 1.4. Definitions and Assumptions
- 2. Executive Summary
- 2.1. Introduction
- 3. Market Dynamics
- 3.1. Introduction
- 3.2. Market Drivers
- 3.2.1. Increasing Demand for Functional and Fortified Food; Multi-functionality and Wide Application of Riboflavin
- 3.3. Market Restrains
- 3.3.1. Low Stability of Riboflavin on Exposure to Light and Heat
- 3.4. Market Trends
- 3.4.1. OTHER KEY INDUSTRY TRENDS COVERED IN THE REPORT
- 4. Market Factor Analysis
- 4.1. Porters Five Forces
- 4.2. Supply/Value Chain
- 4.3. PESTEL analysis
- 4.4. Market Entropy
- 4.5. Patent/Trademark Analysis
- 5. Global US Processed Meats Industry Analysis, Insights and Forecast, 2019-2031
- 5.1. Market Analysis, Insights and Forecast - by Type
- 5.1.1. Beef
- 5.1.2. Mutton
- 5.1.3. Pork
- 5.1.4. Poultry
- 5.1.5. Other Meat
- 5.2. Market Analysis, Insights and Forecast - by Distribution Channel
- 5.2.1. Off-Trade
- 5.2.1.1. Convenience Stores
- 5.2.1.2. Online Channel
- 5.2.1.3. Supermarkets and Hypermarkets
- 5.2.1.4. Others
- 5.2.2. On-Trade
- 5.2.1. Off-Trade
- 5.3. Market Analysis, Insights and Forecast - by Region
- 5.3.1. North America
- 5.3.2. South America
- 5.3.3. Europe
- 5.3.4. Middle East & Africa
- 5.3.5. Asia Pacific
- 5.1. Market Analysis, Insights and Forecast - by Type
- 6. North America US Processed Meats Industry Analysis, Insights and Forecast, 2019-2031
- 6.1. Market Analysis, Insights and Forecast - by Type
- 6.1.1. Beef
- 6.1.2. Mutton
- 6.1.3. Pork
- 6.1.4. Poultry
- 6.1.5. Other Meat
- 6.2. Market Analysis, Insights and Forecast - by Distribution Channel
- 6.2.1. Off-Trade
- 6.2.1.1. Convenience Stores
- 6.2.1.2. Online Channel
- 6.2.1.3. Supermarkets and Hypermarkets
- 6.2.1.4. Others
- 6.2.2. On-Trade
- 6.2.1. Off-Trade
- 6.1. Market Analysis, Insights and Forecast - by Type
- 7. South America US Processed Meats Industry Analysis, Insights and Forecast, 2019-2031
- 7.1. Market Analysis, Insights and Forecast - by Type
- 7.1.1. Beef
- 7.1.2. Mutton
- 7.1.3. Pork
- 7.1.4. Poultry
- 7.1.5. Other Meat
- 7.2. Market Analysis, Insights and Forecast - by Distribution Channel
- 7.2.1. Off-Trade
- 7.2.1.1. Convenience Stores
- 7.2.1.2. Online Channel
- 7.2.1.3. Supermarkets and Hypermarkets
- 7.2.1.4. Others
- 7.2.2. On-Trade
- 7.2.1. Off-Trade
- 7.1. Market Analysis, Insights and Forecast - by Type
- 8. Europe US Processed Meats Industry Analysis, Insights and Forecast, 2019-2031
- 8.1. Market Analysis, Insights and Forecast - by Type
- 8.1.1. Beef
- 8.1.2. Mutton
- 8.1.3. Pork
- 8.1.4. Poultry
- 8.1.5. Other Meat
- 8.2. Market Analysis, Insights and Forecast - by Distribution Channel
- 8.2.1. Off-Trade
- 8.2.1.1. Convenience Stores
- 8.2.1.2. Online Channel
- 8.2.1.3. Supermarkets and Hypermarkets
- 8.2.1.4. Others
- 8.2.2. On-Trade
- 8.2.1. Off-Trade
- 8.1. Market Analysis, Insights and Forecast - by Type
- 9. Middle East & Africa US Processed Meats Industry Analysis, Insights and Forecast, 2019-2031
- 9.1. Market Analysis, Insights and Forecast - by Type
- 9.1.1. Beef
- 9.1.2. Mutton
- 9.1.3. Pork
- 9.1.4. Poultry
- 9.1.5. Other Meat
- 9.2. Market Analysis, Insights and Forecast - by Distribution Channel
- 9.2.1. Off-Trade
- 9.2.1.1. Convenience Stores
- 9.2.1.2. Online Channel
- 9.2.1.3. Supermarkets and Hypermarkets
- 9.2.1.4. Others
- 9.2.2. On-Trade
- 9.2.1. Off-Trade
- 9.1. Market Analysis, Insights and Forecast - by Type
- 10. Asia Pacific US Processed Meats Industry Analysis, Insights and Forecast, 2019-2031
- 10.1. Market Analysis, Insights and Forecast - by Type
- 10.1.1. Beef
- 10.1.2. Mutton
- 10.1.3. Pork
- 10.1.4. Poultry
- 10.1.5. Other Meat
- 10.2. Market Analysis, Insights and Forecast - by Distribution Channel
- 10.2.1. Off-Trade
- 10.2.1.1. Convenience Stores
- 10.2.1.2. Online Channel
- 10.2.1.3. Supermarkets and Hypermarkets
- 10.2.1.4. Others
- 10.2.2. On-Trade
- 10.2.1. Off-Trade
- 10.1. Market Analysis, Insights and Forecast - by Type
- 11. Northeast US Processed Meats Industry Analysis, Insights and Forecast, 2019-2031
- 12. Southeast US Processed Meats Industry Analysis, Insights and Forecast, 2019-2031
- 13. Midwest US Processed Meats Industry Analysis, Insights and Forecast, 2019-2031
- 14. Southwest US Processed Meats Industry Analysis, Insights and Forecast, 2019-2031
- 15. West US Processed Meats Industry Analysis, Insights and Forecast, 2019-2031
- 16. Competitive Analysis
- 16.1. Global Market Share Analysis 2024
- 16.2. Company Profiles
- 16.2.1 WH Group Limite
- 16.2.1.1. Overview
- 16.2.1.2. Products
- 16.2.1.3. SWOT Analysis
- 16.2.1.4. Recent Developments
- 16.2.1.5. Financials (Based on Availability)
- 16.2.2 Tyson Foods Inc
- 16.2.2.1. Overview
- 16.2.2.2. Products
- 16.2.2.3. SWOT Analysis
- 16.2.2.4. Recent Developments
- 16.2.2.5. Financials (Based on Availability)
- 16.2.3 BRF S A
- 16.2.3.1. Overview
- 16.2.3.2. Products
- 16.2.3.3. SWOT Analysis
- 16.2.3.4. Recent Developments
- 16.2.3.5. Financials (Based on Availability)
- 16.2.4 Conagra Brands Inc
- 16.2.4.1. Overview
- 16.2.4.2. Products
- 16.2.4.3. SWOT Analysis
- 16.2.4.4. Recent Developments
- 16.2.4.5. Financials (Based on Availability)
- 16.2.5 Sysco Corporation
- 16.2.5.1. Overview
- 16.2.5.2. Products
- 16.2.5.3. SWOT Analysis
- 16.2.5.4. Recent Developments
- 16.2.5.5. Financials (Based on Availability)
- 16.2.6 The Kraft Heinz Company
- 16.2.6.1. Overview
- 16.2.6.2. Products
- 16.2.6.3. SWOT Analysis
- 16.2.6.4. Recent Developments
- 16.2.6.5. Financials (Based on Availability)
- 16.2.7 Hormel Foods Corporation
- 16.2.7.1. Overview
- 16.2.7.2. Products
- 16.2.7.3. SWOT Analysis
- 16.2.7.4. Recent Developments
- 16.2.7.5. Financials (Based on Availability)
- 16.2.8 Cargill Inc
- 16.2.8.1. Overview
- 16.2.8.2. Products
- 16.2.8.3. SWOT Analysis
- 16.2.8.4. Recent Developments
- 16.2.8.5. Financials (Based on Availability)
- 16.2.9 Marfrig Global Foods S A
- 16.2.9.1. Overview
- 16.2.9.2. Products
- 16.2.9.3. SWOT Analysis
- 16.2.9.4. Recent Developments
- 16.2.9.5. Financials (Based on Availability)
- 16.2.10 Maple Leaf Foods
- 16.2.10.1. Overview
- 16.2.10.2. Products
- 16.2.10.3. SWOT Analysis
- 16.2.10.4. Recent Developments
- 16.2.10.5. Financials (Based on Availability)
- 16.2.11 JBS SA
- 16.2.11.1. Overview
- 16.2.11.2. Products
- 16.2.11.3. SWOT Analysis
- 16.2.11.4. Recent Developments
- 16.2.11.5. Financials (Based on Availability)
- 16.2.1 WH Group Limite
List of Figures
- Figure 1: Global US Processed Meats Industry Revenue Breakdown (Million, %) by Region 2024 & 2032
- Figure 2: United states US Processed Meats Industry Revenue (Million), by Country 2024 & 2032
- Figure 3: United states US Processed Meats Industry Revenue Share (%), by Country 2024 & 2032
- Figure 4: North America US Processed Meats Industry Revenue (Million), by Type 2024 & 2032
- Figure 5: North America US Processed Meats Industry Revenue Share (%), by Type 2024 & 2032
- Figure 6: North America US Processed Meats Industry Revenue (Million), by Distribution Channel 2024 & 2032
- Figure 7: North America US Processed Meats Industry Revenue Share (%), by Distribution Channel 2024 & 2032
- Figure 8: North America US Processed Meats Industry Revenue (Million), by Country 2024 & 2032
- Figure 9: North America US Processed Meats Industry Revenue Share (%), by Country 2024 & 2032
- Figure 10: South America US Processed Meats Industry Revenue (Million), by Type 2024 & 2032
- Figure 11: South America US Processed Meats Industry Revenue Share (%), by Type 2024 & 2032
- Figure 12: South America US Processed Meats Industry Revenue (Million), by Distribution Channel 2024 & 2032
- Figure 13: South America US Processed Meats Industry Revenue Share (%), by Distribution Channel 2024 & 2032
- Figure 14: South America US Processed Meats Industry Revenue (Million), by Country 2024 & 2032
- Figure 15: South America US Processed Meats Industry Revenue Share (%), by Country 2024 & 2032
- Figure 16: Europe US Processed Meats Industry Revenue (Million), by Type 2024 & 2032
- Figure 17: Europe US Processed Meats Industry Revenue Share (%), by Type 2024 & 2032
- Figure 18: Europe US Processed Meats Industry Revenue (Million), by Distribution Channel 2024 & 2032
- Figure 19: Europe US Processed Meats Industry Revenue Share (%), by Distribution Channel 2024 & 2032
- Figure 20: Europe US Processed Meats Industry Revenue (Million), by Country 2024 & 2032
- Figure 21: Europe US Processed Meats Industry Revenue Share (%), by Country 2024 & 2032
- Figure 22: Middle East & Africa US Processed Meats Industry Revenue (Million), by Type 2024 & 2032
- Figure 23: Middle East & Africa US Processed Meats Industry Revenue Share (%), by Type 2024 & 2032
- Figure 24: Middle East & Africa US Processed Meats Industry Revenue (Million), by Distribution Channel 2024 & 2032
- Figure 25: Middle East & Africa US Processed Meats Industry Revenue Share (%), by Distribution Channel 2024 & 2032
- Figure 26: Middle East & Africa US Processed Meats Industry Revenue (Million), by Country 2024 & 2032
- Figure 27: Middle East & Africa US Processed Meats Industry Revenue Share (%), by Country 2024 & 2032
- Figure 28: Asia Pacific US Processed Meats Industry Revenue (Million), by Type 2024 & 2032
- Figure 29: Asia Pacific US Processed Meats Industry Revenue Share (%), by Type 2024 & 2032
- Figure 30: Asia Pacific US Processed Meats Industry Revenue (Million), by Distribution Channel 2024 & 2032
- Figure 31: Asia Pacific US Processed Meats Industry Revenue Share (%), by Distribution Channel 2024 & 2032
- Figure 32: Asia Pacific US Processed Meats Industry Revenue (Million), by Country 2024 & 2032
- Figure 33: Asia Pacific US Processed Meats Industry Revenue Share (%), by Country 2024 & 2032
List of Tables
- Table 1: Global US Processed Meats Industry Revenue Million Forecast, by Region 2019 & 2032
- Table 2: Global US Processed Meats Industry Revenue Million Forecast, by Type 2019 & 2032
- Table 3: Global US Processed Meats Industry Revenue Million Forecast, by Distribution Channel 2019 & 2032
- Table 4: Global US Processed Meats Industry Revenue Million Forecast, by Region 2019 & 2032
- Table 5: Global US Processed Meats Industry Revenue Million Forecast, by Country 2019 & 2032
- Table 6: Northeast US Processed Meats Industry Revenue (Million) Forecast, by Application 2019 & 2032
- Table 7: Southeast US Processed Meats Industry Revenue (Million) Forecast, by Application 2019 & 2032
- Table 8: Midwest US Processed Meats Industry Revenue (Million) Forecast, by Application 2019 & 2032
- Table 9: Southwest US Processed Meats Industry Revenue (Million) Forecast, by Application 2019 & 2032
- Table 10: West US Processed Meats Industry Revenue (Million) Forecast, by Application 2019 & 2032
- Table 11: Global US Processed Meats Industry Revenue Million Forecast, by Type 2019 & 2032
- Table 12: Global US Processed Meats Industry Revenue Million Forecast, by Distribution Channel 2019 & 2032
- Table 13: Global US Processed Meats Industry Revenue Million Forecast, by Country 2019 & 2032
- Table 14: United States US Processed Meats Industry Revenue (Million) Forecast, by Application 2019 & 2032
- Table 15: Canada US Processed Meats Industry Revenue (Million) Forecast, by Application 2019 & 2032
- Table 16: Mexico US Processed Meats Industry Revenue (Million) Forecast, by Application 2019 & 2032
- Table 17: Global US Processed Meats Industry Revenue Million Forecast, by Type 2019 & 2032
- Table 18: Global US Processed Meats Industry Revenue Million Forecast, by Distribution Channel 2019 & 2032
- Table 19: Global US Processed Meats Industry Revenue Million Forecast, by Country 2019 & 2032
- Table 20: Brazil US Processed Meats Industry Revenue (Million) Forecast, by Application 2019 & 2032
- Table 21: Argentina US Processed Meats Industry Revenue (Million) Forecast, by Application 2019 & 2032
- Table 22: Rest of South America US Processed Meats Industry Revenue (Million) Forecast, by Application 2019 & 2032
- Table 23: Global US Processed Meats Industry Revenue Million Forecast, by Type 2019 & 2032
- Table 24: Global US Processed Meats Industry Revenue Million Forecast, by Distribution Channel 2019 & 2032
- Table 25: Global US Processed Meats Industry Revenue Million Forecast, by Country 2019 & 2032
- Table 26: United Kingdom US Processed Meats Industry Revenue (Million) Forecast, by Application 2019 & 2032
- Table 27: Germany US Processed Meats Industry Revenue (Million) Forecast, by Application 2019 & 2032
- Table 28: France US Processed Meats Industry Revenue (Million) Forecast, by Application 2019 & 2032
- Table 29: Italy US Processed Meats Industry Revenue (Million) Forecast, by Application 2019 & 2032
- Table 30: Spain US Processed Meats Industry Revenue (Million) Forecast, by Application 2019 & 2032
- Table 31: Russia US Processed Meats Industry Revenue (Million) Forecast, by Application 2019 & 2032
- Table 32: Benelux US Processed Meats Industry Revenue (Million) Forecast, by Application 2019 & 2032
- Table 33: Nordics US Processed Meats Industry Revenue (Million) Forecast, by Application 2019 & 2032
- Table 34: Rest of Europe US Processed Meats Industry Revenue (Million) Forecast, by Application 2019 & 2032
- Table 35: Global US Processed Meats Industry Revenue Million Forecast, by Type 2019 & 2032
- Table 36: Global US Processed Meats Industry Revenue Million Forecast, by Distribution Channel 2019 & 2032
- Table 37: Global US Processed Meats Industry Revenue Million Forecast, by Country 2019 & 2032
- Table 38: Turkey US Processed Meats Industry Revenue (Million) Forecast, by Application 2019 & 2032
- Table 39: Israel US Processed Meats Industry Revenue (Million) Forecast, by Application 2019 & 2032
- Table 40: GCC US Processed Meats Industry Revenue (Million) Forecast, by Application 2019 & 2032
- Table 41: North Africa US Processed Meats Industry Revenue (Million) Forecast, by Application 2019 & 2032
- Table 42: South Africa US Processed Meats Industry Revenue (Million) Forecast, by Application 2019 & 2032
- Table 43: Rest of Middle East & Africa US Processed Meats Industry Revenue (Million) Forecast, by Application 2019 & 2032
- Table 44: Global US Processed Meats Industry Revenue Million Forecast, by Type 2019 & 2032
- Table 45: Global US Processed Meats Industry Revenue Million Forecast, by Distribution Channel 2019 & 2032
- Table 46: Global US Processed Meats Industry Revenue Million Forecast, by Country 2019 & 2032
- Table 47: China US Processed Meats Industry Revenue (Million) Forecast, by Application 2019 & 2032
- Table 48: India US Processed Meats Industry Revenue (Million) Forecast, by Application 2019 & 2032
- Table 49: Japan US Processed Meats Industry Revenue (Million) Forecast, by Application 2019 & 2032
- Table 50: South Korea US Processed Meats Industry Revenue (Million) Forecast, by Application 2019 & 2032
- Table 51: ASEAN US Processed Meats Industry Revenue (Million) Forecast, by Application 2019 & 2032
- Table 52: Oceania US Processed Meats Industry Revenue (Million) Forecast, by Application 2019 & 2032
- Table 53: Rest of Asia Pacific US Processed Meats Industry Revenue (Million) Forecast, by Application 2019 & 2032
Frequently Asked Questions
1. What is the projected Compound Annual Growth Rate (CAGR) of the US Processed Meats Industry?
The projected CAGR is approximately 7.45%.
2. Which companies are prominent players in the US Processed Meats Industry?
Key companies in the market include WH Group Limite, Tyson Foods Inc, BRF S A, Conagra Brands Inc, Sysco Corporation, The Kraft Heinz Company, Hormel Foods Corporation, Cargill Inc, Marfrig Global Foods S A, Maple Leaf Foods, JBS SA.
3. What are the main segments of the US Processed Meats Industry?
The market segments include Type, Distribution Channel.
4. Can you provide details about the market size?
The market size is estimated to be USD XX Million as of 2022.
5. What are some drivers contributing to market growth?
Increasing Demand for Functional and Fortified Food; Multi-functionality and Wide Application of Riboflavin.
6. What are the notable trends driving market growth?
OTHER KEY INDUSTRY TRENDS COVERED IN THE REPORT.
7. Are there any restraints impacting market growth?
Low Stability of Riboflavin on Exposure to Light and Heat.
8. Can you provide examples of recent developments in the market?
May 2023: Tyson Foods Claryville announced its newly expanded cocktail sausage manufacturing capacity, allowing the company to meet high customer demand for its Hillshire Farm brand products. This USD 83 million expansion will add 15,000 square feet to its 342,000 square foot facility and state-of-the-art equipment to increase production by 50% to better serve customers.April 2023: The makers of the HERDEZ® brand announced the launch of its HERDEZ™ Mexican Refrigerated Entrées line with two delicious varieties, including HERDEZ™ Chicken Shredded in Mild Chipotle Sauce and HERDEZ™ Carnitas Slow Cooked Pork.March 2023: Tyson® brand introduces chicken sandwiches and sliders, bringing restaurant-quality taste to home. The new Tyson Chicken Breast Sandwiches and Sliders are available in Original and Spicy. The new product is available in the frozen snacks section at retailers nationwide.
9. What pricing options are available for accessing the report?
Pricing options include single-user, multi-user, and enterprise licenses priced at USD 3800, USD 4500, and USD 5800 respectively.
10. Is the market size provided in terms of value or volume?
The market size is provided in terms of value, measured in Million.
11. Are there any specific market keywords associated with the report?
Yes, the market keyword associated with the report is "US Processed Meats Industry," which aids in identifying and referencing the specific market segment covered.
12. How do I determine which pricing option suits my needs best?
The pricing options vary based on user requirements and access needs. Individual users may opt for single-user licenses, while businesses requiring broader access may choose multi-user or enterprise licenses for cost-effective access to the report.
13. Are there any additional resources or data provided in the US Processed Meats Industry report?
While the report offers comprehensive insights, it's advisable to review the specific contents or supplementary materials provided to ascertain if additional resources or data are available.
14. How can I stay updated on further developments or reports in the US Processed Meats Industry?
To stay informed about further developments, trends, and reports in the US Processed Meats Industry, consider subscribing to industry newsletters, following relevant companies and organizations, or regularly checking reputable industry news sources and publications.
Methodology
Step 1 - Identification of Relevant Samples Size from Population Database


Step 2 - Approaches for Defining Global Market Size (Value, Volume* & Price*)

Note*: In applicable scenarios
Step 3 - Data Sources
Primary Research
- Web Analytics
- Survey Reports
- Research Institute
- Latest Research Reports
- Opinion Leaders
Secondary Research
- Annual Reports
- White Paper
- Latest Press Release
- Industry Association
- Paid Database
- Investor Presentations

Step 4 - Data Triangulation
Involves using different sources of information in order to increase the validity of a study
These sources are likely to be stakeholders in a program - participants, other researchers, program staff, other community members, and so on.
Then we put all data in single framework & apply various statistical tools to find out the dynamic on the market.
During the analysis stage, feedback from the stakeholder groups would be compared to determine areas of agreement as well as areas of divergence
