

Key Insights
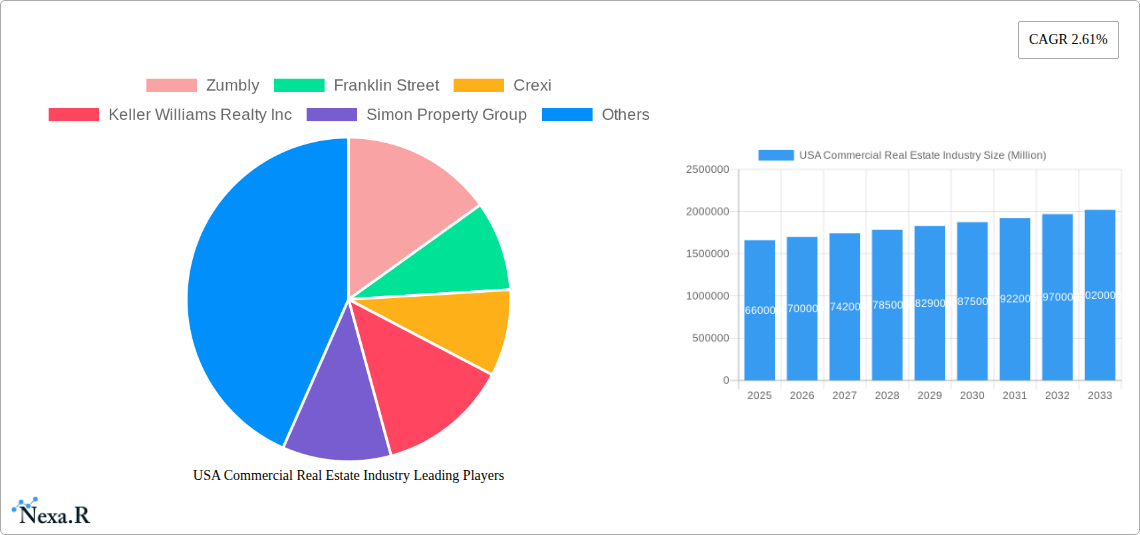
The US commercial real estate (CRE) market, valued at $1.66 trillion in 2025, is projected to experience steady growth with a Compound Annual Growth Rate (CAGR) of 2.61% from 2025 to 2033. This growth is fueled by several key factors. Increasing urbanization and population growth, particularly in major metropolitan areas like New York, Los Angeles, and Chicago, drive demand for office, retail, and multi-family spaces. The ongoing expansion of e-commerce continues to fuel the logistics and industrial sectors, creating a significant need for warehouse and distribution facilities. Furthermore, a robust economy and increased investment in infrastructure projects further contribute to market expansion. However, potential headwinds exist. Rising interest rates and inflation could curb investment and development activity. Furthermore, shifts in remote work patterns could impact the demand for traditional office spaces, necessitating adaptability within the CRE sector. The market is segmented by property type (offices, retail, industrial, logistics, multi-family, hospitality) and key cities, reflecting geographical variations in growth rates and investment opportunities. Competition is fierce, with established players like Simon Property Group and Keller Williams Realty Inc. alongside emerging firms like Zumbly and Crexi vying for market share. Understanding these dynamics is crucial for investors, developers, and businesses navigating this evolving landscape.
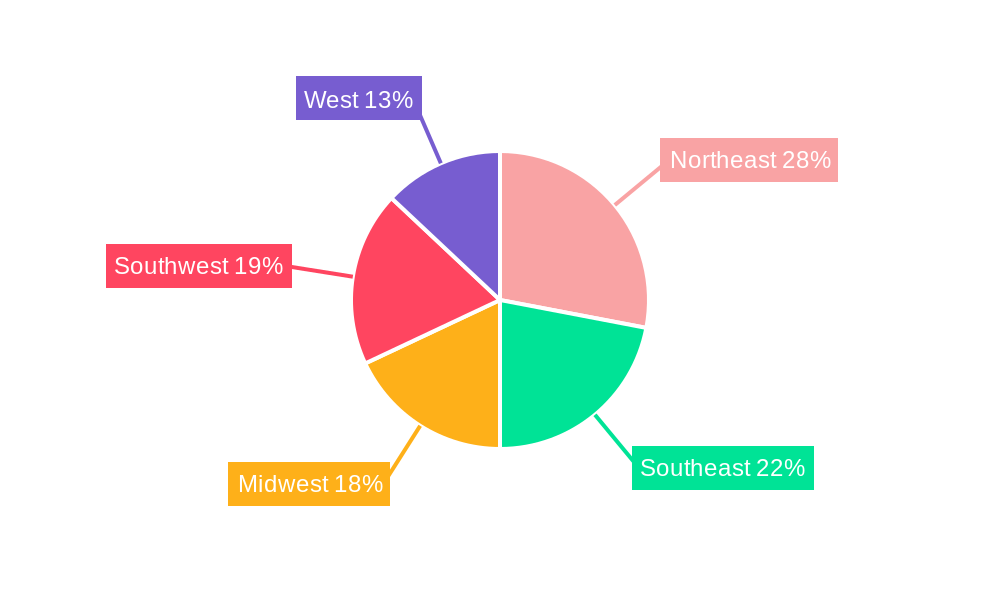
The diverse nature of the CRE market necessitates a nuanced approach to investment and development strategies. Regional variations in growth prospects, influenced by factors such as local economic conditions and regulatory environments, necessitate region-specific analyses. The Northeast, benefiting from strong tech and finance sectors, is anticipated to exhibit robust growth, while other regions might experience moderate expansion based on specific industry clusters. Strategic partnerships, technological innovations (such as proptech solutions), and a focus on sustainability are likely to become increasingly important for companies aiming to gain a competitive edge in this dynamic market. The forecast period, 2025-2033, presents significant opportunities and challenges, demanding proactive strategies to mitigate risks and capitalize on emerging trends. A thorough understanding of the market’s segmentation, competitive landscape, and potential macroeconomic shifts is paramount for successful navigation of the US commercial real estate sector.
USA Commercial Real Estate Industry: 2019-2033 Market Report
This comprehensive report provides an in-depth analysis of the USA Commercial Real Estate industry from 2019 to 2033, offering invaluable insights for investors, developers, and industry professionals. We delve into market dynamics, growth trends, key players, and emerging opportunities across various segments and major cities. The report utilizes data from 2019-2024 (Historical Period), with a base year of 2025 and a forecast period spanning 2025-2033. Key segments analyzed include Offices, Retail, Industrial, Logistics, Multi-family, and Hospitality, across major cities like New York, Chicago, Los Angeles, San Francisco, Boston, Denver, Houston, Phoenix, Atlanta, and Salt Lake City. The report’s quantitative analysis is supported by qualitative insights, offering a holistic understanding of this dynamic market.
This report is perfect for those looking for detailed information on the parent market (Commercial Real Estate) and its child markets (Offices, Retail, etc.)
USA Commercial Real Estate Industry Market Dynamics & Structure
The US commercial real estate market exhibits a moderately concentrated structure with a few large players and many smaller firms. Technological innovation, particularly in property management software (like HqO) and proptech platforms (like Crexi and Zumbly), is significantly reshaping the landscape. Regulatory frameworks, including zoning laws and environmental regulations, exert considerable influence, while factors like interest rates and economic cycles significantly impact investment decisions. Substitute products (e.g., flexible workspaces impacting office demand) pose a challenge. End-user demographics, such as shifts in remote work patterns and evolving retail preferences, are key drivers of segment-specific growth. M&A activity remains robust, with an estimated xx million deals concluded in 2024, indicating industry consolidation.
- Market Concentration: Moderately concentrated, with top 5 players holding approximately xx% market share (2024).
- Technological Innovation: Proptech adoption accelerating, impacting property valuation, leasing, and management.
- Regulatory Framework: Zoning regulations and environmental concerns influence development projects.
- Competitive Substitutes: Rise of co-working spaces and e-commerce affecting traditional office and retail segments.
- End-User Demographics: Shifting work patterns and consumer behavior influence demand across segments.
- M&A Trends: Significant M&A activity, with xx million deals estimated in 2024.
USA Commercial Real Estate Industry Growth Trends & Insights
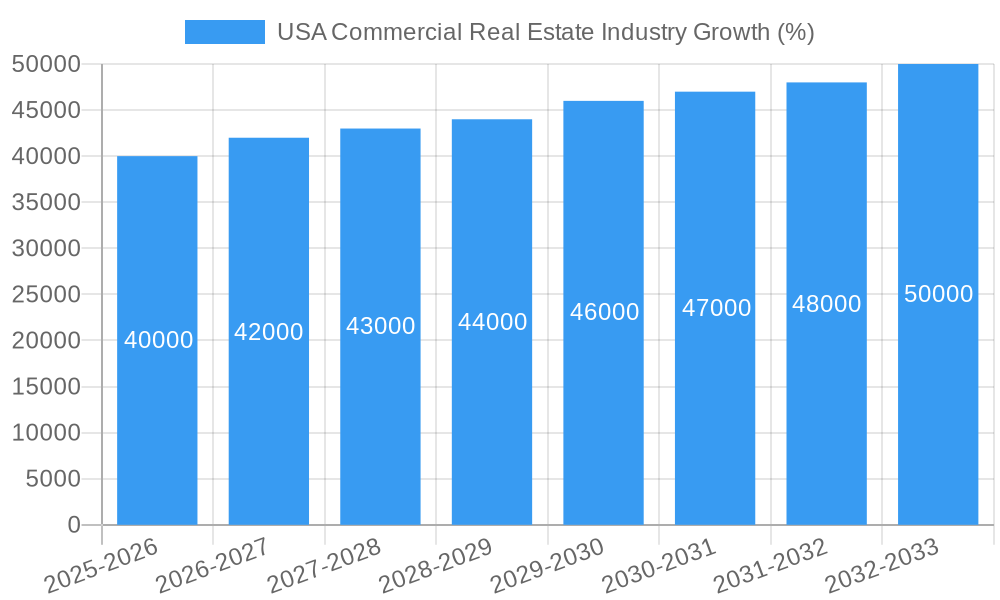
The US commercial real estate market experienced substantial growth during the historical period (2019-2024), influenced by factors such as low interest rates and a robust economy. However, the market faced disruption in 2020 and 2021 due to the pandemic. The market's recovery has shown strong signs, with increasing demand for industrial and logistics spaces, fueled by e-commerce growth. Office space demand, initially impacted by remote work trends, shows signs of recovery as hybrid work models become prevalent. Retail is undergoing transformation, with experience-driven concepts gaining popularity. The multi-family sector remains robust, underpinned by population growth and urbanization. We project a CAGR of xx% for the overall market between 2025 and 2033, with specific segments exhibiting varied growth trajectories. Technological disruption continues to accelerate, impacting efficiency and operational costs. Consumer behavior shifts, including heightened demand for sustainable and technologically advanced spaces, further shape market trends.
Dominant Regions, Countries, or Segments in USA Commercial Real Estate Industry
New York, Los Angeles, and Chicago remain dominant cities in the US commercial real estate market, due to their strong economies, large populations, and established infrastructure. The industrial/logistics segment showcases exceptional growth, driven by e-commerce expansion and supply chain optimization needs. Multi-family housing continues to be a significant area of investment, fueled by strong population growth and limited housing supply.
Key Drivers:
- Strong economic activity in major metropolitan areas.
- Robust infrastructure supporting commercial development.
- Increased demand for logistics space driven by e-commerce.
- High population growth in major cities leading to increased housing demand.
- Favorable government policies and incentives for development.
Dominance Factors:
- High rental yields and property values.
- Large and diverse tenant base.
- Strategic location and accessibility.
- Existing infrastructure and robust market liquidity.
USA Commercial Real Estate Industry Product Landscape
The product landscape is characterized by a diverse range of offerings, from traditional office and retail spaces to specialized logistics facilities and high-tech multi-family developments. Innovations focus on sustainability, technology integration (smart buildings), and enhanced user experiences (e.g., flexible workspaces). Performance metrics increasingly emphasize energy efficiency, occupancy rates, and return on investment. Many firms leverage data analytics to optimize operations and decision-making.
Key Drivers, Barriers & Challenges in USA Commercial Real Estate Industry
Key Drivers:
- Strong economic growth and population increase drive demand across segments.
- Technological advancements enhance efficiency and operational capabilities.
- Government incentives and supportive policies encourage development.
Key Challenges:
- Supply chain disruptions impacting construction timelines and material costs, estimated at a xx million dollar impact in 2024.
- Regulatory hurdles and permitting processes create delays and increase costs.
- Intense competition among developers and investors exerts downward pressure on returns.
Emerging Opportunities in USA Commercial Real Estate Industry
- Growing demand for sustainable and energy-efficient buildings.
- Expansion into emerging markets and secondary cities.
- Increased focus on flexible workspaces and co-working spaces.
- Growing demand for specialized facilities in the logistics and healthcare sectors.
- Adoption of innovative technologies like PropTech to optimize processes and enhance tenant experience.
Growth Accelerators in the USA Commercial Real Estate Industry Industry
Technological advancements, particularly in building management systems and data analytics, are significantly boosting efficiency and operational performance. Strategic partnerships between developers, technology firms, and investors drive innovation and market expansion. Government initiatives promoting sustainable development create new opportunities for environmentally conscious projects. The increasing adoption of flexible work models fuels demand for adaptable office spaces.
Key Players Shaping the USA Commercial Real Estate Industry Market
- Zumbly
- Franklin Street
- Crexi
- Keller Williams Realty Inc
- Simon Property Group
- Hightower
- Mohr Partners
- Lamudi
- Coldwell Banker
- ERA Real Estate
- RE/MAX
- John Propp Commercial Group
- HqO
- Century
- Progressive Real Estate Partners
- Shannon-Waltchack
Notable Milestones in USA Commercial Real Estate Industry Sector
- 2020, Q2: Significant downturn in commercial real estate activity due to the COVID-19 pandemic.
- 2021, Q4: Gradual recovery begins, with increased demand in industrial and logistics segments.
- 2022, Q3: Rise in interest rates impact investment decisions and construction starts.
- 2023, Q1: Increased adoption of PropTech solutions across various segments.
In-Depth USA Commercial Real Estate Industry Market Outlook
The US commercial real estate market presents significant long-term growth potential, driven by continued population growth, technological innovation, and evolving consumer preferences. Strategic investment in sustainable and technologically advanced projects will be crucial for success. The market is expected to continue its consolidation, with larger players acquiring smaller firms. Emerging trends in flexible workspaces, e-commerce, and the demand for specialized facilities offer further growth opportunities. The forecast period (2025-2033) anticipates consistent, albeit moderated, growth compared to the pre-pandemic period, driven by a variety of macroeconomic and technological factors.
USA Commercial Real Estate Industry Segmentation
-
1. Type
- 1.1. Offices
- 1.2. Retail
- 1.3. Industrial
- 1.4. Logistics
- 1.5. Multi-family
- 1.6. Hospitality
-
2. Key City
- 2.1. New York
- 2.2. Chicago
- 2.3. Los Angeles
- 2.4. San Francisco
- 2.5. Boston
- 2.6. Denver
- 2.7. Houston
- 2.8. Phoenix
- 2.9. Atlanta
- 2.10. Salt Lake City
USA Commercial Real Estate Industry Segmentation By Geography
-
1. North America
- 1.1. United States
- 1.2. Canada
- 1.3. Mexico
-
2. South America
- 2.1. Brazil
- 2.2. Argentina
- 2.3. Rest of South America
-
3. Europe
- 3.1. United Kingdom
- 3.2. Germany
- 3.3. France
- 3.4. Italy
- 3.5. Spain
- 3.6. Russia
- 3.7. Benelux
- 3.8. Nordics
- 3.9. Rest of Europe
-
4. Middle East & Africa
- 4.1. Turkey
- 4.2. Israel
- 4.3. GCC
- 4.4. North Africa
- 4.5. South Africa
- 4.6. Rest of Middle East & Africa
-
5. Asia Pacific
- 5.1. China
- 5.2. India
- 5.3. Japan
- 5.4. South Korea
- 5.5. ASEAN
- 5.6. Oceania
- 5.7. Rest of Asia Pacific
USA Commercial Real Estate Industry REPORT HIGHLIGHTS
| Aspects | Details |
|---|---|
| Study Period | 2019-2033 |
| Base Year | 2024 |
| Estimated Year | 2025 |
| Forecast Period | 2025-2033 |
| Historical Period | 2019-2024 |
| Growth Rate | CAGR of 2.61% from 2019-2033 |
| Segmentation |
|
Table of Contents
- 1. Introduction
- 1.1. Research Scope
- 1.2. Market Segmentation
- 1.3. Research Methodology
- 1.4. Definitions and Assumptions
- 2. Executive Summary
- 2.1. Introduction
- 3. Market Dynamics
- 3.1. Introduction
- 3.2. Market Drivers
- 3.2.1. Increasing number of startups
- 3.3. Market Restrains
- 3.3.1. Low Awareness and Privacy Issues
- 3.4. Market Trends
- 3.4.1. Industrial Sector Expected to Record High Demand
- 4. Market Factor Analysis
- 4.1. Porters Five Forces
- 4.2. Supply/Value Chain
- 4.3. PESTEL analysis
- 4.4. Market Entropy
- 4.5. Patent/Trademark Analysis
- 5. Global USA Commercial Real Estate Industry Analysis, Insights and Forecast, 2019-2031
- 5.1. Market Analysis, Insights and Forecast - by Type
- 5.1.1. Offices
- 5.1.2. Retail
- 5.1.3. Industrial
- 5.1.4. Logistics
- 5.1.5. Multi-family
- 5.1.6. Hospitality
- 5.2. Market Analysis, Insights and Forecast - by Key City
- 5.2.1. New York
- 5.2.2. Chicago
- 5.2.3. Los Angeles
- 5.2.4. San Francisco
- 5.2.5. Boston
- 5.2.6. Denver
- 5.2.7. Houston
- 5.2.8. Phoenix
- 5.2.9. Atlanta
- 5.2.10. Salt Lake City
- 5.3. Market Analysis, Insights and Forecast - by Region
- 5.3.1. North America
- 5.3.2. South America
- 5.3.3. Europe
- 5.3.4. Middle East & Africa
- 5.3.5. Asia Pacific
- 5.1. Market Analysis, Insights and Forecast - by Type
- 6. North America USA Commercial Real Estate Industry Analysis, Insights and Forecast, 2019-2031
- 6.1. Market Analysis, Insights and Forecast - by Type
- 6.1.1. Offices
- 6.1.2. Retail
- 6.1.3. Industrial
- 6.1.4. Logistics
- 6.1.5. Multi-family
- 6.1.6. Hospitality
- 6.2. Market Analysis, Insights and Forecast - by Key City
- 6.2.1. New York
- 6.2.2. Chicago
- 6.2.3. Los Angeles
- 6.2.4. San Francisco
- 6.2.5. Boston
- 6.2.6. Denver
- 6.2.7. Houston
- 6.2.8. Phoenix
- 6.2.9. Atlanta
- 6.2.10. Salt Lake City
- 6.1. Market Analysis, Insights and Forecast - by Type
- 7. South America USA Commercial Real Estate Industry Analysis, Insights and Forecast, 2019-2031
- 7.1. Market Analysis, Insights and Forecast - by Type
- 7.1.1. Offices
- 7.1.2. Retail
- 7.1.3. Industrial
- 7.1.4. Logistics
- 7.1.5. Multi-family
- 7.1.6. Hospitality
- 7.2. Market Analysis, Insights and Forecast - by Key City
- 7.2.1. New York
- 7.2.2. Chicago
- 7.2.3. Los Angeles
- 7.2.4. San Francisco
- 7.2.5. Boston
- 7.2.6. Denver
- 7.2.7. Houston
- 7.2.8. Phoenix
- 7.2.9. Atlanta
- 7.2.10. Salt Lake City
- 7.1. Market Analysis, Insights and Forecast - by Type
- 8. Europe USA Commercial Real Estate Industry Analysis, Insights and Forecast, 2019-2031
- 8.1. Market Analysis, Insights and Forecast - by Type
- 8.1.1. Offices
- 8.1.2. Retail
- 8.1.3. Industrial
- 8.1.4. Logistics
- 8.1.5. Multi-family
- 8.1.6. Hospitality
- 8.2. Market Analysis, Insights and Forecast - by Key City
- 8.2.1. New York
- 8.2.2. Chicago
- 8.2.3. Los Angeles
- 8.2.4. San Francisco
- 8.2.5. Boston
- 8.2.6. Denver
- 8.2.7. Houston
- 8.2.8. Phoenix
- 8.2.9. Atlanta
- 8.2.10. Salt Lake City
- 8.1. Market Analysis, Insights and Forecast - by Type
- 9. Middle East & Africa USA Commercial Real Estate Industry Analysis, Insights and Forecast, 2019-2031
- 9.1. Market Analysis, Insights and Forecast - by Type
- 9.1.1. Offices
- 9.1.2. Retail
- 9.1.3. Industrial
- 9.1.4. Logistics
- 9.1.5. Multi-family
- 9.1.6. Hospitality
- 9.2. Market Analysis, Insights and Forecast - by Key City
- 9.2.1. New York
- 9.2.2. Chicago
- 9.2.3. Los Angeles
- 9.2.4. San Francisco
- 9.2.5. Boston
- 9.2.6. Denver
- 9.2.7. Houston
- 9.2.8. Phoenix
- 9.2.9. Atlanta
- 9.2.10. Salt Lake City
- 9.1. Market Analysis, Insights and Forecast - by Type
- 10. Asia Pacific USA Commercial Real Estate Industry Analysis, Insights and Forecast, 2019-2031
- 10.1. Market Analysis, Insights and Forecast - by Type
- 10.1.1. Offices
- 10.1.2. Retail
- 10.1.3. Industrial
- 10.1.4. Logistics
- 10.1.5. Multi-family
- 10.1.6. Hospitality
- 10.2. Market Analysis, Insights and Forecast - by Key City
- 10.2.1. New York
- 10.2.2. Chicago
- 10.2.3. Los Angeles
- 10.2.4. San Francisco
- 10.2.5. Boston
- 10.2.6. Denver
- 10.2.7. Houston
- 10.2.8. Phoenix
- 10.2.9. Atlanta
- 10.2.10. Salt Lake City
- 10.1. Market Analysis, Insights and Forecast - by Type
- 11. Northeast USA Commercial Real Estate Industry Analysis, Insights and Forecast, 2019-2031
- 12. Southeast USA Commercial Real Estate Industry Analysis, Insights and Forecast, 2019-2031
- 13. Midwest USA Commercial Real Estate Industry Analysis, Insights and Forecast, 2019-2031
- 14. Southwest USA Commercial Real Estate Industry Analysis, Insights and Forecast, 2019-2031
- 15. West USA Commercial Real Estate Industry Analysis, Insights and Forecast, 2019-2031
- 16. Competitive Analysis
- 16.1. Global Market Share Analysis 2024
- 16.2. Company Profiles
- 16.2.1 Zumbly
- 16.2.1.1. Overview
- 16.2.1.2. Products
- 16.2.1.3. SWOT Analysis
- 16.2.1.4. Recent Developments
- 16.2.1.5. Financials (Based on Availability)
- 16.2.2 Franklin Street
- 16.2.2.1. Overview
- 16.2.2.2. Products
- 16.2.2.3. SWOT Analysis
- 16.2.2.4. Recent Developments
- 16.2.2.5. Financials (Based on Availability)
- 16.2.3 Crexi
- 16.2.3.1. Overview
- 16.2.3.2. Products
- 16.2.3.3. SWOT Analysis
- 16.2.3.4. Recent Developments
- 16.2.3.5. Financials (Based on Availability)
- 16.2.4 Keller Williams Realty Inc
- 16.2.4.1. Overview
- 16.2.4.2. Products
- 16.2.4.3. SWOT Analysis
- 16.2.4.4. Recent Developments
- 16.2.4.5. Financials (Based on Availability)
- 16.2.5 Simon Property Group
- 16.2.5.1. Overview
- 16.2.5.2. Products
- 16.2.5.3. SWOT Analysis
- 16.2.5.4. Recent Developments
- 16.2.5.5. Financials (Based on Availability)
- 16.2.6 Hightower
- 16.2.6.1. Overview
- 16.2.6.2. Products
- 16.2.6.3. SWOT Analysis
- 16.2.6.4. Recent Developments
- 16.2.6.5. Financials (Based on Availability)
- 16.2.7 Mohr Partners
- 16.2.7.1. Overview
- 16.2.7.2. Products
- 16.2.7.3. SWOT Analysis
- 16.2.7.4. Recent Developments
- 16.2.7.5. Financials (Based on Availability)
- 16.2.8 Lamudi
- 16.2.8.1. Overview
- 16.2.8.2. Products
- 16.2.8.3. SWOT Analysis
- 16.2.8.4. Recent Developments
- 16.2.8.5. Financials (Based on Availability)
- 16.2.9 Coldwell Banker
- 16.2.9.1. Overview
- 16.2.9.2. Products
- 16.2.9.3. SWOT Analysis
- 16.2.9.4. Recent Developments
- 16.2.9.5. Financials (Based on Availability)
- 16.2.10 ERA Real Estate
- 16.2.10.1. Overview
- 16.2.10.2. Products
- 16.2.10.3. SWOT Analysis
- 16.2.10.4. Recent Developments
- 16.2.10.5. Financials (Based on Availability)
- 16.2.11 RE/MAX
- 16.2.11.1. Overview
- 16.2.11.2. Products
- 16.2.11.3. SWOT Analysis
- 16.2.11.4. Recent Developments
- 16.2.11.5. Financials (Based on Availability)
- 16.2.12 John Propp Commercial Group
- 16.2.12.1. Overview
- 16.2.12.2. Products
- 16.2.12.3. SWOT Analysis
- 16.2.12.4. Recent Developments
- 16.2.12.5. Financials (Based on Availability)
- 16.2.13 HqO**List Not Exhaustive
- 16.2.13.1. Overview
- 16.2.13.2. Products
- 16.2.13.3. SWOT Analysis
- 16.2.13.4. Recent Developments
- 16.2.13.5. Financials (Based on Availability)
- 16.2.14 Century
- 16.2.14.1. Overview
- 16.2.14.2. Products
- 16.2.14.3. SWOT Analysis
- 16.2.14.4. Recent Developments
- 16.2.14.5. Financials (Based on Availability)
- 16.2.15 Progressive Real Estate Partners
- 16.2.15.1. Overview
- 16.2.15.2. Products
- 16.2.15.3. SWOT Analysis
- 16.2.15.4. Recent Developments
- 16.2.15.5. Financials (Based on Availability)
- 16.2.16 Shannon-Waltchack
- 16.2.16.1. Overview
- 16.2.16.2. Products
- 16.2.16.3. SWOT Analysis
- 16.2.16.4. Recent Developments
- 16.2.16.5. Financials (Based on Availability)
- 16.2.1 Zumbly
List of Figures
- Figure 1: Global USA Commercial Real Estate Industry Revenue Breakdown (Million, %) by Region 2024 & 2032
- Figure 2: United states USA Commercial Real Estate Industry Revenue (Million), by Country 2024 & 2032
- Figure 3: United states USA Commercial Real Estate Industry Revenue Share (%), by Country 2024 & 2032
- Figure 4: North America USA Commercial Real Estate Industry Revenue (Million), by Type 2024 & 2032
- Figure 5: North America USA Commercial Real Estate Industry Revenue Share (%), by Type 2024 & 2032
- Figure 6: North America USA Commercial Real Estate Industry Revenue (Million), by Key City 2024 & 2032
- Figure 7: North America USA Commercial Real Estate Industry Revenue Share (%), by Key City 2024 & 2032
- Figure 8: North America USA Commercial Real Estate Industry Revenue (Million), by Country 2024 & 2032
- Figure 9: North America USA Commercial Real Estate Industry Revenue Share (%), by Country 2024 & 2032
- Figure 10: South America USA Commercial Real Estate Industry Revenue (Million), by Type 2024 & 2032
- Figure 11: South America USA Commercial Real Estate Industry Revenue Share (%), by Type 2024 & 2032
- Figure 12: South America USA Commercial Real Estate Industry Revenue (Million), by Key City 2024 & 2032
- Figure 13: South America USA Commercial Real Estate Industry Revenue Share (%), by Key City 2024 & 2032
- Figure 14: South America USA Commercial Real Estate Industry Revenue (Million), by Country 2024 & 2032
- Figure 15: South America USA Commercial Real Estate Industry Revenue Share (%), by Country 2024 & 2032
- Figure 16: Europe USA Commercial Real Estate Industry Revenue (Million), by Type 2024 & 2032
- Figure 17: Europe USA Commercial Real Estate Industry Revenue Share (%), by Type 2024 & 2032
- Figure 18: Europe USA Commercial Real Estate Industry Revenue (Million), by Key City 2024 & 2032
- Figure 19: Europe USA Commercial Real Estate Industry Revenue Share (%), by Key City 2024 & 2032
- Figure 20: Europe USA Commercial Real Estate Industry Revenue (Million), by Country 2024 & 2032
- Figure 21: Europe USA Commercial Real Estate Industry Revenue Share (%), by Country 2024 & 2032
- Figure 22: Middle East & Africa USA Commercial Real Estate Industry Revenue (Million), by Type 2024 & 2032
- Figure 23: Middle East & Africa USA Commercial Real Estate Industry Revenue Share (%), by Type 2024 & 2032
- Figure 24: Middle East & Africa USA Commercial Real Estate Industry Revenue (Million), by Key City 2024 & 2032
- Figure 25: Middle East & Africa USA Commercial Real Estate Industry Revenue Share (%), by Key City 2024 & 2032
- Figure 26: Middle East & Africa USA Commercial Real Estate Industry Revenue (Million), by Country 2024 & 2032
- Figure 27: Middle East & Africa USA Commercial Real Estate Industry Revenue Share (%), by Country 2024 & 2032
- Figure 28: Asia Pacific USA Commercial Real Estate Industry Revenue (Million), by Type 2024 & 2032
- Figure 29: Asia Pacific USA Commercial Real Estate Industry Revenue Share (%), by Type 2024 & 2032
- Figure 30: Asia Pacific USA Commercial Real Estate Industry Revenue (Million), by Key City 2024 & 2032
- Figure 31: Asia Pacific USA Commercial Real Estate Industry Revenue Share (%), by Key City 2024 & 2032
- Figure 32: Asia Pacific USA Commercial Real Estate Industry Revenue (Million), by Country 2024 & 2032
- Figure 33: Asia Pacific USA Commercial Real Estate Industry Revenue Share (%), by Country 2024 & 2032
List of Tables
- Table 1: Global USA Commercial Real Estate Industry Revenue Million Forecast, by Region 2019 & 2032
- Table 2: Global USA Commercial Real Estate Industry Revenue Million Forecast, by Type 2019 & 2032
- Table 3: Global USA Commercial Real Estate Industry Revenue Million Forecast, by Key City 2019 & 2032
- Table 4: Global USA Commercial Real Estate Industry Revenue Million Forecast, by Region 2019 & 2032
- Table 5: Global USA Commercial Real Estate Industry Revenue Million Forecast, by Country 2019 & 2032
- Table 6: Northeast USA Commercial Real Estate Industry Revenue (Million) Forecast, by Application 2019 & 2032
- Table 7: Southeast USA Commercial Real Estate Industry Revenue (Million) Forecast, by Application 2019 & 2032
- Table 8: Midwest USA Commercial Real Estate Industry Revenue (Million) Forecast, by Application 2019 & 2032
- Table 9: Southwest USA Commercial Real Estate Industry Revenue (Million) Forecast, by Application 2019 & 2032
- Table 10: West USA Commercial Real Estate Industry Revenue (Million) Forecast, by Application 2019 & 2032
- Table 11: Global USA Commercial Real Estate Industry Revenue Million Forecast, by Type 2019 & 2032
- Table 12: Global USA Commercial Real Estate Industry Revenue Million Forecast, by Key City 2019 & 2032
- Table 13: Global USA Commercial Real Estate Industry Revenue Million Forecast, by Country 2019 & 2032
- Table 14: United States USA Commercial Real Estate Industry Revenue (Million) Forecast, by Application 2019 & 2032
- Table 15: Canada USA Commercial Real Estate Industry Revenue (Million) Forecast, by Application 2019 & 2032
- Table 16: Mexico USA Commercial Real Estate Industry Revenue (Million) Forecast, by Application 2019 & 2032
- Table 17: Global USA Commercial Real Estate Industry Revenue Million Forecast, by Type 2019 & 2032
- Table 18: Global USA Commercial Real Estate Industry Revenue Million Forecast, by Key City 2019 & 2032
- Table 19: Global USA Commercial Real Estate Industry Revenue Million Forecast, by Country 2019 & 2032
- Table 20: Brazil USA Commercial Real Estate Industry Revenue (Million) Forecast, by Application 2019 & 2032
- Table 21: Argentina USA Commercial Real Estate Industry Revenue (Million) Forecast, by Application 2019 & 2032
- Table 22: Rest of South America USA Commercial Real Estate Industry Revenue (Million) Forecast, by Application 2019 & 2032
- Table 23: Global USA Commercial Real Estate Industry Revenue Million Forecast, by Type 2019 & 2032
- Table 24: Global USA Commercial Real Estate Industry Revenue Million Forecast, by Key City 2019 & 2032
- Table 25: Global USA Commercial Real Estate Industry Revenue Million Forecast, by Country 2019 & 2032
- Table 26: United Kingdom USA Commercial Real Estate Industry Revenue (Million) Forecast, by Application 2019 & 2032
- Table 27: Germany USA Commercial Real Estate Industry Revenue (Million) Forecast, by Application 2019 & 2032
- Table 28: France USA Commercial Real Estate Industry Revenue (Million) Forecast, by Application 2019 & 2032
- Table 29: Italy USA Commercial Real Estate Industry Revenue (Million) Forecast, by Application 2019 & 2032
- Table 30: Spain USA Commercial Real Estate Industry Revenue (Million) Forecast, by Application 2019 & 2032
- Table 31: Russia USA Commercial Real Estate Industry Revenue (Million) Forecast, by Application 2019 & 2032
- Table 32: Benelux USA Commercial Real Estate Industry Revenue (Million) Forecast, by Application 2019 & 2032
- Table 33: Nordics USA Commercial Real Estate Industry Revenue (Million) Forecast, by Application 2019 & 2032
- Table 34: Rest of Europe USA Commercial Real Estate Industry Revenue (Million) Forecast, by Application 2019 & 2032
- Table 35: Global USA Commercial Real Estate Industry Revenue Million Forecast, by Type 2019 & 2032
- Table 36: Global USA Commercial Real Estate Industry Revenue Million Forecast, by Key City 2019 & 2032
- Table 37: Global USA Commercial Real Estate Industry Revenue Million Forecast, by Country 2019 & 2032
- Table 38: Turkey USA Commercial Real Estate Industry Revenue (Million) Forecast, by Application 2019 & 2032
- Table 39: Israel USA Commercial Real Estate Industry Revenue (Million) Forecast, by Application 2019 & 2032
- Table 40: GCC USA Commercial Real Estate Industry Revenue (Million) Forecast, by Application 2019 & 2032
- Table 41: North Africa USA Commercial Real Estate Industry Revenue (Million) Forecast, by Application 2019 & 2032
- Table 42: South Africa USA Commercial Real Estate Industry Revenue (Million) Forecast, by Application 2019 & 2032
- Table 43: Rest of Middle East & Africa USA Commercial Real Estate Industry Revenue (Million) Forecast, by Application 2019 & 2032
- Table 44: Global USA Commercial Real Estate Industry Revenue Million Forecast, by Type 2019 & 2032
- Table 45: Global USA Commercial Real Estate Industry Revenue Million Forecast, by Key City 2019 & 2032
- Table 46: Global USA Commercial Real Estate Industry Revenue Million Forecast, by Country 2019 & 2032
- Table 47: China USA Commercial Real Estate Industry Revenue (Million) Forecast, by Application 2019 & 2032
- Table 48: India USA Commercial Real Estate Industry Revenue (Million) Forecast, by Application 2019 & 2032
- Table 49: Japan USA Commercial Real Estate Industry Revenue (Million) Forecast, by Application 2019 & 2032
- Table 50: South Korea USA Commercial Real Estate Industry Revenue (Million) Forecast, by Application 2019 & 2032
- Table 51: ASEAN USA Commercial Real Estate Industry Revenue (Million) Forecast, by Application 2019 & 2032
- Table 52: Oceania USA Commercial Real Estate Industry Revenue (Million) Forecast, by Application 2019 & 2032
- Table 53: Rest of Asia Pacific USA Commercial Real Estate Industry Revenue (Million) Forecast, by Application 2019 & 2032
Frequently Asked Questions
1. What is the projected Compound Annual Growth Rate (CAGR) of the USA Commercial Real Estate Industry?
The projected CAGR is approximately 2.61%.
2. Which companies are prominent players in the USA Commercial Real Estate Industry?
Key companies in the market include Zumbly, Franklin Street, Crexi, Keller Williams Realty Inc, Simon Property Group, Hightower, Mohr Partners, Lamudi, Coldwell Banker, ERA Real Estate, RE/MAX, John Propp Commercial Group, HqO**List Not Exhaustive, Century, Progressive Real Estate Partners, Shannon-Waltchack.
3. What are the main segments of the USA Commercial Real Estate Industry?
The market segments include Type, Key City.
4. Can you provide details about the market size?
The market size is estimated to be USD 1.66 Million as of 2022.
5. What are some drivers contributing to market growth?
Increasing number of startups.
6. What are the notable trends driving market growth?
Industrial Sector Expected to Record High Demand.
7. Are there any restraints impacting market growth?
Low Awareness and Privacy Issues.
8. Can you provide examples of recent developments in the market?
N/A
9. What pricing options are available for accessing the report?
Pricing options include single-user, multi-user, and enterprise licenses priced at USD 3800, USD 4500, and USD 5800 respectively.
10. Is the market size provided in terms of value or volume?
The market size is provided in terms of value, measured in Million.
11. Are there any specific market keywords associated with the report?
Yes, the market keyword associated with the report is "USA Commercial Real Estate Industry," which aids in identifying and referencing the specific market segment covered.
12. How do I determine which pricing option suits my needs best?
The pricing options vary based on user requirements and access needs. Individual users may opt for single-user licenses, while businesses requiring broader access may choose multi-user or enterprise licenses for cost-effective access to the report.
13. Are there any additional resources or data provided in the USA Commercial Real Estate Industry report?
While the report offers comprehensive insights, it's advisable to review the specific contents or supplementary materials provided to ascertain if additional resources or data are available.
14. How can I stay updated on further developments or reports in the USA Commercial Real Estate Industry?
To stay informed about further developments, trends, and reports in the USA Commercial Real Estate Industry, consider subscribing to industry newsletters, following relevant companies and organizations, or regularly checking reputable industry news sources and publications.
Methodology
Step 1 - Identification of Relevant Samples Size from Population Database


Step 2 - Approaches for Defining Global Market Size (Value, Volume* & Price*)

Note*: In applicable scenarios
Step 3 - Data Sources
Primary Research
- Web Analytics
- Survey Reports
- Research Institute
- Latest Research Reports
- Opinion Leaders
Secondary Research
- Annual Reports
- White Paper
- Latest Press Release
- Industry Association
- Paid Database
- Investor Presentations

Step 4 - Data Triangulation
Involves using different sources of information in order to increase the validity of a study
These sources are likely to be stakeholders in a program - participants, other researchers, program staff, other community members, and so on.
Then we put all data in single framework & apply various statistical tools to find out the dynamic on the market.
During the analysis stage, feedback from the stakeholder groups would be compared to determine areas of agreement as well as areas of divergence
