

Key Insights
The USA surface water treatment chemicals market is experiencing robust growth, driven by increasing urbanization, stringent environmental regulations, and a rising focus on water quality and safety. The historical period (2019-2024) showed consistent expansion, with a projected Compound Annual Growth Rate (CAGR) that, considering typical industry growth rates for this sector, we can reasonably estimate to be around 5-7%. This growth is fueled by the increasing demand for potable water, the need for effective treatment of industrial wastewater, and growing concerns about the presence of contaminants like microplastics and emerging pollutants. Major segments within the market include coagulants, flocculants, disinfectants, and corrosion inhibitors. The market is characterized by a mix of established players and emerging companies, with ongoing innovation in chemical formulations and treatment technologies. The increasing adoption of advanced oxidation processes (AOPs) and membrane filtration systems is further contributing to market expansion. Furthermore, government initiatives promoting water infrastructure improvements and investments in water treatment facilities are providing significant impetus for market growth.
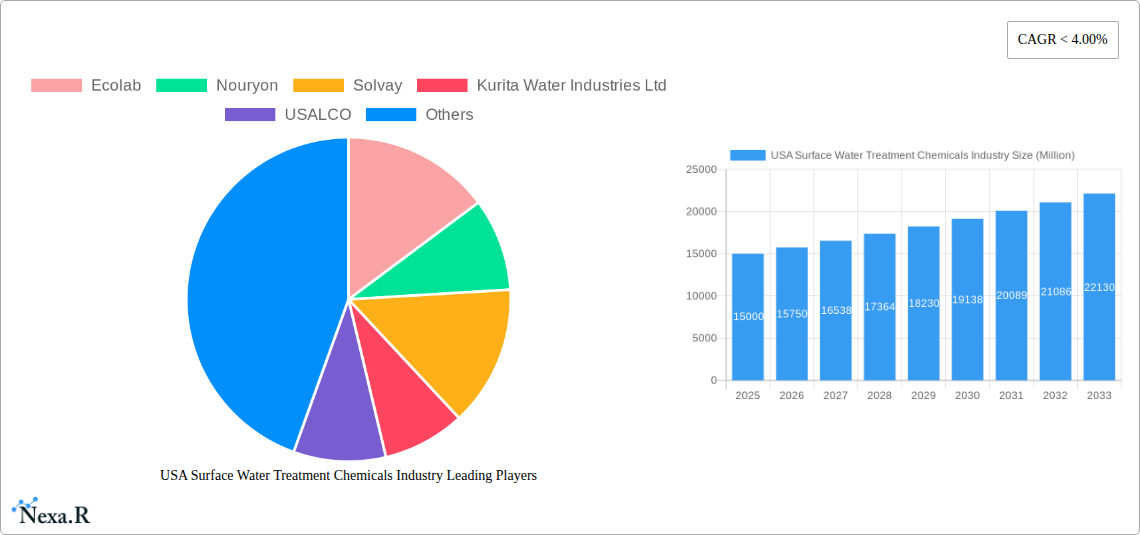
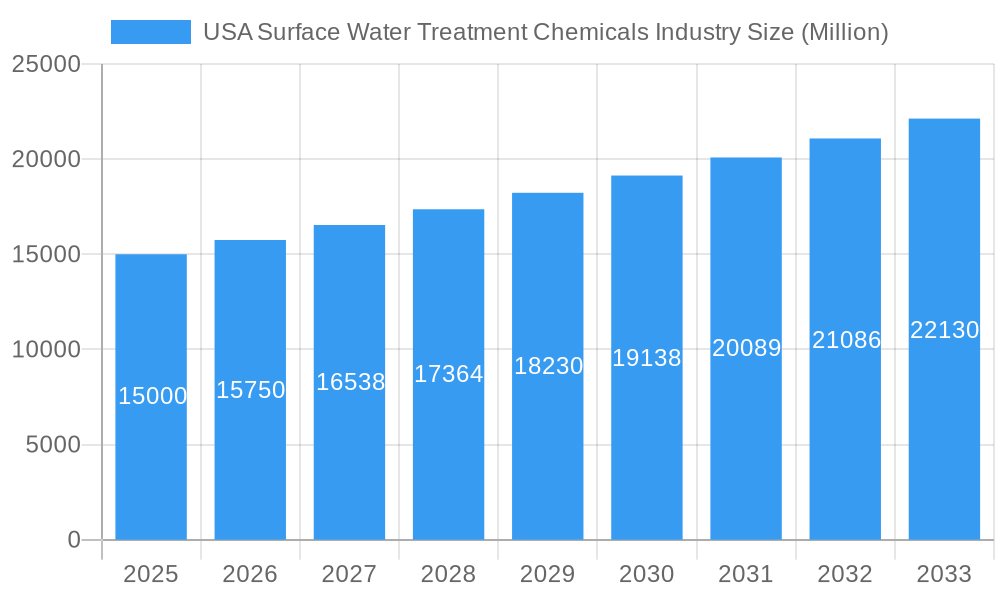
USA Surface Water Treatment Chemicals Industry Market Size (In Billion)
Looking forward from the base year of 2025 to 2033, the forecast period, we anticipate continued strong growth, although potentially at a slightly moderated pace compared to the historical period. Factors such as economic conditions and technological advancements will influence the exact growth trajectory. However, given the fundamental drivers mentioned above, the market is expected to remain a significant and attractive investment opportunity. The focus will likely shift towards more sustainable and environmentally friendly chemical solutions, aligning with global sustainability goals and reducing the environmental footprint of water treatment processes. This shift will present opportunities for companies that can offer innovative, eco-conscious solutions. Price fluctuations in raw materials and the overall economic climate will remain factors impacting profitability.
USA Surface Water Treatment Chemicals Industry Company Market Share
USA Surface Water Treatment Chemicals Industry Market Report: 2019-2033
This comprehensive report provides an in-depth analysis of the USA surface water treatment chemicals market, offering crucial insights for industry professionals, investors, and strategic decision-makers. The report covers the period 2019-2033, with a focus on the base year 2025 and a forecast period of 2025-2033. Key market segments analyzed include biocides, coagulants, corrosion inhibitors, and more, across diverse end-user industries like power generation, oil & gas, and municipal water treatment. The report features detailed profiles of major players such as Ecolab, Nouryon, Solvay, and Kurita Water Industries Ltd., providing a complete overview of the competitive landscape and future growth potential.
USA Surface Water Treatment Chemicals Industry Market Dynamics & Structure
The USA surface water treatment chemicals market is characterized by moderate concentration, with key players holding significant market share. Technological innovation, driven by stricter environmental regulations and the need for improved water quality, is a significant driver. The regulatory landscape is constantly evolving, impacting product development and adoption. The market witnesses competitive substitution with newer, eco-friendly chemicals replacing older, less sustainable options. End-user demographics, particularly the growing demand from the municipal sector and industrial expansion, significantly influence market growth. M&A activity remains a key feature, with several large-scale acquisitions shaping the competitive dynamics.
- Market Concentration: Moderately concentrated, with the top 5 players holding approximately xx% of the market share in 2025.
- Technological Innovation: Focus on sustainable and efficient solutions, with advancements in biocides, coagulants, and corrosion inhibitors.
- Regulatory Framework: Stringent EPA regulations driving demand for advanced treatment solutions.
- Competitive Substitutes: Bio-based chemicals and advanced oxidation processes are emerging as strong substitutes.
- End-user Demographics: Growing industrialization and population increase driving demand, particularly in the municipal and power sectors.
- M&A Trends: xx major M&A deals recorded between 2019 and 2024, with an estimated xx million USD in total deal value. Consolidation is expected to continue.
USA Surface Water Treatment Chemicals Industry Growth Trends & Insights
The USA surface water treatment chemicals market experienced a CAGR of xx% during the historical period (2019-2024), reaching a market size of xx million USD in 2025. This growth is attributed to increasing awareness of water scarcity, stricter environmental regulations, and the rising demand for clean water across various end-user sectors. Technological advancements, including the introduction of more efficient and environmentally friendly chemicals, further fuel market expansion. The market penetration rate for advanced water treatment technologies is increasing steadily, especially in the municipal and industrial sectors. Consumer behavior shifts toward sustainable and responsible water management practices are also influencing growth. The forecast period (2025-2033) projects a continued strong growth trajectory, with a projected CAGR of xx%, driven by factors such as infrastructure development and increasing industrial activity.
Dominant Regions, Countries, or Segments in USA Surface Water Treatment Chemicals Industry
The report identifies the Midwest and West regions as the key growth drivers within the US market. The municipal sector holds the largest market share across various product types. Within product segments, Coagulants and Flocculants and Biocides and Disinfectants exhibit the highest demand driven by stringent regulations and increasing water treatment needs.
- Key Drivers:
- Strong regulatory framework: Stringent environmental regulations emphasizing clean water standards.
- Infrastructure development: Investments in water infrastructure projects across various sectors.
- Growing industrialization: Increased industrial water usage and stringent effluent discharge requirements.
- Water scarcity concerns: Rising awareness of water scarcity and the need for efficient water management.
- Dominance Factors:
- High concentration of industrial activities: Particularly in the Midwest and West Coast states.
- Significant investments in municipal water treatment: Leading to increased demand for chemicals.
- Stringent regulations focusing on water quality: Creating opportunities for advanced treatment solutions.
- High growth potential: Untapped opportunities in smaller municipalities and rural areas.
USA Surface Water Treatment Chemicals Industry Product Landscape
The market offers a diverse range of products, with continuous innovation focusing on enhanced efficiency, eco-friendliness, and improved performance. Biocides are increasingly formulated with advanced technologies to target specific microorganisms while minimizing environmental impact. Coagulants and flocculants are being optimized for improved sedimentation and filtration efficiency. Corrosion inhibitors are designed to extend the lifespan of water treatment infrastructure and reduce maintenance costs. Technological advancements, including nanotechnology and advanced materials, are improving the performance and efficacy of these chemicals. Unique selling propositions often focus on reduced dosage, improved efficacy, environmental friendliness, and cost-effectiveness.
Key Drivers, Barriers & Challenges in USA Surface Water Treatment Chemicals Industry
Key Drivers: Increasing stringency of environmental regulations, growing industrialization, urbanization, and rising awareness of water scarcity are driving market growth. Technological advancements leading to the development of more efficient and sustainable products also contribute to this growth. Investments in water infrastructure projects are expected to further boost demand.
Key Challenges: Fluctuations in raw material prices, supply chain disruptions, and intense competition amongst existing players are major hurdles. Stringent regulatory approvals and compliance costs can pose significant challenges for smaller companies. Concerns regarding the environmental impact of certain chemicals are also limiting market expansion in some areas. The overall impact of these challenges on the market is estimated at a xx% reduction in growth in the next five years.
Emerging Opportunities in USA Surface Water Treatment Chemicals Industry
Emerging opportunities include the growing adoption of advanced oxidation processes (AOPs) for water treatment, the increasing demand for bio-based and sustainable water treatment chemicals, and expansion into untapped markets such as smaller municipalities and rural areas. Innovative applications are also emerging, such as the use of smart sensors and data analytics to optimize water treatment processes. Evolving consumer preferences toward environmentally friendly products are driving demand for sustainable solutions.
Growth Accelerators in the USA Surface Water Treatment Chemicals Industry Industry
Technological breakthroughs in water treatment technologies, strategic partnerships and mergers & acquisitions, and expansion into new geographical markets are crucial for future growth. Government initiatives promoting water conservation and infrastructure development will also contribute to accelerated growth. The adoption of sustainable manufacturing processes and the development of innovative marketing strategies are also vital for long-term success.
Key Players Shaping the USA Surface Water Treatment Chemicals Industry Market
- Ecolab
- Nouryon
- Solvay
- Kurita Water Industries Ltd
- USALCO
- SUEZ
- Kemira
- Dow
- ChemTreat Inc
- Solenis
- Buckman Laboratories Inc
- Veolia
- Albemarle Corporation
- Chemtrade
Notable Milestones in USA Surface Water Treatment Chemicals Industry Sector
- 2020: Introduction of a new generation of biocides with enhanced efficacy and reduced environmental impact by Ecolab.
- 2021: Merger between two major players in the coagulant market, resulting in increased market concentration.
- 2022: Launch of a new line of sustainable corrosion inhibitors by Solvay, focusing on reduced carbon footprint.
- 2023: Implementation of stricter regulations on the use of certain chemicals in municipal water treatment.
- 2024: Significant investments in water infrastructure projects across several states, boosting demand for water treatment chemicals.
In-Depth USA Surface Water Treatment Chemicals Industry Market Outlook
The USA surface water treatment chemicals market is poised for significant growth in the coming years, driven by several factors including increasing urbanization, industrial expansion, and stricter environmental regulations. Strategic investments in research and development, strategic partnerships to expand market reach, and a focus on developing innovative and sustainable solutions are crucial for capturing future market share. The market is expected to witness continued consolidation, with larger players acquiring smaller companies to expand their product portfolio and market presence. Opportunities exist for companies that can offer tailored solutions to specific customer needs, coupled with robust environmental sustainability credentials.
USA Surface Water Treatment Chemicals Industry Segmentation
-
1. Product Type
- 1.1. Biocides and Disinfectants
- 1.2. Coagulants and Flocculants
- 1.3. Corrosion and Scale Inhibitors
- 1.4. Defoamers and Defoaming Agents
- 1.5. pH & Adjusters and Softeners
- 1.6. Other Product Types
-
2. End-user Industry
- 2.1. Power
- 2.2. Oil and Gas
- 2.3. Chemical Manufacturing
- 2.4. Mining and Mineral Processing
- 2.5. Municipal
- 2.6. Food and Beverage
- 2.7. Pulp and Paper
- 2.8. Other End-user Industries
USA Surface Water Treatment Chemicals Industry Segmentation By Geography
-
1. North America
- 1.1. United States
- 1.2. Canada
- 1.3. Mexico
-
2. South America
- 2.1. Brazil
- 2.2. Argentina
- 2.3. Rest of South America
-
3. Europe
- 3.1. United Kingdom
- 3.2. Germany
- 3.3. France
- 3.4. Italy
- 3.5. Spain
- 3.6. Russia
- 3.7. Benelux
- 3.8. Nordics
- 3.9. Rest of Europe
-
4. Middle East & Africa
- 4.1. Turkey
- 4.2. Israel
- 4.3. GCC
- 4.4. North Africa
- 4.5. South Africa
- 4.6. Rest of Middle East & Africa
-
5. Asia Pacific
- 5.1. China
- 5.2. India
- 5.3. Japan
- 5.4. South Korea
- 5.5. ASEAN
- 5.6. Oceania
- 5.7. Rest of Asia Pacific
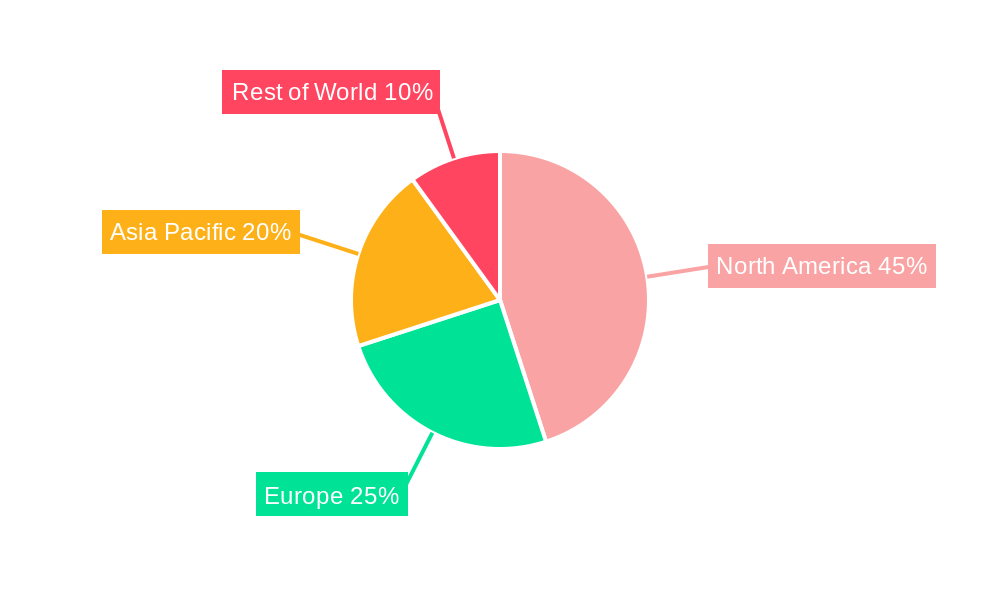
USA Surface Water Treatment Chemicals Industry Regional Market Share
Geographic Coverage of USA Surface Water Treatment Chemicals Industry
USA Surface Water Treatment Chemicals Industry REPORT HIGHLIGHTS
| Aspects | Details |
|---|---|
| Study Period | 2020-2034 |
| Base Year | 2025 |
| Estimated Year | 2026 |
| Forecast Period | 2026-2034 |
| Historical Period | 2020-2025 |
| Growth Rate | CAGR of 4.2% from 2020-2034 |
| Segmentation |
|
Table of Contents
- 1. Introduction
- 1.1. Research Scope
- 1.2. Market Segmentation
- 1.3. Research Objective
- 1.4. Definitions and Assumptions
- 2. Executive Summary
- 2.1. Market Snapshot
- 3. Market Dynamics
- 3.1. Market Drivers
- 3.2. Market Restrains
- 3.3. Market Trends
- 3.4. Market Opportunities
- 4. Market Factor Analysis
- 4.1. Porters Five Forces
- 4.1.1. Bargaining Power of Suppliers
- 4.1.2. Bargaining Power of Buyers
- 4.1.3. Threat of New Entrants
- 4.1.4. Threat of Substitutes
- 4.1.5. Competitive Rivalry
- 4.2. PESTEL analysis
- 4.3. BCG Analysis
- 4.3.1. Stars (High Growth, High Market Share)
- 4.3.2. Cash Cows (Low Growth, High Market Share)
- 4.3.3. Question Mark (High Growth, Low Market Share)
- 4.3.4. Dogs (Low Growth, Low Market Share)
- 4.4. Ansoff Matrix Analysis
- 4.5. Supply Chain Analysis
- 4.6. Regulatory Landscape
- 4.7. Current Market Potential and Opportunity Assessment (TAM–SAM–SOM Framework)
- 4.8. NRP Analyst Note
- 4.1. Porters Five Forces
- 5. Market Analysis, Insights and Forecast 2021-2033
- 5.1. Market Analysis, Insights and Forecast - by Product Type
- 5.1.1. Biocides and Disinfectants
- 5.1.2. Coagulants and Flocculants
- 5.1.3. Corrosion and Scale Inhibitors
- 5.1.4. Defoamers and Defoaming Agents
- 5.1.5. pH & Adjusters and Softeners
- 5.1.6. Other Product Types
- 5.2. Market Analysis, Insights and Forecast - by End-user Industry
- 5.2.1. Power
- 5.2.2. Oil and Gas
- 5.2.3. Chemical Manufacturing
- 5.2.4. Mining and Mineral Processing
- 5.2.5. Municipal
- 5.2.6. Food and Beverage
- 5.2.7. Pulp and Paper
- 5.2.8. Other End-user Industries
- 5.3. Market Analysis, Insights and Forecast - by Region
- 5.3.1. North America
- 5.3.2. South America
- 5.3.3. Europe
- 5.3.4. Middle East & Africa
- 5.3.5. Asia Pacific
- 5.1. Market Analysis, Insights and Forecast - by Product Type
- 6. Global USA Surface Water Treatment Chemicals Industry Analysis, Insights and Forecast, 2021-2033
- 6.1. Market Analysis, Insights and Forecast - by Product Type
- 6.1.1. Biocides and Disinfectants
- 6.1.2. Coagulants and Flocculants
- 6.1.3. Corrosion and Scale Inhibitors
- 6.1.4. Defoamers and Defoaming Agents
- 6.1.5. pH & Adjusters and Softeners
- 6.1.6. Other Product Types
- 6.2. Market Analysis, Insights and Forecast - by End-user Industry
- 6.2.1. Power
- 6.2.2. Oil and Gas
- 6.2.3. Chemical Manufacturing
- 6.2.4. Mining and Mineral Processing
- 6.2.5. Municipal
- 6.2.6. Food and Beverage
- 6.2.7. Pulp and Paper
- 6.2.8. Other End-user Industries
- 6.1. Market Analysis, Insights and Forecast - by Product Type
- 7. North America USA Surface Water Treatment Chemicals Industry Analysis, Insights and Forecast, 2020-2032
- 7.1. Market Analysis, Insights and Forecast - by Product Type
- 7.1.1. Biocides and Disinfectants
- 7.1.2. Coagulants and Flocculants
- 7.1.3. Corrosion and Scale Inhibitors
- 7.1.4. Defoamers and Defoaming Agents
- 7.1.5. pH & Adjusters and Softeners
- 7.1.6. Other Product Types
- 7.2. Market Analysis, Insights and Forecast - by End-user Industry
- 7.2.1. Power
- 7.2.2. Oil and Gas
- 7.2.3. Chemical Manufacturing
- 7.2.4. Mining and Mineral Processing
- 7.2.5. Municipal
- 7.2.6. Food and Beverage
- 7.2.7. Pulp and Paper
- 7.2.8. Other End-user Industries
- 7.1. Market Analysis, Insights and Forecast - by Product Type
- 8. South America USA Surface Water Treatment Chemicals Industry Analysis, Insights and Forecast, 2020-2032
- 8.1. Market Analysis, Insights and Forecast - by Product Type
- 8.1.1. Biocides and Disinfectants
- 8.1.2. Coagulants and Flocculants
- 8.1.3. Corrosion and Scale Inhibitors
- 8.1.4. Defoamers and Defoaming Agents
- 8.1.5. pH & Adjusters and Softeners
- 8.1.6. Other Product Types
- 8.2. Market Analysis, Insights and Forecast - by End-user Industry
- 8.2.1. Power
- 8.2.2. Oil and Gas
- 8.2.3. Chemical Manufacturing
- 8.2.4. Mining and Mineral Processing
- 8.2.5. Municipal
- 8.2.6. Food and Beverage
- 8.2.7. Pulp and Paper
- 8.2.8. Other End-user Industries
- 8.1. Market Analysis, Insights and Forecast - by Product Type
- 9. Europe USA Surface Water Treatment Chemicals Industry Analysis, Insights and Forecast, 2020-2032
- 9.1. Market Analysis, Insights and Forecast - by Product Type
- 9.1.1. Biocides and Disinfectants
- 9.1.2. Coagulants and Flocculants
- 9.1.3. Corrosion and Scale Inhibitors
- 9.1.4. Defoamers and Defoaming Agents
- 9.1.5. pH & Adjusters and Softeners
- 9.1.6. Other Product Types
- 9.2. Market Analysis, Insights and Forecast - by End-user Industry
- 9.2.1. Power
- 9.2.2. Oil and Gas
- 9.2.3. Chemical Manufacturing
- 9.2.4. Mining and Mineral Processing
- 9.2.5. Municipal
- 9.2.6. Food and Beverage
- 9.2.7. Pulp and Paper
- 9.2.8. Other End-user Industries
- 9.1. Market Analysis, Insights and Forecast - by Product Type
- 10. Middle East & Africa USA Surface Water Treatment Chemicals Industry Analysis, Insights and Forecast, 2020-2032
- 10.1. Market Analysis, Insights and Forecast - by Product Type
- 10.1.1. Biocides and Disinfectants
- 10.1.2. Coagulants and Flocculants
- 10.1.3. Corrosion and Scale Inhibitors
- 10.1.4. Defoamers and Defoaming Agents
- 10.1.5. pH & Adjusters and Softeners
- 10.1.6. Other Product Types
- 10.2. Market Analysis, Insights and Forecast - by End-user Industry
- 10.2.1. Power
- 10.2.2. Oil and Gas
- 10.2.3. Chemical Manufacturing
- 10.2.4. Mining and Mineral Processing
- 10.2.5. Municipal
- 10.2.6. Food and Beverage
- 10.2.7. Pulp and Paper
- 10.2.8. Other End-user Industries
- 10.1. Market Analysis, Insights and Forecast - by Product Type
- 11. Asia Pacific USA Surface Water Treatment Chemicals Industry Analysis, Insights and Forecast, 2020-2032
- 11.1. Market Analysis, Insights and Forecast - by Product Type
- 11.1.1. Biocides and Disinfectants
- 11.1.2. Coagulants and Flocculants
- 11.1.3. Corrosion and Scale Inhibitors
- 11.1.4. Defoamers and Defoaming Agents
- 11.1.5. pH & Adjusters and Softeners
- 11.1.6. Other Product Types
- 11.2. Market Analysis, Insights and Forecast - by End-user Industry
- 11.2.1. Power
- 11.2.2. Oil and Gas
- 11.2.3. Chemical Manufacturing
- 11.2.4. Mining and Mineral Processing
- 11.2.5. Municipal
- 11.2.6. Food and Beverage
- 11.2.7. Pulp and Paper
- 11.2.8. Other End-user Industries
- 11.1. Market Analysis, Insights and Forecast - by Product Type
- 12. Competitive Analysis
- 12.1. Company Profiles
- 12.1.1 Ecolab
- 12.1.1.1. Company Overview
- 12.1.1.2. Products
- 12.1.1.3. Company Financials
- 12.1.1.4. SWOT Analysis
- 12.1.2 Nouryon
- 12.1.2.1. Company Overview
- 12.1.2.2. Products
- 12.1.2.3. Company Financials
- 12.1.2.4. SWOT Analysis
- 12.1.3 Solvay
- 12.1.3.1. Company Overview
- 12.1.3.2. Products
- 12.1.3.3. Company Financials
- 12.1.3.4. SWOT Analysis
- 12.1.4 Kurita Water Industries Ltd
- 12.1.4.1. Company Overview
- 12.1.4.2. Products
- 12.1.4.3. Company Financials
- 12.1.4.4. SWOT Analysis
- 12.1.5 USALCO
- 12.1.5.1. Company Overview
- 12.1.5.2. Products
- 12.1.5.3. Company Financials
- 12.1.5.4. SWOT Analysis
- 12.1.6 SUEZ
- 12.1.6.1. Company Overview
- 12.1.6.2. Products
- 12.1.6.3. Company Financials
- 12.1.6.4. SWOT Analysis
- 12.1.7 Kemira
- 12.1.7.1. Company Overview
- 12.1.7.2. Products
- 12.1.7.3. Company Financials
- 12.1.7.4. SWOT Analysis
- 12.1.8 Dow
- 12.1.8.1. Company Overview
- 12.1.8.2. Products
- 12.1.8.3. Company Financials
- 12.1.8.4. SWOT Analysis
- 12.1.9 ChemTreat Inc
- 12.1.9.1. Company Overview
- 12.1.9.2. Products
- 12.1.9.3. Company Financials
- 12.1.9.4. SWOT Analysis
- 12.1.10 Solenis
- 12.1.10.1. Company Overview
- 12.1.10.2. Products
- 12.1.10.3. Company Financials
- 12.1.10.4. SWOT Analysis
- 12.1.11 Buckman Laboratories Inc
- 12.1.11.1. Company Overview
- 12.1.11.2. Products
- 12.1.11.3. Company Financials
- 12.1.11.4. SWOT Analysis
- 12.1.12 Veolia
- 12.1.12.1. Company Overview
- 12.1.12.2. Products
- 12.1.12.3. Company Financials
- 12.1.12.4. SWOT Analysis
- 12.1.13 Albemarle Corporation
- 12.1.13.1. Company Overview
- 12.1.13.2. Products
- 12.1.13.3. Company Financials
- 12.1.13.4. SWOT Analysis
- 12.1.14 Chemtrade
- 12.1.14.1. Company Overview
- 12.1.14.2. Products
- 12.1.14.3. Company Financials
- 12.1.14.4. SWOT Analysis
- 12.1.1 Ecolab
- 12.2. Market Entropy
- 12.2.1 Company's Key Areas Served
- 12.2.2 Recent Developments
- 12.3. Company Market Share Analysis 2025
- 12.3.1 Top 5 Companies Market Share Analysis
- 12.3.2 Top 3 Companies Market Share Analysis
- 12.4. List of Potential Customers
- 13. Research Methodology
List of Figures
- Figure 1: Global USA Surface Water Treatment Chemicals Industry Revenue Breakdown (billion, %) by Region 2025 & 2033
- Figure 2: Global USA Surface Water Treatment Chemicals Industry Volume Breakdown (K Tons, %) by Region 2025 & 2033
- Figure 3: North America USA Surface Water Treatment Chemicals Industry Revenue (billion), by Product Type 2025 & 2033
- Figure 4: North America USA Surface Water Treatment Chemicals Industry Volume (K Tons), by Product Type 2025 & 2033
- Figure 5: North America USA Surface Water Treatment Chemicals Industry Revenue Share (%), by Product Type 2025 & 2033
- Figure 6: North America USA Surface Water Treatment Chemicals Industry Volume Share (%), by Product Type 2025 & 2033
- Figure 7: North America USA Surface Water Treatment Chemicals Industry Revenue (billion), by End-user Industry 2025 & 2033
- Figure 8: North America USA Surface Water Treatment Chemicals Industry Volume (K Tons), by End-user Industry 2025 & 2033
- Figure 9: North America USA Surface Water Treatment Chemicals Industry Revenue Share (%), by End-user Industry 2025 & 2033
- Figure 10: North America USA Surface Water Treatment Chemicals Industry Volume Share (%), by End-user Industry 2025 & 2033
- Figure 11: North America USA Surface Water Treatment Chemicals Industry Revenue (billion), by Country 2025 & 2033
- Figure 12: North America USA Surface Water Treatment Chemicals Industry Volume (K Tons), by Country 2025 & 2033
- Figure 13: North America USA Surface Water Treatment Chemicals Industry Revenue Share (%), by Country 2025 & 2033
- Figure 14: North America USA Surface Water Treatment Chemicals Industry Volume Share (%), by Country 2025 & 2033
- Figure 15: South America USA Surface Water Treatment Chemicals Industry Revenue (billion), by Product Type 2025 & 2033
- Figure 16: South America USA Surface Water Treatment Chemicals Industry Volume (K Tons), by Product Type 2025 & 2033
- Figure 17: South America USA Surface Water Treatment Chemicals Industry Revenue Share (%), by Product Type 2025 & 2033
- Figure 18: South America USA Surface Water Treatment Chemicals Industry Volume Share (%), by Product Type 2025 & 2033
- Figure 19: South America USA Surface Water Treatment Chemicals Industry Revenue (billion), by End-user Industry 2025 & 2033
- Figure 20: South America USA Surface Water Treatment Chemicals Industry Volume (K Tons), by End-user Industry 2025 & 2033
- Figure 21: South America USA Surface Water Treatment Chemicals Industry Revenue Share (%), by End-user Industry 2025 & 2033
- Figure 22: South America USA Surface Water Treatment Chemicals Industry Volume Share (%), by End-user Industry 2025 & 2033
- Figure 23: South America USA Surface Water Treatment Chemicals Industry Revenue (billion), by Country 2025 & 2033
- Figure 24: South America USA Surface Water Treatment Chemicals Industry Volume (K Tons), by Country 2025 & 2033
- Figure 25: South America USA Surface Water Treatment Chemicals Industry Revenue Share (%), by Country 2025 & 2033
- Figure 26: South America USA Surface Water Treatment Chemicals Industry Volume Share (%), by Country 2025 & 2033
- Figure 27: Europe USA Surface Water Treatment Chemicals Industry Revenue (billion), by Product Type 2025 & 2033
- Figure 28: Europe USA Surface Water Treatment Chemicals Industry Volume (K Tons), by Product Type 2025 & 2033
- Figure 29: Europe USA Surface Water Treatment Chemicals Industry Revenue Share (%), by Product Type 2025 & 2033
- Figure 30: Europe USA Surface Water Treatment Chemicals Industry Volume Share (%), by Product Type 2025 & 2033
- Figure 31: Europe USA Surface Water Treatment Chemicals Industry Revenue (billion), by End-user Industry 2025 & 2033
- Figure 32: Europe USA Surface Water Treatment Chemicals Industry Volume (K Tons), by End-user Industry 2025 & 2033
- Figure 33: Europe USA Surface Water Treatment Chemicals Industry Revenue Share (%), by End-user Industry 2025 & 2033
- Figure 34: Europe USA Surface Water Treatment Chemicals Industry Volume Share (%), by End-user Industry 2025 & 2033
- Figure 35: Europe USA Surface Water Treatment Chemicals Industry Revenue (billion), by Country 2025 & 2033
- Figure 36: Europe USA Surface Water Treatment Chemicals Industry Volume (K Tons), by Country 2025 & 2033
- Figure 37: Europe USA Surface Water Treatment Chemicals Industry Revenue Share (%), by Country 2025 & 2033
- Figure 38: Europe USA Surface Water Treatment Chemicals Industry Volume Share (%), by Country 2025 & 2033
- Figure 39: Middle East & Africa USA Surface Water Treatment Chemicals Industry Revenue (billion), by Product Type 2025 & 2033
- Figure 40: Middle East & Africa USA Surface Water Treatment Chemicals Industry Volume (K Tons), by Product Type 2025 & 2033
- Figure 41: Middle East & Africa USA Surface Water Treatment Chemicals Industry Revenue Share (%), by Product Type 2025 & 2033
- Figure 42: Middle East & Africa USA Surface Water Treatment Chemicals Industry Volume Share (%), by Product Type 2025 & 2033
- Figure 43: Middle East & Africa USA Surface Water Treatment Chemicals Industry Revenue (billion), by End-user Industry 2025 & 2033
- Figure 44: Middle East & Africa USA Surface Water Treatment Chemicals Industry Volume (K Tons), by End-user Industry 2025 & 2033
- Figure 45: Middle East & Africa USA Surface Water Treatment Chemicals Industry Revenue Share (%), by End-user Industry 2025 & 2033
- Figure 46: Middle East & Africa USA Surface Water Treatment Chemicals Industry Volume Share (%), by End-user Industry 2025 & 2033
- Figure 47: Middle East & Africa USA Surface Water Treatment Chemicals Industry Revenue (billion), by Country 2025 & 2033
- Figure 48: Middle East & Africa USA Surface Water Treatment Chemicals Industry Volume (K Tons), by Country 2025 & 2033
- Figure 49: Middle East & Africa USA Surface Water Treatment Chemicals Industry Revenue Share (%), by Country 2025 & 2033
- Figure 50: Middle East & Africa USA Surface Water Treatment Chemicals Industry Volume Share (%), by Country 2025 & 2033
- Figure 51: Asia Pacific USA Surface Water Treatment Chemicals Industry Revenue (billion), by Product Type 2025 & 2033
- Figure 52: Asia Pacific USA Surface Water Treatment Chemicals Industry Volume (K Tons), by Product Type 2025 & 2033
- Figure 53: Asia Pacific USA Surface Water Treatment Chemicals Industry Revenue Share (%), by Product Type 2025 & 2033
- Figure 54: Asia Pacific USA Surface Water Treatment Chemicals Industry Volume Share (%), by Product Type 2025 & 2033
- Figure 55: Asia Pacific USA Surface Water Treatment Chemicals Industry Revenue (billion), by End-user Industry 2025 & 2033
- Figure 56: Asia Pacific USA Surface Water Treatment Chemicals Industry Volume (K Tons), by End-user Industry 2025 & 2033
- Figure 57: Asia Pacific USA Surface Water Treatment Chemicals Industry Revenue Share (%), by End-user Industry 2025 & 2033
- Figure 58: Asia Pacific USA Surface Water Treatment Chemicals Industry Volume Share (%), by End-user Industry 2025 & 2033
- Figure 59: Asia Pacific USA Surface Water Treatment Chemicals Industry Revenue (billion), by Country 2025 & 2033
- Figure 60: Asia Pacific USA Surface Water Treatment Chemicals Industry Volume (K Tons), by Country 2025 & 2033
- Figure 61: Asia Pacific USA Surface Water Treatment Chemicals Industry Revenue Share (%), by Country 2025 & 2033
- Figure 62: Asia Pacific USA Surface Water Treatment Chemicals Industry Volume Share (%), by Country 2025 & 2033
List of Tables
- Table 1: Global USA Surface Water Treatment Chemicals Industry Revenue billion Forecast, by Product Type 2020 & 2033
- Table 2: Global USA Surface Water Treatment Chemicals Industry Volume K Tons Forecast, by Product Type 2020 & 2033
- Table 3: Global USA Surface Water Treatment Chemicals Industry Revenue billion Forecast, by End-user Industry 2020 & 2033
- Table 4: Global USA Surface Water Treatment Chemicals Industry Volume K Tons Forecast, by End-user Industry 2020 & 2033
- Table 5: Global USA Surface Water Treatment Chemicals Industry Revenue billion Forecast, by Region 2020 & 2033
- Table 6: Global USA Surface Water Treatment Chemicals Industry Volume K Tons Forecast, by Region 2020 & 2033
- Table 7: Global USA Surface Water Treatment Chemicals Industry Revenue billion Forecast, by Product Type 2020 & 2033
- Table 8: Global USA Surface Water Treatment Chemicals Industry Volume K Tons Forecast, by Product Type 2020 & 2033
- Table 9: Global USA Surface Water Treatment Chemicals Industry Revenue billion Forecast, by End-user Industry 2020 & 2033
- Table 10: Global USA Surface Water Treatment Chemicals Industry Volume K Tons Forecast, by End-user Industry 2020 & 2033
- Table 11: Global USA Surface Water Treatment Chemicals Industry Revenue billion Forecast, by Country 2020 & 2033
- Table 12: Global USA Surface Water Treatment Chemicals Industry Volume K Tons Forecast, by Country 2020 & 2033
- Table 13: United States USA Surface Water Treatment Chemicals Industry Revenue (billion) Forecast, by Application 2020 & 2033
- Table 14: United States USA Surface Water Treatment Chemicals Industry Volume (K Tons) Forecast, by Application 2020 & 2033
- Table 15: Canada USA Surface Water Treatment Chemicals Industry Revenue (billion) Forecast, by Application 2020 & 2033
- Table 16: Canada USA Surface Water Treatment Chemicals Industry Volume (K Tons) Forecast, by Application 2020 & 2033
- Table 17: Mexico USA Surface Water Treatment Chemicals Industry Revenue (billion) Forecast, by Application 2020 & 2033
- Table 18: Mexico USA Surface Water Treatment Chemicals Industry Volume (K Tons) Forecast, by Application 2020 & 2033
- Table 19: Global USA Surface Water Treatment Chemicals Industry Revenue billion Forecast, by Product Type 2020 & 2033
- Table 20: Global USA Surface Water Treatment Chemicals Industry Volume K Tons Forecast, by Product Type 2020 & 2033
- Table 21: Global USA Surface Water Treatment Chemicals Industry Revenue billion Forecast, by End-user Industry 2020 & 2033
- Table 22: Global USA Surface Water Treatment Chemicals Industry Volume K Tons Forecast, by End-user Industry 2020 & 2033
- Table 23: Global USA Surface Water Treatment Chemicals Industry Revenue billion Forecast, by Country 2020 & 2033
- Table 24: Global USA Surface Water Treatment Chemicals Industry Volume K Tons Forecast, by Country 2020 & 2033
- Table 25: Brazil USA Surface Water Treatment Chemicals Industry Revenue (billion) Forecast, by Application 2020 & 2033
- Table 26: Brazil USA Surface Water Treatment Chemicals Industry Volume (K Tons) Forecast, by Application 2020 & 2033
- Table 27: Argentina USA Surface Water Treatment Chemicals Industry Revenue (billion) Forecast, by Application 2020 & 2033
- Table 28: Argentina USA Surface Water Treatment Chemicals Industry Volume (K Tons) Forecast, by Application 2020 & 2033
- Table 29: Rest of South America USA Surface Water Treatment Chemicals Industry Revenue (billion) Forecast, by Application 2020 & 2033
- Table 30: Rest of South America USA Surface Water Treatment Chemicals Industry Volume (K Tons) Forecast, by Application 2020 & 2033
- Table 31: Global USA Surface Water Treatment Chemicals Industry Revenue billion Forecast, by Product Type 2020 & 2033
- Table 32: Global USA Surface Water Treatment Chemicals Industry Volume K Tons Forecast, by Product Type 2020 & 2033
- Table 33: Global USA Surface Water Treatment Chemicals Industry Revenue billion Forecast, by End-user Industry 2020 & 2033
- Table 34: Global USA Surface Water Treatment Chemicals Industry Volume K Tons Forecast, by End-user Industry 2020 & 2033
- Table 35: Global USA Surface Water Treatment Chemicals Industry Revenue billion Forecast, by Country 2020 & 2033
- Table 36: Global USA Surface Water Treatment Chemicals Industry Volume K Tons Forecast, by Country 2020 & 2033
- Table 37: United Kingdom USA Surface Water Treatment Chemicals Industry Revenue (billion) Forecast, by Application 2020 & 2033
- Table 38: United Kingdom USA Surface Water Treatment Chemicals Industry Volume (K Tons) Forecast, by Application 2020 & 2033
- Table 39: Germany USA Surface Water Treatment Chemicals Industry Revenue (billion) Forecast, by Application 2020 & 2033
- Table 40: Germany USA Surface Water Treatment Chemicals Industry Volume (K Tons) Forecast, by Application 2020 & 2033
- Table 41: France USA Surface Water Treatment Chemicals Industry Revenue (billion) Forecast, by Application 2020 & 2033
- Table 42: France USA Surface Water Treatment Chemicals Industry Volume (K Tons) Forecast, by Application 2020 & 2033
- Table 43: Italy USA Surface Water Treatment Chemicals Industry Revenue (billion) Forecast, by Application 2020 & 2033
- Table 44: Italy USA Surface Water Treatment Chemicals Industry Volume (K Tons) Forecast, by Application 2020 & 2033
- Table 45: Spain USA Surface Water Treatment Chemicals Industry Revenue (billion) Forecast, by Application 2020 & 2033
- Table 46: Spain USA Surface Water Treatment Chemicals Industry Volume (K Tons) Forecast, by Application 2020 & 2033
- Table 47: Russia USA Surface Water Treatment Chemicals Industry Revenue (billion) Forecast, by Application 2020 & 2033
- Table 48: Russia USA Surface Water Treatment Chemicals Industry Volume (K Tons) Forecast, by Application 2020 & 2033
- Table 49: Benelux USA Surface Water Treatment Chemicals Industry Revenue (billion) Forecast, by Application 2020 & 2033
- Table 50: Benelux USA Surface Water Treatment Chemicals Industry Volume (K Tons) Forecast, by Application 2020 & 2033
- Table 51: Nordics USA Surface Water Treatment Chemicals Industry Revenue (billion) Forecast, by Application 2020 & 2033
- Table 52: Nordics USA Surface Water Treatment Chemicals Industry Volume (K Tons) Forecast, by Application 2020 & 2033
- Table 53: Rest of Europe USA Surface Water Treatment Chemicals Industry Revenue (billion) Forecast, by Application 2020 & 2033
- Table 54: Rest of Europe USA Surface Water Treatment Chemicals Industry Volume (K Tons) Forecast, by Application 2020 & 2033
- Table 55: Global USA Surface Water Treatment Chemicals Industry Revenue billion Forecast, by Product Type 2020 & 2033
- Table 56: Global USA Surface Water Treatment Chemicals Industry Volume K Tons Forecast, by Product Type 2020 & 2033
- Table 57: Global USA Surface Water Treatment Chemicals Industry Revenue billion Forecast, by End-user Industry 2020 & 2033
- Table 58: Global USA Surface Water Treatment Chemicals Industry Volume K Tons Forecast, by End-user Industry 2020 & 2033
- Table 59: Global USA Surface Water Treatment Chemicals Industry Revenue billion Forecast, by Country 2020 & 2033
- Table 60: Global USA Surface Water Treatment Chemicals Industry Volume K Tons Forecast, by Country 2020 & 2033
- Table 61: Turkey USA Surface Water Treatment Chemicals Industry Revenue (billion) Forecast, by Application 2020 & 2033
- Table 62: Turkey USA Surface Water Treatment Chemicals Industry Volume (K Tons) Forecast, by Application 2020 & 2033
- Table 63: Israel USA Surface Water Treatment Chemicals Industry Revenue (billion) Forecast, by Application 2020 & 2033
- Table 64: Israel USA Surface Water Treatment Chemicals Industry Volume (K Tons) Forecast, by Application 2020 & 2033
- Table 65: GCC USA Surface Water Treatment Chemicals Industry Revenue (billion) Forecast, by Application 2020 & 2033
- Table 66: GCC USA Surface Water Treatment Chemicals Industry Volume (K Tons) Forecast, by Application 2020 & 2033
- Table 67: North Africa USA Surface Water Treatment Chemicals Industry Revenue (billion) Forecast, by Application 2020 & 2033
- Table 68: North Africa USA Surface Water Treatment Chemicals Industry Volume (K Tons) Forecast, by Application 2020 & 2033
- Table 69: South Africa USA Surface Water Treatment Chemicals Industry Revenue (billion) Forecast, by Application 2020 & 2033
- Table 70: South Africa USA Surface Water Treatment Chemicals Industry Volume (K Tons) Forecast, by Application 2020 & 2033
- Table 71: Rest of Middle East & Africa USA Surface Water Treatment Chemicals Industry Revenue (billion) Forecast, by Application 2020 & 2033
- Table 72: Rest of Middle East & Africa USA Surface Water Treatment Chemicals Industry Volume (K Tons) Forecast, by Application 2020 & 2033
- Table 73: Global USA Surface Water Treatment Chemicals Industry Revenue billion Forecast, by Product Type 2020 & 2033
- Table 74: Global USA Surface Water Treatment Chemicals Industry Volume K Tons Forecast, by Product Type 2020 & 2033
- Table 75: Global USA Surface Water Treatment Chemicals Industry Revenue billion Forecast, by End-user Industry 2020 & 2033
- Table 76: Global USA Surface Water Treatment Chemicals Industry Volume K Tons Forecast, by End-user Industry 2020 & 2033
- Table 77: Global USA Surface Water Treatment Chemicals Industry Revenue billion Forecast, by Country 2020 & 2033
- Table 78: Global USA Surface Water Treatment Chemicals Industry Volume K Tons Forecast, by Country 2020 & 2033
- Table 79: China USA Surface Water Treatment Chemicals Industry Revenue (billion) Forecast, by Application 2020 & 2033
- Table 80: China USA Surface Water Treatment Chemicals Industry Volume (K Tons) Forecast, by Application 2020 & 2033
- Table 81: India USA Surface Water Treatment Chemicals Industry Revenue (billion) Forecast, by Application 2020 & 2033
- Table 82: India USA Surface Water Treatment Chemicals Industry Volume (K Tons) Forecast, by Application 2020 & 2033
- Table 83: Japan USA Surface Water Treatment Chemicals Industry Revenue (billion) Forecast, by Application 2020 & 2033
- Table 84: Japan USA Surface Water Treatment Chemicals Industry Volume (K Tons) Forecast, by Application 2020 & 2033
- Table 85: South Korea USA Surface Water Treatment Chemicals Industry Revenue (billion) Forecast, by Application 2020 & 2033
- Table 86: South Korea USA Surface Water Treatment Chemicals Industry Volume (K Tons) Forecast, by Application 2020 & 2033
- Table 87: ASEAN USA Surface Water Treatment Chemicals Industry Revenue (billion) Forecast, by Application 2020 & 2033
- Table 88: ASEAN USA Surface Water Treatment Chemicals Industry Volume (K Tons) Forecast, by Application 2020 & 2033
- Table 89: Oceania USA Surface Water Treatment Chemicals Industry Revenue (billion) Forecast, by Application 2020 & 2033
- Table 90: Oceania USA Surface Water Treatment Chemicals Industry Volume (K Tons) Forecast, by Application 2020 & 2033
- Table 91: Rest of Asia Pacific USA Surface Water Treatment Chemicals Industry Revenue (billion) Forecast, by Application 2020 & 2033
- Table 92: Rest of Asia Pacific USA Surface Water Treatment Chemicals Industry Volume (K Tons) Forecast, by Application 2020 & 2033
Frequently Asked Questions
1. What is the projected Compound Annual Growth Rate (CAGR) of the USA Surface Water Treatment Chemicals Industry?
The projected CAGR is approximately 4.2%.
2. Which companies are prominent players in the USA Surface Water Treatment Chemicals Industry?
Key companies in the market include Ecolab, Nouryon, Solvay, Kurita Water Industries Ltd, USALCO, SUEZ, Kemira, Dow, ChemTreat Inc, Solenis, Buckman Laboratories Inc, Veolia, Albemarle Corporation, Chemtrade.
3. What are the main segments of the USA Surface Water Treatment Chemicals Industry?
The market segments include Product Type, End-user Industry.
4. Can you provide details about the market size?
The market size is estimated to be USD 35.8 billion as of 2022.
5. What are some drivers contributing to market growth?
; Government Initiatives to Control Production and Disposal of wastewater; Other Drivers.
6. What are the notable trends driving market growth?
Corrosion and Scale Inhibitors to Dominate the market.
7. Are there any restraints impacting market growth?
; Impact of COVID-19 on the Industry; High Cost and Hazardous Nature.
8. Can you provide examples of recent developments in the market?
N/A
9. What pricing options are available for accessing the report?
Pricing options include single-user, multi-user, and enterprise licenses priced at USD 3,950, USD 4,950, and USD 6,950 respectively.
10. Is the market size provided in terms of value or volume?
The market size is provided in terms of value, measured in billion and volume, measured in K Tons.
11. Are there any specific market keywords associated with the report?
Yes, the market keyword associated with the report is "USA Surface Water Treatment Chemicals Industry," which aids in identifying and referencing the specific market segment covered.
12. How do I determine which pricing option suits my needs best?
The pricing options vary based on user requirements and access needs. Individual users may opt for single-user licenses, while businesses requiring broader access may choose multi-user or enterprise licenses for cost-effective access to the report.
13. Are there any additional resources or data provided in the USA Surface Water Treatment Chemicals Industry report?
While the report offers comprehensive insights, it's advisable to review the specific contents or supplementary materials provided to ascertain if additional resources or data are available.
14. How can I stay updated on further developments or reports in the USA Surface Water Treatment Chemicals Industry?
To stay informed about further developments, trends, and reports in the USA Surface Water Treatment Chemicals Industry, consider subscribing to industry newsletters, following relevant companies and organizations, or regularly checking reputable industry news sources and publications.
Methodology
Step 1 - Identification of Relevant Samples Size from Population Database


Step 2 - Approaches for Defining Global Market Size (Value, Volume* & Price*)

Note*: In applicable scenarios
Step 3 - Data Sources
Primary Research
- Web Analytics
- Survey Reports
- Research Institute
- Latest Research Reports
- Opinion Leaders
Secondary Research
- Annual Reports
- White Paper
- Latest Press Release
- Industry Association
- Paid Database
- Investor Presentations

Step 4 - Data Triangulation
Involves using different sources of information in order to increase the validity of a study
These sources are likely to be stakeholders in a program - participants, other researchers, program staff, other community members, and so on.
Then we put all data in single framework & apply various statistical tools to find out the dynamic on the market.
During the analysis stage, feedback from the stakeholder groups would be compared to determine areas of agreement as well as areas of divergence