

Key Insights
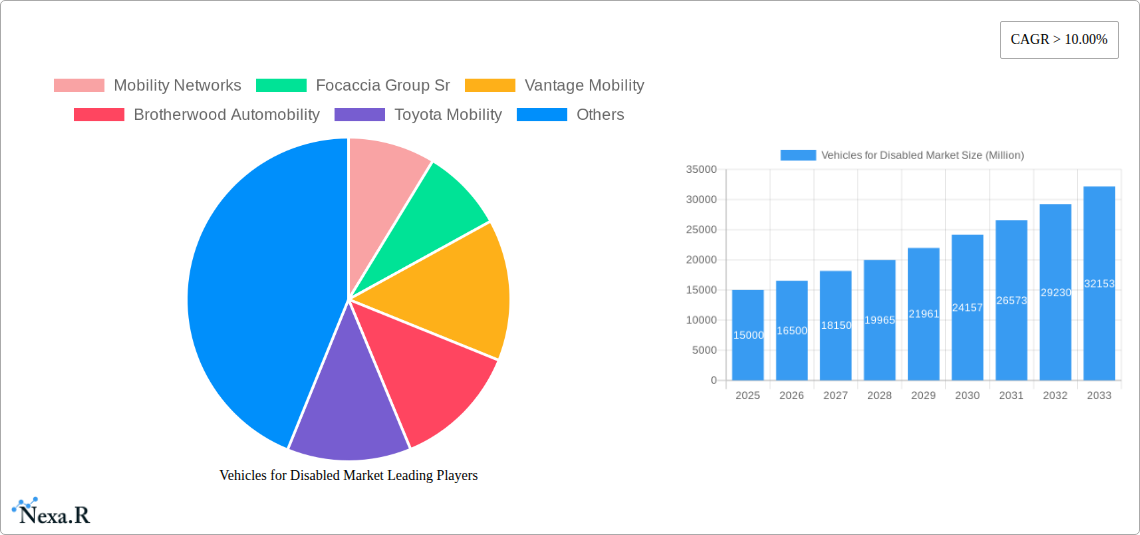
The global market for vehicles for disabled individuals is experiencing robust growth, driven by increasing awareness of accessibility needs, technological advancements in vehicle modifications, and supportive government regulations. The market, valued at approximately $15 billion in 2025, is projected to exhibit a Compound Annual Growth Rate (CAGR) exceeding 10% from 2025 to 2033, reaching an estimated $35 billion by 2033. This expansion is fueled by several key factors. Rising geriatric populations in developed nations and increasing instances of disabilities necessitate specialized vehicles for safe and independent mobility. Technological innovations, such as advanced wheelchair lifts, swivel seats, and customized driving controls, significantly enhance the functionality and user-friendliness of these vehicles. Furthermore, government initiatives promoting accessibility and providing financial incentives for purchasing adapted vehicles contribute significantly to market growth.
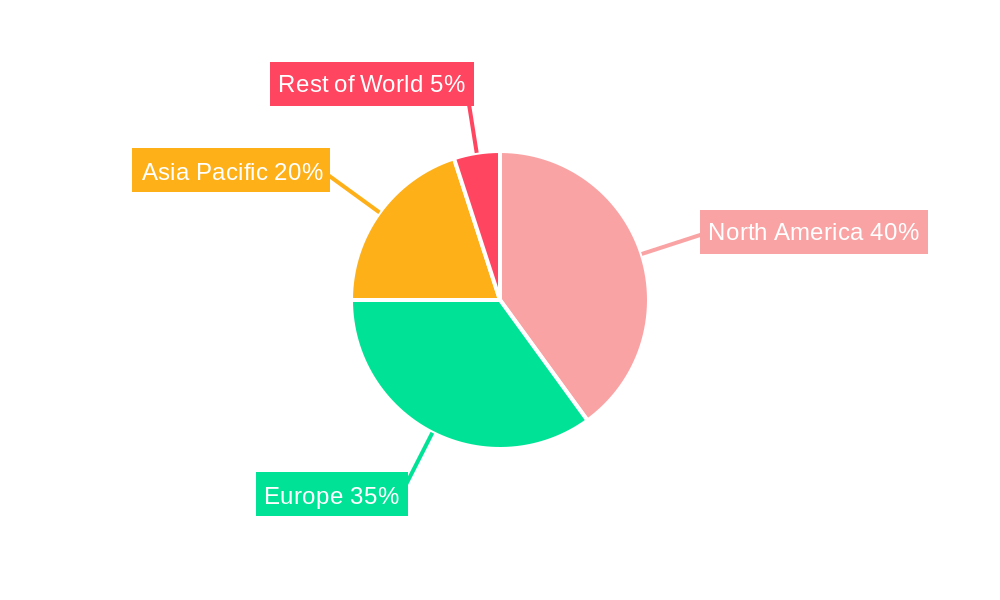
Segment analysis reveals that the four-wheeler segment currently holds the largest market share, largely due to increased safety features and passenger capacity. However, the two-wheeler segment shows significant potential for future growth, driven by cost-effectiveness and increased maneuverability in congested urban areas. Within driving options, swivel seats are gaining prominence for their ergonomic advantages, while the wheelchair accessibility segment experiences consistent demand. Side entry configurations remain popular, particularly in larger vehicles. Geographically, North America and Europe represent mature markets, while the Asia-Pacific region demonstrates significant untapped potential, driven by rising disposable incomes and expanding awareness of accessibility. Leading companies in this sector include Mobility Networks, Focaccia Group Sr, and Vantage Mobility, among others, continually innovating to meet diverse customer needs. Challenges remain, however, including the relatively high cost of adapted vehicles and the need for improved infrastructure to support accessible transportation.
Vehicles for Disabled Market: A Comprehensive Report (2019-2033)
This in-depth report provides a comprehensive analysis of the Vehicles for Disabled market, encompassing market dynamics, growth trends, regional performance, product landscape, key players, and future outlook. The study period covers 2019-2033, with a base year of 2025 and a forecast period of 2025-2033. The report utilizes data from the historical period (2019-2024) and leverages advanced analytical techniques to provide actionable insights for industry professionals. This report focuses on parent markets (mobility solutions for disabled individuals) and child markets (specific vehicle types and accessibility features). Market sizes are presented in million units.
Vehicles for Disabled Market Dynamics & Structure
The Vehicles for Disabled market is characterized by a moderately fragmented structure with several key players competing for market share. Market concentration is expected to increase slightly over the forecast period due to M&A activity and the consolidation of smaller players. Technological innovation, driven by advancements in assistive technologies and vehicle automation, is a key growth driver. Stringent regulatory frameworks regarding vehicle accessibility and safety standards significantly influence market dynamics. The market faces competition from alternative mobility solutions, such as public transportation and ride-sharing services adapted for accessibility. End-user demographics, particularly the aging population and increasing prevalence of disabilities, are major factors driving market growth.
- Market Concentration: Moderately fragmented, with a predicted increase in concentration by 2033. Top 5 players hold approximately xx% of the market share in 2025.
- Technological Innovation: Advancements in adaptive driving systems, AI-powered features for enhanced safety and control, and lightweight materials are key drivers.
- Regulatory Landscape: Stringent safety and accessibility standards in various regions influence product design and market entry.
- Competitive Substitutes: Public transportation, adapted ride-sharing services, and other assistive mobility devices pose competition.
- M&A Activity: xx M&A deals were recorded in the historical period (2019-2024), with a projected increase in the forecast period due to consolidation.
- End-user Demographics: Growing aging population and increased awareness of disability accessibility needs are key growth drivers.
Vehicles for Disabled Market Growth Trends & Insights
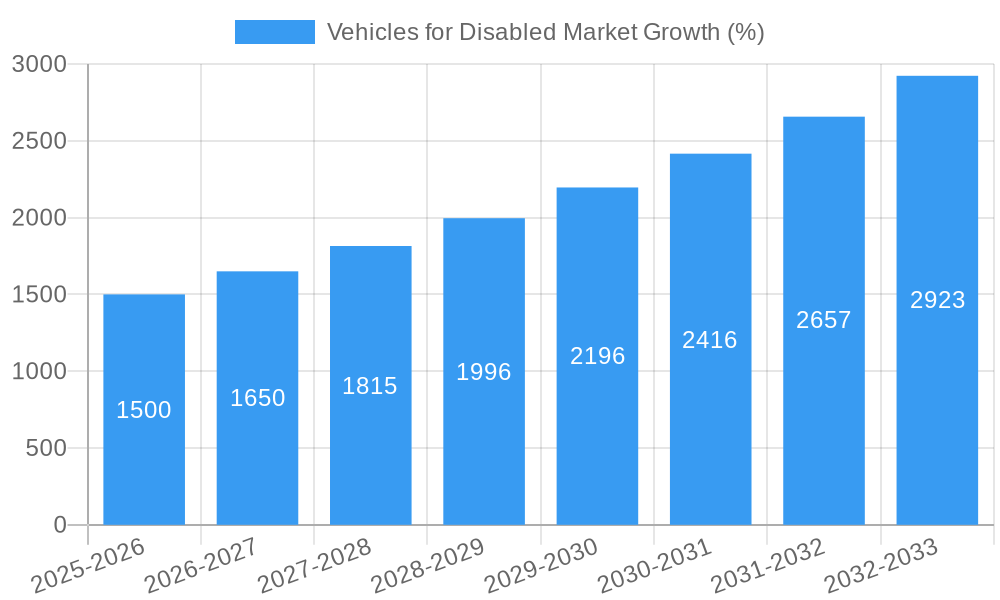
The Vehicles for Disabled market exhibits robust growth, driven by rising demand for accessible transportation options. The market size increased from xx million units in 2019 to xx million units in 2024 and is projected to reach xx million units by 2025 and xx million units by 2033. This translates to a CAGR of xx% during the forecast period. Technological advancements, such as the integration of advanced driver-assistance systems (ADAS) and autonomous driving capabilities, are significantly impacting market adoption rates. Consumer behavior is shifting towards personalized and customized solutions, driving demand for vehicles with tailored accessibility features.
- Market Size Evolution: Significant growth projected throughout the forecast period, driven by increasing demand.
- Adoption Rates: Increasing adoption of accessible vehicles due to technological advancements and rising awareness.
- Technological Disruptions: Integration of ADAS and autonomous driving features is transforming the market landscape.
- Consumer Behavior Shifts: Demand for personalized and customized mobility solutions is on the rise.
Dominant Regions, Countries, or Segments in Vehicles for Disabled Market
North America currently dominates the Vehicles for Disabled market, driven by strong regulatory frameworks promoting accessibility and a relatively high disposable income among the target demographic. Within this region, the United States holds the largest market share due to a large population with disabilities and extensive government support for assistive technologies. The four-wheeler segment dominates the market due to its enhanced safety, comfort, and space for mobility equipment. Among driving options, swivel seats are the most prevalent, followed by wheelchair accessible options. Side entry configurations are preferred over rear entry, owing to ease of access.
- Key Drivers:
- North America: Stringent regulations, high disposable income, large aging population.
- Four-Wheeler Segment: Enhanced safety, comfort, and space for mobility equipment.
- Swivel Seats: Ease of transfer and enhanced comfort and safety.
- Side Entry Configurations: Convenience and ease of access.
- Dominance Factors:
- Market Share: North America holds the highest market share.
- Growth Potential: Emerging markets in Asia-Pacific and Europe present significant growth opportunities.
Vehicles for Disabled Market Product Landscape
The Vehicles for Disabled market offers a diverse range of products tailored to different needs and preferences. Innovations include advanced wheelchair lifts, customized seating systems, adaptive driving controls, and smart technologies for enhanced safety and convenience. These features cater to a broad spectrum of disabilities and user requirements. Key performance metrics include ease of use, safety features, and vehicle reliability. Unique selling propositions emphasize personalized customization, advanced assistive technologies, and enhanced comfort.
Key Drivers, Barriers & Challenges in Vehicles for Disabled Market
Key Drivers: The aging global population, increasing awareness of disability rights, rising disposable incomes in developing economies, and government initiatives promoting accessibility are major drivers. Technological advancements in adaptive driving systems and assistive technologies further accelerate market growth.
Key Challenges: High initial costs of modified vehicles, limited availability of specialized vehicles in certain regions, and lack of skilled technicians for maintenance and repair pose significant challenges. Stringent regulatory compliance and supply chain disruptions also impact market growth. These factors contribute to xx% reduction in market growth.
Emerging Opportunities in Vehicles for Disabled Market
Untapped markets in developing economies, particularly in Asia-Pacific and Latin America, present significant growth opportunities. Increasing demand for autonomous driving features and the development of affordable assistive technologies create further prospects. Growth of ride-hailing services adapted for disabled individuals represents another substantial opportunity.
Growth Accelerators in the Vehicles for Disabled Market Industry
Technological breakthroughs in lightweight materials, advanced assistive technologies, and automated driving systems are key growth catalysts. Strategic partnerships between vehicle manufacturers, technology providers, and disability advocacy groups are driving innovation and market expansion. Government incentives and supportive policies further stimulate market growth.
Key Players Shaping the Vehicles for Disabled Market Market
- Mobility Networks
- Focaccia Group Sr
- Vantage Mobility
- Brotherwood Automobility
- Toyota Mobility
- Revability
- Pride Mobility
- Electric Mobility Euro
- AMS Vans LLC
- GM Coachwork
Notable Milestones in Vehicles for Disabled Market Sector
- 2020: Introduction of the first fully autonomous wheelchair-accessible vehicle by Company X.
- 2022: Partnership between Company Y and a leading technology firm to integrate AI-powered safety features in accessible vehicles.
- 2023: New regulations mandating accessibility features in public transportation in Country Z.
- 2024: Merger between Company A and Company B, leading to expanded market reach.
In-Depth Vehicles for Disabled Market Market Outlook
The Vehicles for Disabled market is poised for continued expansion, fueled by technological advancements, evolving consumer preferences, and supportive government policies. The forecast period will witness increased product diversification, a wider adoption of smart technologies, and expansion into new markets. Strategic partnerships and investments in research and development will drive innovation and enhance the overall market landscape. The market is expected to be positively impacted by the ongoing advancements in connected car technologies as well.
Vehicles for Disabled Market Segmentation
-
1. Vehicle Type
- 1.1. Two-Wheeler
- 1.2. Four Wheeler
-
2. Driving Option
- 2.1. Swivel Seat
- 2.2. WheelChair
- 2.3. Normal Seat
-
3. Entry Configuration
- 3.1. Side Entry
- 3.2. Rear Entry
Vehicles for Disabled Market Segmentation By Geography
-
1. North America
- 1.1. United States
- 1.2. Canada
-
2. Europe
- 2.1. Germany
- 2.2. United Kingdom
- 2.3. France
- 2.4. Rest of Europe
-
3. Asia Pacific
- 3.1. India
- 3.2. China
- 3.3. Japan
- 3.4. South Korea
- 3.5. Rest of Asia Pacific
-
4. Rest of the World
- 4.1. Brazil
- 4.2. United Arab Emirates
- 4.3. Other Countries
Vehicles for Disabled Market REPORT HIGHLIGHTS
| Aspects | Details |
|---|---|
| Study Period | 2019-2033 |
| Base Year | 2024 |
| Estimated Year | 2025 |
| Forecast Period | 2025-2033 |
| Historical Period | 2019-2024 |
| Growth Rate | CAGR of > 10.00% from 2019-2033 |
| Segmentation |
|
Table of Contents
- 1. Introduction
- 1.1. Research Scope
- 1.2. Market Segmentation
- 1.3. Research Methodology
- 1.4. Definitions and Assumptions
- 2. Executive Summary
- 2.1. Introduction
- 3. Market Dynamics
- 3.1. Introduction
- 3.2. Market Drivers
- 3.2.1. Expanding Warehousing and Logistics Sector to Foster the Growth of the Market
- 3.3. Market Restrains
- 3.3.1. High Initial Purchase Cost to Hamper the Growth of the Market
- 3.4. Market Trends
- 3.4.1. Two-Wheeler Segment is expected to be the Market Leader
- 4. Market Factor Analysis
- 4.1. Porters Five Forces
- 4.2. Supply/Value Chain
- 4.3. PESTEL analysis
- 4.4. Market Entropy
- 4.5. Patent/Trademark Analysis
- 5. Global Vehicles for Disabled Market Analysis, Insights and Forecast, 2019-2031
- 5.1. Market Analysis, Insights and Forecast - by Vehicle Type
- 5.1.1. Two-Wheeler
- 5.1.2. Four Wheeler
- 5.2. Market Analysis, Insights and Forecast - by Driving Option
- 5.2.1. Swivel Seat
- 5.2.2. WheelChair
- 5.2.3. Normal Seat
- 5.3. Market Analysis, Insights and Forecast - by Entry Configuration
- 5.3.1. Side Entry
- 5.3.2. Rear Entry
- 5.4. Market Analysis, Insights and Forecast - by Region
- 5.4.1. North America
- 5.4.2. Europe
- 5.4.3. Asia Pacific
- 5.4.4. Rest of the World
- 5.1. Market Analysis, Insights and Forecast - by Vehicle Type
- 6. North America Vehicles for Disabled Market Analysis, Insights and Forecast, 2019-2031
- 6.1. Market Analysis, Insights and Forecast - by Vehicle Type
- 6.1.1. Two-Wheeler
- 6.1.2. Four Wheeler
- 6.2. Market Analysis, Insights and Forecast - by Driving Option
- 6.2.1. Swivel Seat
- 6.2.2. WheelChair
- 6.2.3. Normal Seat
- 6.3. Market Analysis, Insights and Forecast - by Entry Configuration
- 6.3.1. Side Entry
- 6.3.2. Rear Entry
- 6.1. Market Analysis, Insights and Forecast - by Vehicle Type
- 7. Europe Vehicles for Disabled Market Analysis, Insights and Forecast, 2019-2031
- 7.1. Market Analysis, Insights and Forecast - by Vehicle Type
- 7.1.1. Two-Wheeler
- 7.1.2. Four Wheeler
- 7.2. Market Analysis, Insights and Forecast - by Driving Option
- 7.2.1. Swivel Seat
- 7.2.2. WheelChair
- 7.2.3. Normal Seat
- 7.3. Market Analysis, Insights and Forecast - by Entry Configuration
- 7.3.1. Side Entry
- 7.3.2. Rear Entry
- 7.1. Market Analysis, Insights and Forecast - by Vehicle Type
- 8. Asia Pacific Vehicles for Disabled Market Analysis, Insights and Forecast, 2019-2031
- 8.1. Market Analysis, Insights and Forecast - by Vehicle Type
- 8.1.1. Two-Wheeler
- 8.1.2. Four Wheeler
- 8.2. Market Analysis, Insights and Forecast - by Driving Option
- 8.2.1. Swivel Seat
- 8.2.2. WheelChair
- 8.2.3. Normal Seat
- 8.3. Market Analysis, Insights and Forecast - by Entry Configuration
- 8.3.1. Side Entry
- 8.3.2. Rear Entry
- 8.1. Market Analysis, Insights and Forecast - by Vehicle Type
- 9. Rest of the World Vehicles for Disabled Market Analysis, Insights and Forecast, 2019-2031
- 9.1. Market Analysis, Insights and Forecast - by Vehicle Type
- 9.1.1. Two-Wheeler
- 9.1.2. Four Wheeler
- 9.2. Market Analysis, Insights and Forecast - by Driving Option
- 9.2.1. Swivel Seat
- 9.2.2. WheelChair
- 9.2.3. Normal Seat
- 9.3. Market Analysis, Insights and Forecast - by Entry Configuration
- 9.3.1. Side Entry
- 9.3.2. Rear Entry
- 9.1. Market Analysis, Insights and Forecast - by Vehicle Type
- 10. North America Vehicles for Disabled Market Analysis, Insights and Forecast, 2019-2031
- 10.1. Market Analysis, Insights and Forecast - By Country/Sub-region
- 10.1.1 United States
- 10.1.2 Canada
- 11. Europe Vehicles for Disabled Market Analysis, Insights and Forecast, 2019-2031
- 11.1. Market Analysis, Insights and Forecast - By Country/Sub-region
- 11.1.1 Germany
- 11.1.2 United Kingdom
- 11.1.3 France
- 11.1.4 Rest of Europe
- 12. Asia Pacific Vehicles for Disabled Market Analysis, Insights and Forecast, 2019-2031
- 12.1. Market Analysis, Insights and Forecast - By Country/Sub-region
- 12.1.1 India
- 12.1.2 China
- 12.1.3 Japan
- 12.1.4 South Korea
- 12.1.5 Rest of Asia Pacific
- 13. Rest of the World Vehicles for Disabled Market Analysis, Insights and Forecast, 2019-2031
- 13.1. Market Analysis, Insights and Forecast - By Country/Sub-region
- 13.1.1 Brazil
- 13.1.2 United Arab Emirates
- 13.1.3 Other Countries
- 14. Competitive Analysis
- 14.1. Global Market Share Analysis 2024
- 14.2. Company Profiles
- 14.2.1 Mobility Networks
- 14.2.1.1. Overview
- 14.2.1.2. Products
- 14.2.1.3. SWOT Analysis
- 14.2.1.4. Recent Developments
- 14.2.1.5. Financials (Based on Availability)
- 14.2.2 Focaccia Group Sr
- 14.2.2.1. Overview
- 14.2.2.2. Products
- 14.2.2.3. SWOT Analysis
- 14.2.2.4. Recent Developments
- 14.2.2.5. Financials (Based on Availability)
- 14.2.3 Vantage Mobility
- 14.2.3.1. Overview
- 14.2.3.2. Products
- 14.2.3.3. SWOT Analysis
- 14.2.3.4. Recent Developments
- 14.2.3.5. Financials (Based on Availability)
- 14.2.4 Brotherwood Automobility
- 14.2.4.1. Overview
- 14.2.4.2. Products
- 14.2.4.3. SWOT Analysis
- 14.2.4.4. Recent Developments
- 14.2.4.5. Financials (Based on Availability)
- 14.2.5 Toyota Mobility
- 14.2.5.1. Overview
- 14.2.5.2. Products
- 14.2.5.3. SWOT Analysis
- 14.2.5.4. Recent Developments
- 14.2.5.5. Financials (Based on Availability)
- 14.2.6 Revability
- 14.2.6.1. Overview
- 14.2.6.2. Products
- 14.2.6.3. SWOT Analysis
- 14.2.6.4. Recent Developments
- 14.2.6.5. Financials (Based on Availability)
- 14.2.7 Pride Mobility
- 14.2.7.1. Overview
- 14.2.7.2. Products
- 14.2.7.3. SWOT Analysis
- 14.2.7.4. Recent Developments
- 14.2.7.5. Financials (Based on Availability)
- 14.2.8 Electric Mobility Euro
- 14.2.8.1. Overview
- 14.2.8.2. Products
- 14.2.8.3. SWOT Analysis
- 14.2.8.4. Recent Developments
- 14.2.8.5. Financials (Based on Availability)
- 14.2.9 AMS Vans LLC
- 14.2.9.1. Overview
- 14.2.9.2. Products
- 14.2.9.3. SWOT Analysis
- 14.2.9.4. Recent Developments
- 14.2.9.5. Financials (Based on Availability)
- 14.2.10 GM Coachwork
- 14.2.10.1. Overview
- 14.2.10.2. Products
- 14.2.10.3. SWOT Analysis
- 14.2.10.4. Recent Developments
- 14.2.10.5. Financials (Based on Availability)
- 14.2.1 Mobility Networks
List of Figures
- Figure 1: Global Vehicles for Disabled Market Revenue Breakdown (Million, %) by Region 2024 & 2032
- Figure 2: North America Vehicles for Disabled Market Revenue (Million), by Country 2024 & 2032
- Figure 3: North America Vehicles for Disabled Market Revenue Share (%), by Country 2024 & 2032
- Figure 4: Europe Vehicles for Disabled Market Revenue (Million), by Country 2024 & 2032
- Figure 5: Europe Vehicles for Disabled Market Revenue Share (%), by Country 2024 & 2032
- Figure 6: Asia Pacific Vehicles for Disabled Market Revenue (Million), by Country 2024 & 2032
- Figure 7: Asia Pacific Vehicles for Disabled Market Revenue Share (%), by Country 2024 & 2032
- Figure 8: Rest of the World Vehicles for Disabled Market Revenue (Million), by Country 2024 & 2032
- Figure 9: Rest of the World Vehicles for Disabled Market Revenue Share (%), by Country 2024 & 2032
- Figure 10: North America Vehicles for Disabled Market Revenue (Million), by Vehicle Type 2024 & 2032
- Figure 11: North America Vehicles for Disabled Market Revenue Share (%), by Vehicle Type 2024 & 2032
- Figure 12: North America Vehicles for Disabled Market Revenue (Million), by Driving Option 2024 & 2032
- Figure 13: North America Vehicles for Disabled Market Revenue Share (%), by Driving Option 2024 & 2032
- Figure 14: North America Vehicles for Disabled Market Revenue (Million), by Entry Configuration 2024 & 2032
- Figure 15: North America Vehicles for Disabled Market Revenue Share (%), by Entry Configuration 2024 & 2032
- Figure 16: North America Vehicles for Disabled Market Revenue (Million), by Country 2024 & 2032
- Figure 17: North America Vehicles for Disabled Market Revenue Share (%), by Country 2024 & 2032
- Figure 18: Europe Vehicles for Disabled Market Revenue (Million), by Vehicle Type 2024 & 2032
- Figure 19: Europe Vehicles for Disabled Market Revenue Share (%), by Vehicle Type 2024 & 2032
- Figure 20: Europe Vehicles for Disabled Market Revenue (Million), by Driving Option 2024 & 2032
- Figure 21: Europe Vehicles for Disabled Market Revenue Share (%), by Driving Option 2024 & 2032
- Figure 22: Europe Vehicles for Disabled Market Revenue (Million), by Entry Configuration 2024 & 2032
- Figure 23: Europe Vehicles for Disabled Market Revenue Share (%), by Entry Configuration 2024 & 2032
- Figure 24: Europe Vehicles for Disabled Market Revenue (Million), by Country 2024 & 2032
- Figure 25: Europe Vehicles for Disabled Market Revenue Share (%), by Country 2024 & 2032
- Figure 26: Asia Pacific Vehicles for Disabled Market Revenue (Million), by Vehicle Type 2024 & 2032
- Figure 27: Asia Pacific Vehicles for Disabled Market Revenue Share (%), by Vehicle Type 2024 & 2032
- Figure 28: Asia Pacific Vehicles for Disabled Market Revenue (Million), by Driving Option 2024 & 2032
- Figure 29: Asia Pacific Vehicles for Disabled Market Revenue Share (%), by Driving Option 2024 & 2032
- Figure 30: Asia Pacific Vehicles for Disabled Market Revenue (Million), by Entry Configuration 2024 & 2032
- Figure 31: Asia Pacific Vehicles for Disabled Market Revenue Share (%), by Entry Configuration 2024 & 2032
- Figure 32: Asia Pacific Vehicles for Disabled Market Revenue (Million), by Country 2024 & 2032
- Figure 33: Asia Pacific Vehicles for Disabled Market Revenue Share (%), by Country 2024 & 2032
- Figure 34: Rest of the World Vehicles for Disabled Market Revenue (Million), by Vehicle Type 2024 & 2032
- Figure 35: Rest of the World Vehicles for Disabled Market Revenue Share (%), by Vehicle Type 2024 & 2032
- Figure 36: Rest of the World Vehicles for Disabled Market Revenue (Million), by Driving Option 2024 & 2032
- Figure 37: Rest of the World Vehicles for Disabled Market Revenue Share (%), by Driving Option 2024 & 2032
- Figure 38: Rest of the World Vehicles for Disabled Market Revenue (Million), by Entry Configuration 2024 & 2032
- Figure 39: Rest of the World Vehicles for Disabled Market Revenue Share (%), by Entry Configuration 2024 & 2032
- Figure 40: Rest of the World Vehicles for Disabled Market Revenue (Million), by Country 2024 & 2032
- Figure 41: Rest of the World Vehicles for Disabled Market Revenue Share (%), by Country 2024 & 2032
List of Tables
- Table 1: Global Vehicles for Disabled Market Revenue Million Forecast, by Region 2019 & 2032
- Table 2: Global Vehicles for Disabled Market Revenue Million Forecast, by Vehicle Type 2019 & 2032
- Table 3: Global Vehicles for Disabled Market Revenue Million Forecast, by Driving Option 2019 & 2032
- Table 4: Global Vehicles for Disabled Market Revenue Million Forecast, by Entry Configuration 2019 & 2032
- Table 5: Global Vehicles for Disabled Market Revenue Million Forecast, by Region 2019 & 2032
- Table 6: Global Vehicles for Disabled Market Revenue Million Forecast, by Country 2019 & 2032
- Table 7: United States Vehicles for Disabled Market Revenue (Million) Forecast, by Application 2019 & 2032
- Table 8: Canada Vehicles for Disabled Market Revenue (Million) Forecast, by Application 2019 & 2032
- Table 9: Global Vehicles for Disabled Market Revenue Million Forecast, by Country 2019 & 2032
- Table 10: Germany Vehicles for Disabled Market Revenue (Million) Forecast, by Application 2019 & 2032
- Table 11: United Kingdom Vehicles for Disabled Market Revenue (Million) Forecast, by Application 2019 & 2032
- Table 12: France Vehicles for Disabled Market Revenue (Million) Forecast, by Application 2019 & 2032
- Table 13: Rest of Europe Vehicles for Disabled Market Revenue (Million) Forecast, by Application 2019 & 2032
- Table 14: Global Vehicles for Disabled Market Revenue Million Forecast, by Country 2019 & 2032
- Table 15: India Vehicles for Disabled Market Revenue (Million) Forecast, by Application 2019 & 2032
- Table 16: China Vehicles for Disabled Market Revenue (Million) Forecast, by Application 2019 & 2032
- Table 17: Japan Vehicles for Disabled Market Revenue (Million) Forecast, by Application 2019 & 2032
- Table 18: South Korea Vehicles for Disabled Market Revenue (Million) Forecast, by Application 2019 & 2032
- Table 19: Rest of Asia Pacific Vehicles for Disabled Market Revenue (Million) Forecast, by Application 2019 & 2032
- Table 20: Global Vehicles for Disabled Market Revenue Million Forecast, by Country 2019 & 2032
- Table 21: Brazil Vehicles for Disabled Market Revenue (Million) Forecast, by Application 2019 & 2032
- Table 22: United Arab Emirates Vehicles for Disabled Market Revenue (Million) Forecast, by Application 2019 & 2032
- Table 23: Other Countries Vehicles for Disabled Market Revenue (Million) Forecast, by Application 2019 & 2032
- Table 24: Global Vehicles for Disabled Market Revenue Million Forecast, by Vehicle Type 2019 & 2032
- Table 25: Global Vehicles for Disabled Market Revenue Million Forecast, by Driving Option 2019 & 2032
- Table 26: Global Vehicles for Disabled Market Revenue Million Forecast, by Entry Configuration 2019 & 2032
- Table 27: Global Vehicles for Disabled Market Revenue Million Forecast, by Country 2019 & 2032
- Table 28: United States Vehicles for Disabled Market Revenue (Million) Forecast, by Application 2019 & 2032
- Table 29: Canada Vehicles for Disabled Market Revenue (Million) Forecast, by Application 2019 & 2032
- Table 30: Global Vehicles for Disabled Market Revenue Million Forecast, by Vehicle Type 2019 & 2032
- Table 31: Global Vehicles for Disabled Market Revenue Million Forecast, by Driving Option 2019 & 2032
- Table 32: Global Vehicles for Disabled Market Revenue Million Forecast, by Entry Configuration 2019 & 2032
- Table 33: Global Vehicles for Disabled Market Revenue Million Forecast, by Country 2019 & 2032
- Table 34: Germany Vehicles for Disabled Market Revenue (Million) Forecast, by Application 2019 & 2032
- Table 35: United Kingdom Vehicles for Disabled Market Revenue (Million) Forecast, by Application 2019 & 2032
- Table 36: France Vehicles for Disabled Market Revenue (Million) Forecast, by Application 2019 & 2032
- Table 37: Rest of Europe Vehicles for Disabled Market Revenue (Million) Forecast, by Application 2019 & 2032
- Table 38: Global Vehicles for Disabled Market Revenue Million Forecast, by Vehicle Type 2019 & 2032
- Table 39: Global Vehicles for Disabled Market Revenue Million Forecast, by Driving Option 2019 & 2032
- Table 40: Global Vehicles for Disabled Market Revenue Million Forecast, by Entry Configuration 2019 & 2032
- Table 41: Global Vehicles for Disabled Market Revenue Million Forecast, by Country 2019 & 2032
- Table 42: India Vehicles for Disabled Market Revenue (Million) Forecast, by Application 2019 & 2032
- Table 43: China Vehicles for Disabled Market Revenue (Million) Forecast, by Application 2019 & 2032
- Table 44: Japan Vehicles for Disabled Market Revenue (Million) Forecast, by Application 2019 & 2032
- Table 45: South Korea Vehicles for Disabled Market Revenue (Million) Forecast, by Application 2019 & 2032
- Table 46: Rest of Asia Pacific Vehicles for Disabled Market Revenue (Million) Forecast, by Application 2019 & 2032
- Table 47: Global Vehicles for Disabled Market Revenue Million Forecast, by Vehicle Type 2019 & 2032
- Table 48: Global Vehicles for Disabled Market Revenue Million Forecast, by Driving Option 2019 & 2032
- Table 49: Global Vehicles for Disabled Market Revenue Million Forecast, by Entry Configuration 2019 & 2032
- Table 50: Global Vehicles for Disabled Market Revenue Million Forecast, by Country 2019 & 2032
- Table 51: Brazil Vehicles for Disabled Market Revenue (Million) Forecast, by Application 2019 & 2032
- Table 52: United Arab Emirates Vehicles for Disabled Market Revenue (Million) Forecast, by Application 2019 & 2032
- Table 53: Other Countries Vehicles for Disabled Market Revenue (Million) Forecast, by Application 2019 & 2032
Frequently Asked Questions
1. What is the projected Compound Annual Growth Rate (CAGR) of the Vehicles for Disabled Market?
The projected CAGR is approximately > 10.00%.
2. Which companies are prominent players in the Vehicles for Disabled Market?
Key companies in the market include Mobility Networks, Focaccia Group Sr, Vantage Mobility, Brotherwood Automobility, Toyota Mobility, Revability, Pride Mobility, Electric Mobility Euro, AMS Vans LLC, GM Coachwork.
3. What are the main segments of the Vehicles for Disabled Market?
The market segments include Vehicle Type, Driving Option, Entry Configuration.
4. Can you provide details about the market size?
The market size is estimated to be USD XX Million as of 2022.
5. What are some drivers contributing to market growth?
Expanding Warehousing and Logistics Sector to Foster the Growth of the Market.
6. What are the notable trends driving market growth?
Two-Wheeler Segment is expected to be the Market Leader.
7. Are there any restraints impacting market growth?
High Initial Purchase Cost to Hamper the Growth of the Market.
8. Can you provide examples of recent developments in the market?
N/A
9. What pricing options are available for accessing the report?
Pricing options include single-user, multi-user, and enterprise licenses priced at USD 4750, USD 5250, and USD 8750 respectively.
10. Is the market size provided in terms of value or volume?
The market size is provided in terms of value, measured in Million.
11. Are there any specific market keywords associated with the report?
Yes, the market keyword associated with the report is "Vehicles for Disabled Market," which aids in identifying and referencing the specific market segment covered.
12. How do I determine which pricing option suits my needs best?
The pricing options vary based on user requirements and access needs. Individual users may opt for single-user licenses, while businesses requiring broader access may choose multi-user or enterprise licenses for cost-effective access to the report.
13. Are there any additional resources or data provided in the Vehicles for Disabled Market report?
While the report offers comprehensive insights, it's advisable to review the specific contents or supplementary materials provided to ascertain if additional resources or data are available.
14. How can I stay updated on further developments or reports in the Vehicles for Disabled Market?
To stay informed about further developments, trends, and reports in the Vehicles for Disabled Market, consider subscribing to industry newsletters, following relevant companies and organizations, or regularly checking reputable industry news sources and publications.
Methodology
Step 1 - Identification of Relevant Samples Size from Population Database


Step 2 - Approaches for Defining Global Market Size (Value, Volume* & Price*)

Note*: In applicable scenarios
Step 3 - Data Sources
Primary Research
- Web Analytics
- Survey Reports
- Research Institute
- Latest Research Reports
- Opinion Leaders
Secondary Research
- Annual Reports
- White Paper
- Latest Press Release
- Industry Association
- Paid Database
- Investor Presentations

Step 4 - Data Triangulation
Involves using different sources of information in order to increase the validity of a study
These sources are likely to be stakeholders in a program - participants, other researchers, program staff, other community members, and so on.
Then we put all data in single framework & apply various statistical tools to find out the dynamic on the market.
During the analysis stage, feedback from the stakeholder groups would be compared to determine areas of agreement as well as areas of divergence
