

Key Insights
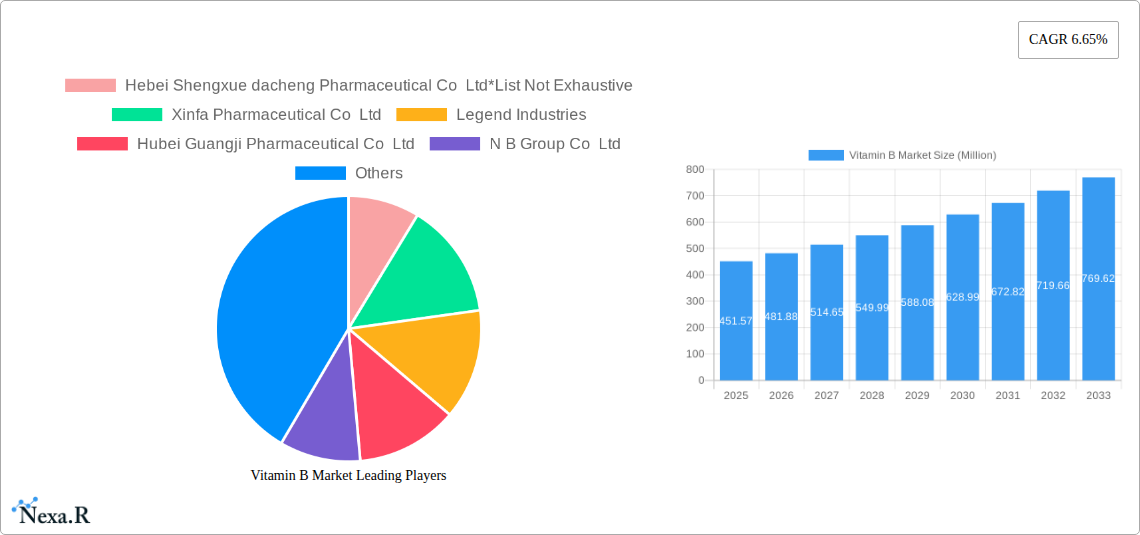
The global Vitamin B market, valued at $451.57 million in 2025, is projected to experience robust growth, driven by increasing health consciousness and the rising demand for nutritional supplements across various applications. The market's Compound Annual Growth Rate (CAGR) of 6.65% from 2025 to 2033 indicates a significant expansion opportunity. Key drivers include the growing prevalence of vitamin deficiencies, particularly in developing countries, coupled with the increasing adoption of vitamin B supplements in food and beverages, dietary supplements, and pharmaceuticals. The powder form dominates the market due to its versatility and cost-effectiveness in manufacturing and distribution, while the food and beverage segment holds a considerable market share due to the rising demand for fortified foods and functional beverages. Furthermore, the growing awareness of the role of Vitamin B in maintaining overall health and well-being, including boosting immunity and cognitive function, fuels market growth. Consumer preference for natural and organic Vitamin B sources is also a contributing factor shaping market trends. While regulatory changes and potential price fluctuations in raw materials pose certain restraints, the market's long-term outlook remains positive due to its wide applications and the sustained emphasis on preventive healthcare.
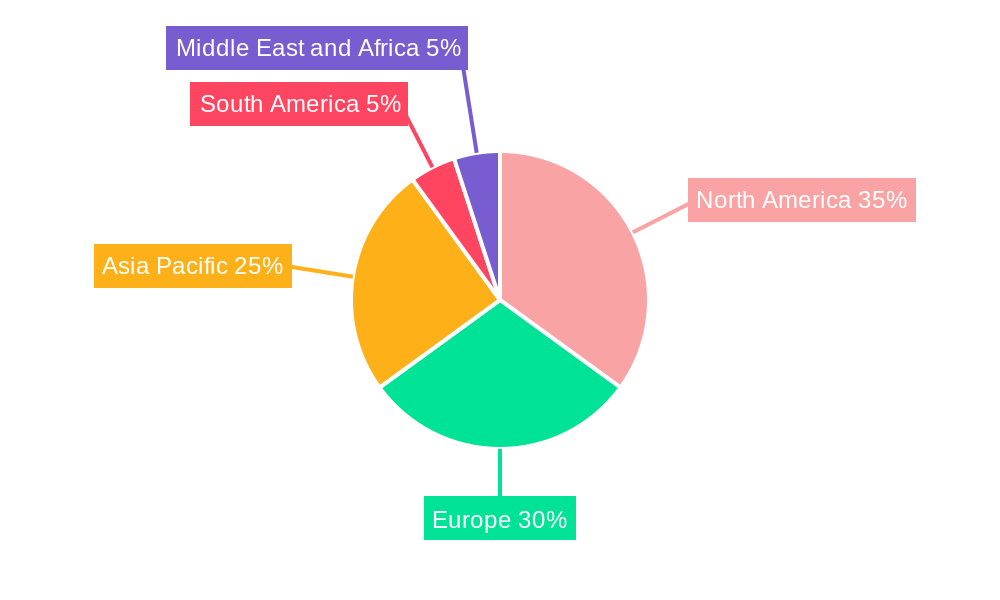
The regional distribution of the Vitamin B market reflects a dynamic landscape. North America and Europe currently hold significant shares, driven by high disposable incomes and established healthcare infrastructure. However, the Asia-Pacific region is expected to witness the fastest growth rate during the forecast period, propelled by increasing urbanization, rising health awareness among consumers, and significant expansion in the food and beverage industry within the region. Companies like BASF SE, DSM, and several prominent pharmaceutical companies are actively involved in developing innovative Vitamin B products and expanding their market presence. Strategic partnerships, product innovation, and geographical expansion are expected to be key competitive strategies for companies seeking success in this expanding market.
Vitamin B Market: A Comprehensive Report (2019-2033)
This comprehensive report provides a detailed analysis of the Vitamin B market, encompassing market dynamics, growth trends, regional dominance, product landscape, key players, and future outlook. The study period covers 2019-2033, with 2025 as the base and estimated year. This report is invaluable for industry professionals, investors, and strategic decision-makers seeking to understand and capitalize on opportunities within this dynamic market. The Vitamin B market, encompassing both the parent market (Vitamins) and child markets (Food & Beverages, Dietary Supplements, Pharmaceuticals etc.), is projected to reach xx Million units by 2033.
Vitamin B Market Market Dynamics & Structure
The Vitamin B market is characterized by moderate concentration, with several key players holding significant market share. Technological innovation, particularly in delivery systems and enhanced bioavailability, is a major driver. Stringent regulatory frameworks governing food and pharmaceutical applications influence market dynamics. Competitive substitutes, such as other vitamin complexes or naturally occurring sources, present challenges. End-user demographics, including age, health consciousness, and dietary habits, significantly impact demand. The market has witnessed several mergers and acquisitions (M&A) in recent years, reflecting industry consolidation.
- Market Concentration: Moderately concentrated, with top 5 players holding approximately xx% market share in 2024.
- Technological Innovation: Focus on liposomal delivery systems, targeted release formulations, and enhanced bioavailability.
- Regulatory Landscape: Stringent regulations regarding purity, labeling, and safety standards, particularly in pharmaceutical and food applications.
- Competitive Substitutes: Competition from other vitamin complexes and natural food sources rich in Vitamin B.
- End-User Demographics: Growing demand driven by aging populations, increasing health awareness, and rising disposable incomes.
- M&A Activity: Significant M&A activity in recent years, driven by consolidation and expansion strategies (e.g., xx major deals in the past 5 years).
Vitamin B Market Growth Trends & Insights
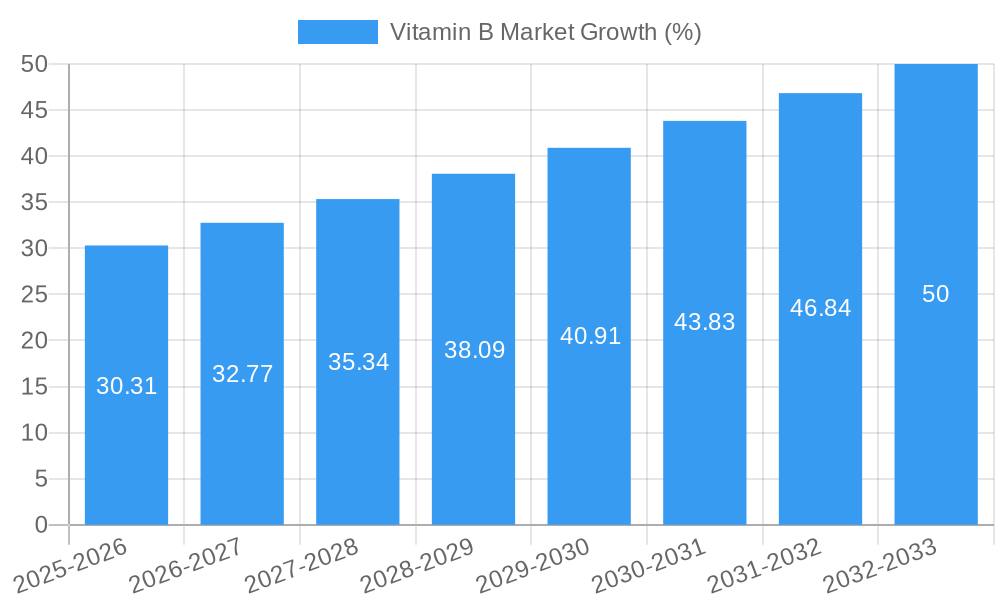
The Vitamin B market experienced steady growth during the historical period (2019-2024), driven by factors such as rising health consciousness, increasing demand for dietary supplements, and the growing use of Vitamin B in various applications. The market is expected to continue its growth trajectory during the forecast period (2025-2033), with a projected Compound Annual Growth Rate (CAGR) of xx% from 2025-2033. This growth is further fueled by advancements in formulation technology, expansion into new applications, and increasing consumer awareness of the health benefits of Vitamin B. Technological disruptions, such as improved analytical techniques, and shifts in consumer behavior, favoring natural and functional foods, significantly impact adoption rates and overall market penetration. Market penetration in key segments like dietary supplements shows strong growth potential. Specific regional factors also contribute to these trends (see section 3).
Dominant Regions, Countries, or Segments in Vitamin B Market
The Dietary Supplements segment is currently the leading application area for Vitamin B, driven by the increasing consumer demand for health and wellness products. North America and Europe are currently the dominant regions, due to higher consumer awareness and adoption of vitamin supplements and fortified foods. However, the Asia-Pacific region is poised for substantial growth due to its expanding population, rising disposable incomes, and increasing health consciousness. The Powder form of Vitamin B currently holds the largest market share owing to its cost-effectiveness and widespread application across various industries.
Key Drivers:
- Dietary Supplements Segment: Rising consumer demand for functional foods and health supplements.
- North America and Europe: High levels of health awareness, strong regulatory frameworks, and established distribution networks.
- Asia-Pacific: Rapidly expanding population, rising disposable incomes, and increasing health consciousness.
- Powder Form: Cost-effectiveness and suitability for various applications.
Dominance Factors: High market share, robust growth potential, and strong demand from various end-user segments.
Vitamin B Market Product Landscape
Vitamin B products are available in various forms (powder, liquid, capsules) and are used across numerous applications, including food & beverages, dietary supplements, pharmaceuticals, animal feed, and personal care. Innovations focus on enhancing bioavailability, stability, and delivery methods, such as liposomal encapsulation and targeted release formulations. The unique selling propositions of different products vary according to their purity, source (synthetic or natural), and formulation. Technological advancements include the development of more sustainable and efficient manufacturing processes.
Key Drivers, Barriers & Challenges in Vitamin B Market
Key Drivers:
- Growing awareness of the health benefits of Vitamin B.
- Increasing demand for fortified foods and dietary supplements.
- Expanding applications in various industries (pharmaceuticals, animal feed, cosmetics).
- Technological advancements leading to improved product formulations.
Challenges & Restraints:
- Fluctuations in raw material prices impacting production costs.
- Stringent regulatory requirements in different regions imposing compliance burdens.
- Intense competition from various players in the market.
- Potential for adulteration and quality control issues.
Emerging Opportunities in Vitamin B Market
- Growing demand for personalized nutrition and functional foods.
- Development of novel delivery systems for enhanced bioavailability.
- Expansion into emerging markets with high growth potential.
- Increasing focus on natural and sustainable Vitamin B sources.
Growth Accelerators in the Vitamin B Market Industry
Strategic collaborations and partnerships to leverage R&D and market access are significantly accelerating market growth. Technological innovations in delivery systems and sustainable production methods are further propelling expansion. Government initiatives promoting health and wellness, alongside expanding market penetration into emerging economies, enhance the overall growth trajectory.
Key Players Shaping the Vitamin B Market Market
- BASF SE
- Koninklijke DSM NV
- Hebei Shengxue dacheng Pharmaceutical Co Ltd
- Xinfa Pharmaceutical Co Ltd
- Legend Industries
- Hubei Guangji Pharmaceutical Co Ltd
- N B Group Co Ltd
- Shanghai Acebright Pharmaceuticals Group Co Ltd
- Parchem Fine & Specialty Chemicals
- Shanghai Hegno Pharmaceutical Holding Co Ltd
Notable Milestones in Vitamin B Market Sector
- May 2023: DSM-Firmenich AG completed its merger with Firmenich International SA, creating a major player in the nutrition, health, and beauty sectors. This consolidation strengthens the market and impacts the competitive landscape.
- May 2022: Royal DSM's merger agreement with Firmenich signaled a major shift in industry consolidation, promising increased innovation and market reach.
- December 2021: Kobe University's study highlighted the anti-aging potential of Vitamin B2, fueling demand and research into its applications.
In-Depth Vitamin B Market Market Outlook
The Vitamin B market is poised for continued growth driven by increasing health awareness, the development of innovative formulations, and expansion into new applications. Strategic partnerships, technological advancements, and expansion into emerging markets present significant opportunities for future growth. The market's potential is substantial, with opportunities for innovation in personalized nutrition and sustainable production.
Vitamin B Market Segmentation
-
1. Form
- 1.1. Powder
- 1.2. Liquid
-
2. Application
- 2.1. Food and Beverages
- 2.2. Dietary Suppplements
- 2.3. Pharmaceuticals
- 2.4. Animal Feed
- 2.5. Personal Care
- 2.6. Other Applications
Vitamin B Market Segmentation By Geography
-
1. North America
- 1.1. United States
- 1.2. Canada
- 1.3. Mexico
- 1.4. Rest of North America
-
2. Europe
- 2.1. Spain
- 2.2. United Kingdom
- 2.3. Germany
- 2.4. France
- 2.5. Italy
- 2.6. Russia
- 2.7. Rest of Europe
-
3. Asia Pacific
- 3.1. China
- 3.2. Japan
- 3.3. India
- 3.4. Australia
- 3.5. Rest of Asia Pacific
-
4. South America
- 4.1. Brazil
- 4.2. Argentina
- 4.3. Rest of South America
-
5. Middle East and Africa
- 5.1. South Africa
- 5.2. Saudi Arabia
- 5.3. Rest of Middle East and Africa
Vitamin B Market REPORT HIGHLIGHTS
| Aspects | Details |
|---|---|
| Study Period | 2019-2033 |
| Base Year | 2024 |
| Estimated Year | 2025 |
| Forecast Period | 2025-2033 |
| Historical Period | 2019-2024 |
| Growth Rate | CAGR of 6.65% from 2019-2033 |
| Segmentation |
|
Table of Contents
- 1. Introduction
- 1.1. Research Scope
- 1.2. Market Segmentation
- 1.3. Research Methodology
- 1.4. Definitions and Assumptions
- 2. Executive Summary
- 2.1. Introduction
- 3. Market Dynamics
- 3.1. Introduction
- 3.2. Market Drivers
- 3.2.1. Increasing Demand for Functional and Fortified Food; Multi-functionality and Wide Application of Riboflavin
- 3.3. Market Restrains
- 3.3.1. Low Stability of Riboflavin on Exposure to Light and Heat
- 3.4. Market Trends
- 3.4.1. Increasing Demand for Functional and Fortified Food
- 4. Market Factor Analysis
- 4.1. Porters Five Forces
- 4.2. Supply/Value Chain
- 4.3. PESTEL analysis
- 4.4. Market Entropy
- 4.5. Patent/Trademark Analysis
- 5. Global Vitamin B Market Analysis, Insights and Forecast, 2019-2031
- 5.1. Market Analysis, Insights and Forecast - by Form
- 5.1.1. Powder
- 5.1.2. Liquid
- 5.2. Market Analysis, Insights and Forecast - by Application
- 5.2.1. Food and Beverages
- 5.2.2. Dietary Suppplements
- 5.2.3. Pharmaceuticals
- 5.2.4. Animal Feed
- 5.2.5. Personal Care
- 5.2.6. Other Applications
- 5.3. Market Analysis, Insights and Forecast - by Region
- 5.3.1. North America
- 5.3.2. Europe
- 5.3.3. Asia Pacific
- 5.3.4. South America
- 5.3.5. Middle East and Africa
- 5.1. Market Analysis, Insights and Forecast - by Form
- 6. North America Vitamin B Market Analysis, Insights and Forecast, 2019-2031
- 6.1. Market Analysis, Insights and Forecast - by Form
- 6.1.1. Powder
- 6.1.2. Liquid
- 6.2. Market Analysis, Insights and Forecast - by Application
- 6.2.1. Food and Beverages
- 6.2.2. Dietary Suppplements
- 6.2.3. Pharmaceuticals
- 6.2.4. Animal Feed
- 6.2.5. Personal Care
- 6.2.6. Other Applications
- 6.1. Market Analysis, Insights and Forecast - by Form
- 7. Europe Vitamin B Market Analysis, Insights and Forecast, 2019-2031
- 7.1. Market Analysis, Insights and Forecast - by Form
- 7.1.1. Powder
- 7.1.2. Liquid
- 7.2. Market Analysis, Insights and Forecast - by Application
- 7.2.1. Food and Beverages
- 7.2.2. Dietary Suppplements
- 7.2.3. Pharmaceuticals
- 7.2.4. Animal Feed
- 7.2.5. Personal Care
- 7.2.6. Other Applications
- 7.1. Market Analysis, Insights and Forecast - by Form
- 8. Asia Pacific Vitamin B Market Analysis, Insights and Forecast, 2019-2031
- 8.1. Market Analysis, Insights and Forecast - by Form
- 8.1.1. Powder
- 8.1.2. Liquid
- 8.2. Market Analysis, Insights and Forecast - by Application
- 8.2.1. Food and Beverages
- 8.2.2. Dietary Suppplements
- 8.2.3. Pharmaceuticals
- 8.2.4. Animal Feed
- 8.2.5. Personal Care
- 8.2.6. Other Applications
- 8.1. Market Analysis, Insights and Forecast - by Form
- 9. South America Vitamin B Market Analysis, Insights and Forecast, 2019-2031
- 9.1. Market Analysis, Insights and Forecast - by Form
- 9.1.1. Powder
- 9.1.2. Liquid
- 9.2. Market Analysis, Insights and Forecast - by Application
- 9.2.1. Food and Beverages
- 9.2.2. Dietary Suppplements
- 9.2.3. Pharmaceuticals
- 9.2.4. Animal Feed
- 9.2.5. Personal Care
- 9.2.6. Other Applications
- 9.1. Market Analysis, Insights and Forecast - by Form
- 10. Middle East and Africa Vitamin B Market Analysis, Insights and Forecast, 2019-2031
- 10.1. Market Analysis, Insights and Forecast - by Form
- 10.1.1. Powder
- 10.1.2. Liquid
- 10.2. Market Analysis, Insights and Forecast - by Application
- 10.2.1. Food and Beverages
- 10.2.2. Dietary Suppplements
- 10.2.3. Pharmaceuticals
- 10.2.4. Animal Feed
- 10.2.5. Personal Care
- 10.2.6. Other Applications
- 10.1. Market Analysis, Insights and Forecast - by Form
- 11. North America Vitamin B Market Analysis, Insights and Forecast, 2019-2031
- 11.1. Market Analysis, Insights and Forecast - By Country/Sub-region
- 11.1.1 United States
- 11.1.2 Canada
- 11.1.3 Mexico
- 11.1.4 Rest of North America
- 12. Europe Vitamin B Market Analysis, Insights and Forecast, 2019-2031
- 12.1. Market Analysis, Insights and Forecast - By Country/Sub-region
- 12.1.1 Spain
- 12.1.2 United Kingdom
- 12.1.3 Germany
- 12.1.4 France
- 12.1.5 Italy
- 12.1.6 Russia
- 12.1.7 Rest of Europe
- 13. Asia Pacific Vitamin B Market Analysis, Insights and Forecast, 2019-2031
- 13.1. Market Analysis, Insights and Forecast - By Country/Sub-region
- 13.1.1 China
- 13.1.2 Japan
- 13.1.3 India
- 13.1.4 Australia
- 13.1.5 Rest of Asia Pacific
- 14. South America Vitamin B Market Analysis, Insights and Forecast, 2019-2031
- 14.1. Market Analysis, Insights and Forecast - By Country/Sub-region
- 14.1.1 Brazil
- 14.1.2 Argentina
- 14.1.3 Rest of South America
- 15. Middle East and Africa Vitamin B Market Analysis, Insights and Forecast, 2019-2031
- 15.1. Market Analysis, Insights and Forecast - By Country/Sub-region
- 15.1.1 South Africa
- 15.1.2 Saudi Arabia
- 15.1.3 Rest of Middle East and Africa
- 16. Competitive Analysis
- 16.1. Global Market Share Analysis 2024
- 16.2. Company Profiles
- 16.2.1 Hebei Shengxue dacheng Pharmaceutical Co Ltd*List Not Exhaustive
- 16.2.1.1. Overview
- 16.2.1.2. Products
- 16.2.1.3. SWOT Analysis
- 16.2.1.4. Recent Developments
- 16.2.1.5. Financials (Based on Availability)
- 16.2.2 Xinfa Pharmaceutical Co Ltd
- 16.2.2.1. Overview
- 16.2.2.2. Products
- 16.2.2.3. SWOT Analysis
- 16.2.2.4. Recent Developments
- 16.2.2.5. Financials (Based on Availability)
- 16.2.3 Legend Industries
- 16.2.3.1. Overview
- 16.2.3.2. Products
- 16.2.3.3. SWOT Analysis
- 16.2.3.4. Recent Developments
- 16.2.3.5. Financials (Based on Availability)
- 16.2.4 Hubei Guangji Pharmaceutical Co Ltd
- 16.2.4.1. Overview
- 16.2.4.2. Products
- 16.2.4.3. SWOT Analysis
- 16.2.4.4. Recent Developments
- 16.2.4.5. Financials (Based on Availability)
- 16.2.5 N B Group Co Ltd
- 16.2.5.1. Overview
- 16.2.5.2. Products
- 16.2.5.3. SWOT Analysis
- 16.2.5.4. Recent Developments
- 16.2.5.5. Financials (Based on Availability)
- 16.2.6 BASF SE
- 16.2.6.1. Overview
- 16.2.6.2. Products
- 16.2.6.3. SWOT Analysis
- 16.2.6.4. Recent Developments
- 16.2.6.5. Financials (Based on Availability)
- 16.2.7 Shanghai Acebright Pharmaceuticals Group Co Ltd
- 16.2.7.1. Overview
- 16.2.7.2. Products
- 16.2.7.3. SWOT Analysis
- 16.2.7.4. Recent Developments
- 16.2.7.5. Financials (Based on Availability)
- 16.2.8 Parchem Fine & Specialty Chemicals
- 16.2.8.1. Overview
- 16.2.8.2. Products
- 16.2.8.3. SWOT Analysis
- 16.2.8.4. Recent Developments
- 16.2.8.5. Financials (Based on Availability)
- 16.2.9 Shanghai Hegno Pharmaceutical Holding Co Ltd
- 16.2.9.1. Overview
- 16.2.9.2. Products
- 16.2.9.3. SWOT Analysis
- 16.2.9.4. Recent Developments
- 16.2.9.5. Financials (Based on Availability)
- 16.2.10 Koninklijke DSM NV
- 16.2.10.1. Overview
- 16.2.10.2. Products
- 16.2.10.3. SWOT Analysis
- 16.2.10.4. Recent Developments
- 16.2.10.5. Financials (Based on Availability)
- 16.2.1 Hebei Shengxue dacheng Pharmaceutical Co Ltd*List Not Exhaustive
List of Figures
- Figure 1: Global Vitamin B Market Revenue Breakdown (Million, %) by Region 2024 & 2032
- Figure 2: Global Vitamin B Market Volume Breakdown (Tons, %) by Region 2024 & 2032
- Figure 3: North America Vitamin B Market Revenue (Million), by Country 2024 & 2032
- Figure 4: North America Vitamin B Market Volume (Tons), by Country 2024 & 2032
- Figure 5: North America Vitamin B Market Revenue Share (%), by Country 2024 & 2032
- Figure 6: North America Vitamin B Market Volume Share (%), by Country 2024 & 2032
- Figure 7: Europe Vitamin B Market Revenue (Million), by Country 2024 & 2032
- Figure 8: Europe Vitamin B Market Volume (Tons), by Country 2024 & 2032
- Figure 9: Europe Vitamin B Market Revenue Share (%), by Country 2024 & 2032
- Figure 10: Europe Vitamin B Market Volume Share (%), by Country 2024 & 2032
- Figure 11: Asia Pacific Vitamin B Market Revenue (Million), by Country 2024 & 2032
- Figure 12: Asia Pacific Vitamin B Market Volume (Tons), by Country 2024 & 2032
- Figure 13: Asia Pacific Vitamin B Market Revenue Share (%), by Country 2024 & 2032
- Figure 14: Asia Pacific Vitamin B Market Volume Share (%), by Country 2024 & 2032
- Figure 15: South America Vitamin B Market Revenue (Million), by Country 2024 & 2032
- Figure 16: South America Vitamin B Market Volume (Tons), by Country 2024 & 2032
- Figure 17: South America Vitamin B Market Revenue Share (%), by Country 2024 & 2032
- Figure 18: South America Vitamin B Market Volume Share (%), by Country 2024 & 2032
- Figure 19: Middle East and Africa Vitamin B Market Revenue (Million), by Country 2024 & 2032
- Figure 20: Middle East and Africa Vitamin B Market Volume (Tons), by Country 2024 & 2032
- Figure 21: Middle East and Africa Vitamin B Market Revenue Share (%), by Country 2024 & 2032
- Figure 22: Middle East and Africa Vitamin B Market Volume Share (%), by Country 2024 & 2032
- Figure 23: North America Vitamin B Market Revenue (Million), by Form 2024 & 2032
- Figure 24: North America Vitamin B Market Volume (Tons), by Form 2024 & 2032
- Figure 25: North America Vitamin B Market Revenue Share (%), by Form 2024 & 2032
- Figure 26: North America Vitamin B Market Volume Share (%), by Form 2024 & 2032
- Figure 27: North America Vitamin B Market Revenue (Million), by Application 2024 & 2032
- Figure 28: North America Vitamin B Market Volume (Tons), by Application 2024 & 2032
- Figure 29: North America Vitamin B Market Revenue Share (%), by Application 2024 & 2032
- Figure 30: North America Vitamin B Market Volume Share (%), by Application 2024 & 2032
- Figure 31: North America Vitamin B Market Revenue (Million), by Country 2024 & 2032
- Figure 32: North America Vitamin B Market Volume (Tons), by Country 2024 & 2032
- Figure 33: North America Vitamin B Market Revenue Share (%), by Country 2024 & 2032
- Figure 34: North America Vitamin B Market Volume Share (%), by Country 2024 & 2032
- Figure 35: Europe Vitamin B Market Revenue (Million), by Form 2024 & 2032
- Figure 36: Europe Vitamin B Market Volume (Tons), by Form 2024 & 2032
- Figure 37: Europe Vitamin B Market Revenue Share (%), by Form 2024 & 2032
- Figure 38: Europe Vitamin B Market Volume Share (%), by Form 2024 & 2032
- Figure 39: Europe Vitamin B Market Revenue (Million), by Application 2024 & 2032
- Figure 40: Europe Vitamin B Market Volume (Tons), by Application 2024 & 2032
- Figure 41: Europe Vitamin B Market Revenue Share (%), by Application 2024 & 2032
- Figure 42: Europe Vitamin B Market Volume Share (%), by Application 2024 & 2032
- Figure 43: Europe Vitamin B Market Revenue (Million), by Country 2024 & 2032
- Figure 44: Europe Vitamin B Market Volume (Tons), by Country 2024 & 2032
- Figure 45: Europe Vitamin B Market Revenue Share (%), by Country 2024 & 2032
- Figure 46: Europe Vitamin B Market Volume Share (%), by Country 2024 & 2032
- Figure 47: Asia Pacific Vitamin B Market Revenue (Million), by Form 2024 & 2032
- Figure 48: Asia Pacific Vitamin B Market Volume (Tons), by Form 2024 & 2032
- Figure 49: Asia Pacific Vitamin B Market Revenue Share (%), by Form 2024 & 2032
- Figure 50: Asia Pacific Vitamin B Market Volume Share (%), by Form 2024 & 2032
- Figure 51: Asia Pacific Vitamin B Market Revenue (Million), by Application 2024 & 2032
- Figure 52: Asia Pacific Vitamin B Market Volume (Tons), by Application 2024 & 2032
- Figure 53: Asia Pacific Vitamin B Market Revenue Share (%), by Application 2024 & 2032
- Figure 54: Asia Pacific Vitamin B Market Volume Share (%), by Application 2024 & 2032
- Figure 55: Asia Pacific Vitamin B Market Revenue (Million), by Country 2024 & 2032
- Figure 56: Asia Pacific Vitamin B Market Volume (Tons), by Country 2024 & 2032
- Figure 57: Asia Pacific Vitamin B Market Revenue Share (%), by Country 2024 & 2032
- Figure 58: Asia Pacific Vitamin B Market Volume Share (%), by Country 2024 & 2032
- Figure 59: South America Vitamin B Market Revenue (Million), by Form 2024 & 2032
- Figure 60: South America Vitamin B Market Volume (Tons), by Form 2024 & 2032
- Figure 61: South America Vitamin B Market Revenue Share (%), by Form 2024 & 2032
- Figure 62: South America Vitamin B Market Volume Share (%), by Form 2024 & 2032
- Figure 63: South America Vitamin B Market Revenue (Million), by Application 2024 & 2032
- Figure 64: South America Vitamin B Market Volume (Tons), by Application 2024 & 2032
- Figure 65: South America Vitamin B Market Revenue Share (%), by Application 2024 & 2032
- Figure 66: South America Vitamin B Market Volume Share (%), by Application 2024 & 2032
- Figure 67: South America Vitamin B Market Revenue (Million), by Country 2024 & 2032
- Figure 68: South America Vitamin B Market Volume (Tons), by Country 2024 & 2032
- Figure 69: South America Vitamin B Market Revenue Share (%), by Country 2024 & 2032
- Figure 70: South America Vitamin B Market Volume Share (%), by Country 2024 & 2032
- Figure 71: Middle East and Africa Vitamin B Market Revenue (Million), by Form 2024 & 2032
- Figure 72: Middle East and Africa Vitamin B Market Volume (Tons), by Form 2024 & 2032
- Figure 73: Middle East and Africa Vitamin B Market Revenue Share (%), by Form 2024 & 2032
- Figure 74: Middle East and Africa Vitamin B Market Volume Share (%), by Form 2024 & 2032
- Figure 75: Middle East and Africa Vitamin B Market Revenue (Million), by Application 2024 & 2032
- Figure 76: Middle East and Africa Vitamin B Market Volume (Tons), by Application 2024 & 2032
- Figure 77: Middle East and Africa Vitamin B Market Revenue Share (%), by Application 2024 & 2032
- Figure 78: Middle East and Africa Vitamin B Market Volume Share (%), by Application 2024 & 2032
- Figure 79: Middle East and Africa Vitamin B Market Revenue (Million), by Country 2024 & 2032
- Figure 80: Middle East and Africa Vitamin B Market Volume (Tons), by Country 2024 & 2032
- Figure 81: Middle East and Africa Vitamin B Market Revenue Share (%), by Country 2024 & 2032
- Figure 82: Middle East and Africa Vitamin B Market Volume Share (%), by Country 2024 & 2032
List of Tables
- Table 1: Global Vitamin B Market Revenue Million Forecast, by Region 2019 & 2032
- Table 2: Global Vitamin B Market Volume Tons Forecast, by Region 2019 & 2032
- Table 3: Global Vitamin B Market Revenue Million Forecast, by Form 2019 & 2032
- Table 4: Global Vitamin B Market Volume Tons Forecast, by Form 2019 & 2032
- Table 5: Global Vitamin B Market Revenue Million Forecast, by Application 2019 & 2032
- Table 6: Global Vitamin B Market Volume Tons Forecast, by Application 2019 & 2032
- Table 7: Global Vitamin B Market Revenue Million Forecast, by Region 2019 & 2032
- Table 8: Global Vitamin B Market Volume Tons Forecast, by Region 2019 & 2032
- Table 9: Global Vitamin B Market Revenue Million Forecast, by Country 2019 & 2032
- Table 10: Global Vitamin B Market Volume Tons Forecast, by Country 2019 & 2032
- Table 11: United States Vitamin B Market Revenue (Million) Forecast, by Application 2019 & 2032
- Table 12: United States Vitamin B Market Volume (Tons) Forecast, by Application 2019 & 2032
- Table 13: Canada Vitamin B Market Revenue (Million) Forecast, by Application 2019 & 2032
- Table 14: Canada Vitamin B Market Volume (Tons) Forecast, by Application 2019 & 2032
- Table 15: Mexico Vitamin B Market Revenue (Million) Forecast, by Application 2019 & 2032
- Table 16: Mexico Vitamin B Market Volume (Tons) Forecast, by Application 2019 & 2032
- Table 17: Rest of North America Vitamin B Market Revenue (Million) Forecast, by Application 2019 & 2032
- Table 18: Rest of North America Vitamin B Market Volume (Tons) Forecast, by Application 2019 & 2032
- Table 19: Global Vitamin B Market Revenue Million Forecast, by Country 2019 & 2032
- Table 20: Global Vitamin B Market Volume Tons Forecast, by Country 2019 & 2032
- Table 21: Spain Vitamin B Market Revenue (Million) Forecast, by Application 2019 & 2032
- Table 22: Spain Vitamin B Market Volume (Tons) Forecast, by Application 2019 & 2032
- Table 23: United Kingdom Vitamin B Market Revenue (Million) Forecast, by Application 2019 & 2032
- Table 24: United Kingdom Vitamin B Market Volume (Tons) Forecast, by Application 2019 & 2032
- Table 25: Germany Vitamin B Market Revenue (Million) Forecast, by Application 2019 & 2032
- Table 26: Germany Vitamin B Market Volume (Tons) Forecast, by Application 2019 & 2032
- Table 27: France Vitamin B Market Revenue (Million) Forecast, by Application 2019 & 2032
- Table 28: France Vitamin B Market Volume (Tons) Forecast, by Application 2019 & 2032
- Table 29: Italy Vitamin B Market Revenue (Million) Forecast, by Application 2019 & 2032
- Table 30: Italy Vitamin B Market Volume (Tons) Forecast, by Application 2019 & 2032
- Table 31: Russia Vitamin B Market Revenue (Million) Forecast, by Application 2019 & 2032
- Table 32: Russia Vitamin B Market Volume (Tons) Forecast, by Application 2019 & 2032
- Table 33: Rest of Europe Vitamin B Market Revenue (Million) Forecast, by Application 2019 & 2032
- Table 34: Rest of Europe Vitamin B Market Volume (Tons) Forecast, by Application 2019 & 2032
- Table 35: Global Vitamin B Market Revenue Million Forecast, by Country 2019 & 2032
- Table 36: Global Vitamin B Market Volume Tons Forecast, by Country 2019 & 2032
- Table 37: China Vitamin B Market Revenue (Million) Forecast, by Application 2019 & 2032
- Table 38: China Vitamin B Market Volume (Tons) Forecast, by Application 2019 & 2032
- Table 39: Japan Vitamin B Market Revenue (Million) Forecast, by Application 2019 & 2032
- Table 40: Japan Vitamin B Market Volume (Tons) Forecast, by Application 2019 & 2032
- Table 41: India Vitamin B Market Revenue (Million) Forecast, by Application 2019 & 2032
- Table 42: India Vitamin B Market Volume (Tons) Forecast, by Application 2019 & 2032
- Table 43: Australia Vitamin B Market Revenue (Million) Forecast, by Application 2019 & 2032
- Table 44: Australia Vitamin B Market Volume (Tons) Forecast, by Application 2019 & 2032
- Table 45: Rest of Asia Pacific Vitamin B Market Revenue (Million) Forecast, by Application 2019 & 2032
- Table 46: Rest of Asia Pacific Vitamin B Market Volume (Tons) Forecast, by Application 2019 & 2032
- Table 47: Global Vitamin B Market Revenue Million Forecast, by Country 2019 & 2032
- Table 48: Global Vitamin B Market Volume Tons Forecast, by Country 2019 & 2032
- Table 49: Brazil Vitamin B Market Revenue (Million) Forecast, by Application 2019 & 2032
- Table 50: Brazil Vitamin B Market Volume (Tons) Forecast, by Application 2019 & 2032
- Table 51: Argentina Vitamin B Market Revenue (Million) Forecast, by Application 2019 & 2032
- Table 52: Argentina Vitamin B Market Volume (Tons) Forecast, by Application 2019 & 2032
- Table 53: Rest of South America Vitamin B Market Revenue (Million) Forecast, by Application 2019 & 2032
- Table 54: Rest of South America Vitamin B Market Volume (Tons) Forecast, by Application 2019 & 2032
- Table 55: Global Vitamin B Market Revenue Million Forecast, by Country 2019 & 2032
- Table 56: Global Vitamin B Market Volume Tons Forecast, by Country 2019 & 2032
- Table 57: South Africa Vitamin B Market Revenue (Million) Forecast, by Application 2019 & 2032
- Table 58: South Africa Vitamin B Market Volume (Tons) Forecast, by Application 2019 & 2032
- Table 59: Saudi Arabia Vitamin B Market Revenue (Million) Forecast, by Application 2019 & 2032
- Table 60: Saudi Arabia Vitamin B Market Volume (Tons) Forecast, by Application 2019 & 2032
- Table 61: Rest of Middle East and Africa Vitamin B Market Revenue (Million) Forecast, by Application 2019 & 2032
- Table 62: Rest of Middle East and Africa Vitamin B Market Volume (Tons) Forecast, by Application 2019 & 2032
- Table 63: Global Vitamin B Market Revenue Million Forecast, by Form 2019 & 2032
- Table 64: Global Vitamin B Market Volume Tons Forecast, by Form 2019 & 2032
- Table 65: Global Vitamin B Market Revenue Million Forecast, by Application 2019 & 2032
- Table 66: Global Vitamin B Market Volume Tons Forecast, by Application 2019 & 2032
- Table 67: Global Vitamin B Market Revenue Million Forecast, by Country 2019 & 2032
- Table 68: Global Vitamin B Market Volume Tons Forecast, by Country 2019 & 2032
- Table 69: United States Vitamin B Market Revenue (Million) Forecast, by Application 2019 & 2032
- Table 70: United States Vitamin B Market Volume (Tons) Forecast, by Application 2019 & 2032
- Table 71: Canada Vitamin B Market Revenue (Million) Forecast, by Application 2019 & 2032
- Table 72: Canada Vitamin B Market Volume (Tons) Forecast, by Application 2019 & 2032
- Table 73: Mexico Vitamin B Market Revenue (Million) Forecast, by Application 2019 & 2032
- Table 74: Mexico Vitamin B Market Volume (Tons) Forecast, by Application 2019 & 2032
- Table 75: Rest of North America Vitamin B Market Revenue (Million) Forecast, by Application 2019 & 2032
- Table 76: Rest of North America Vitamin B Market Volume (Tons) Forecast, by Application 2019 & 2032
- Table 77: Global Vitamin B Market Revenue Million Forecast, by Form 2019 & 2032
- Table 78: Global Vitamin B Market Volume Tons Forecast, by Form 2019 & 2032
- Table 79: Global Vitamin B Market Revenue Million Forecast, by Application 2019 & 2032
- Table 80: Global Vitamin B Market Volume Tons Forecast, by Application 2019 & 2032
- Table 81: Global Vitamin B Market Revenue Million Forecast, by Country 2019 & 2032
- Table 82: Global Vitamin B Market Volume Tons Forecast, by Country 2019 & 2032
- Table 83: Spain Vitamin B Market Revenue (Million) Forecast, by Application 2019 & 2032
- Table 84: Spain Vitamin B Market Volume (Tons) Forecast, by Application 2019 & 2032
- Table 85: United Kingdom Vitamin B Market Revenue (Million) Forecast, by Application 2019 & 2032
- Table 86: United Kingdom Vitamin B Market Volume (Tons) Forecast, by Application 2019 & 2032
- Table 87: Germany Vitamin B Market Revenue (Million) Forecast, by Application 2019 & 2032
- Table 88: Germany Vitamin B Market Volume (Tons) Forecast, by Application 2019 & 2032
- Table 89: France Vitamin B Market Revenue (Million) Forecast, by Application 2019 & 2032
- Table 90: France Vitamin B Market Volume (Tons) Forecast, by Application 2019 & 2032
- Table 91: Italy Vitamin B Market Revenue (Million) Forecast, by Application 2019 & 2032
- Table 92: Italy Vitamin B Market Volume (Tons) Forecast, by Application 2019 & 2032
- Table 93: Russia Vitamin B Market Revenue (Million) Forecast, by Application 2019 & 2032
- Table 94: Russia Vitamin B Market Volume (Tons) Forecast, by Application 2019 & 2032
- Table 95: Rest of Europe Vitamin B Market Revenue (Million) Forecast, by Application 2019 & 2032
- Table 96: Rest of Europe Vitamin B Market Volume (Tons) Forecast, by Application 2019 & 2032
- Table 97: Global Vitamin B Market Revenue Million Forecast, by Form 2019 & 2032
- Table 98: Global Vitamin B Market Volume Tons Forecast, by Form 2019 & 2032
- Table 99: Global Vitamin B Market Revenue Million Forecast, by Application 2019 & 2032
- Table 100: Global Vitamin B Market Volume Tons Forecast, by Application 2019 & 2032
- Table 101: Global Vitamin B Market Revenue Million Forecast, by Country 2019 & 2032
- Table 102: Global Vitamin B Market Volume Tons Forecast, by Country 2019 & 2032
- Table 103: China Vitamin B Market Revenue (Million) Forecast, by Application 2019 & 2032
- Table 104: China Vitamin B Market Volume (Tons) Forecast, by Application 2019 & 2032
- Table 105: Japan Vitamin B Market Revenue (Million) Forecast, by Application 2019 & 2032
- Table 106: Japan Vitamin B Market Volume (Tons) Forecast, by Application 2019 & 2032
- Table 107: India Vitamin B Market Revenue (Million) Forecast, by Application 2019 & 2032
- Table 108: India Vitamin B Market Volume (Tons) Forecast, by Application 2019 & 2032
- Table 109: Australia Vitamin B Market Revenue (Million) Forecast, by Application 2019 & 2032
- Table 110: Australia Vitamin B Market Volume (Tons) Forecast, by Application 2019 & 2032
- Table 111: Rest of Asia Pacific Vitamin B Market Revenue (Million) Forecast, by Application 2019 & 2032
- Table 112: Rest of Asia Pacific Vitamin B Market Volume (Tons) Forecast, by Application 2019 & 2032
- Table 113: Global Vitamin B Market Revenue Million Forecast, by Form 2019 & 2032
- Table 114: Global Vitamin B Market Volume Tons Forecast, by Form 2019 & 2032
- Table 115: Global Vitamin B Market Revenue Million Forecast, by Application 2019 & 2032
- Table 116: Global Vitamin B Market Volume Tons Forecast, by Application 2019 & 2032
- Table 117: Global Vitamin B Market Revenue Million Forecast, by Country 2019 & 2032
- Table 118: Global Vitamin B Market Volume Tons Forecast, by Country 2019 & 2032
- Table 119: Brazil Vitamin B Market Revenue (Million) Forecast, by Application 2019 & 2032
- Table 120: Brazil Vitamin B Market Volume (Tons) Forecast, by Application 2019 & 2032
- Table 121: Argentina Vitamin B Market Revenue (Million) Forecast, by Application 2019 & 2032
- Table 122: Argentina Vitamin B Market Volume (Tons) Forecast, by Application 2019 & 2032
- Table 123: Rest of South America Vitamin B Market Revenue (Million) Forecast, by Application 2019 & 2032
- Table 124: Rest of South America Vitamin B Market Volume (Tons) Forecast, by Application 2019 & 2032
- Table 125: Global Vitamin B Market Revenue Million Forecast, by Form 2019 & 2032
- Table 126: Global Vitamin B Market Volume Tons Forecast, by Form 2019 & 2032
- Table 127: Global Vitamin B Market Revenue Million Forecast, by Application 2019 & 2032
- Table 128: Global Vitamin B Market Volume Tons Forecast, by Application 2019 & 2032
- Table 129: Global Vitamin B Market Revenue Million Forecast, by Country 2019 & 2032
- Table 130: Global Vitamin B Market Volume Tons Forecast, by Country 2019 & 2032
- Table 131: South Africa Vitamin B Market Revenue (Million) Forecast, by Application 2019 & 2032
- Table 132: South Africa Vitamin B Market Volume (Tons) Forecast, by Application 2019 & 2032
- Table 133: Saudi Arabia Vitamin B Market Revenue (Million) Forecast, by Application 2019 & 2032
- Table 134: Saudi Arabia Vitamin B Market Volume (Tons) Forecast, by Application 2019 & 2032
- Table 135: Rest of Middle East and Africa Vitamin B Market Revenue (Million) Forecast, by Application 2019 & 2032
- Table 136: Rest of Middle East and Africa Vitamin B Market Volume (Tons) Forecast, by Application 2019 & 2032
Frequently Asked Questions
1. What is the projected Compound Annual Growth Rate (CAGR) of the Vitamin B Market?
The projected CAGR is approximately 6.65%.
2. Which companies are prominent players in the Vitamin B Market?
Key companies in the market include Hebei Shengxue dacheng Pharmaceutical Co Ltd*List Not Exhaustive, Xinfa Pharmaceutical Co Ltd, Legend Industries, Hubei Guangji Pharmaceutical Co Ltd, N B Group Co Ltd, BASF SE, Shanghai Acebright Pharmaceuticals Group Co Ltd, Parchem Fine & Specialty Chemicals, Shanghai Hegno Pharmaceutical Holding Co Ltd, Koninklijke DSM NV.
3. What are the main segments of the Vitamin B Market?
The market segments include Form, Application.
4. Can you provide details about the market size?
The market size is estimated to be USD 451.57 Million as of 2022.
5. What are some drivers contributing to market growth?
Increasing Demand for Functional and Fortified Food; Multi-functionality and Wide Application of Riboflavin.
6. What are the notable trends driving market growth?
Increasing Demand for Functional and Fortified Food.
7. Are there any restraints impacting market growth?
Low Stability of Riboflavin on Exposure to Light and Heat.
8. Can you provide examples of recent developments in the market?
May 2023: DSM-Firmenich AG, the global innovation partner in nutrition, health, and beauty, completed its merger with Firmenich International SA.
9. What pricing options are available for accessing the report?
Pricing options include single-user, multi-user, and enterprise licenses priced at USD 4750, USD 5250, and USD 8750 respectively.
10. Is the market size provided in terms of value or volume?
The market size is provided in terms of value, measured in Million and volume, measured in Tons.
11. Are there any specific market keywords associated with the report?
Yes, the market keyword associated with the report is "Vitamin B Market," which aids in identifying and referencing the specific market segment covered.
12. How do I determine which pricing option suits my needs best?
The pricing options vary based on user requirements and access needs. Individual users may opt for single-user licenses, while businesses requiring broader access may choose multi-user or enterprise licenses for cost-effective access to the report.
13. Are there any additional resources or data provided in the Vitamin B Market report?
While the report offers comprehensive insights, it's advisable to review the specific contents or supplementary materials provided to ascertain if additional resources or data are available.
14. How can I stay updated on further developments or reports in the Vitamin B Market?
To stay informed about further developments, trends, and reports in the Vitamin B Market, consider subscribing to industry newsletters, following relevant companies and organizations, or regularly checking reputable industry news sources and publications.
Methodology
Step 1 - Identification of Relevant Samples Size from Population Database


Step 2 - Approaches for Defining Global Market Size (Value, Volume* & Price*)

Note*: In applicable scenarios
Step 3 - Data Sources
Primary Research
- Web Analytics
- Survey Reports
- Research Institute
- Latest Research Reports
- Opinion Leaders
Secondary Research
- Annual Reports
- White Paper
- Latest Press Release
- Industry Association
- Paid Database
- Investor Presentations

Step 4 - Data Triangulation
Involves using different sources of information in order to increase the validity of a study
These sources are likely to be stakeholders in a program - participants, other researchers, program staff, other community members, and so on.
Then we put all data in single framework & apply various statistical tools to find out the dynamic on the market.
During the analysis stage, feedback from the stakeholder groups would be compared to determine areas of agreement as well as areas of divergence
