

Key Insights
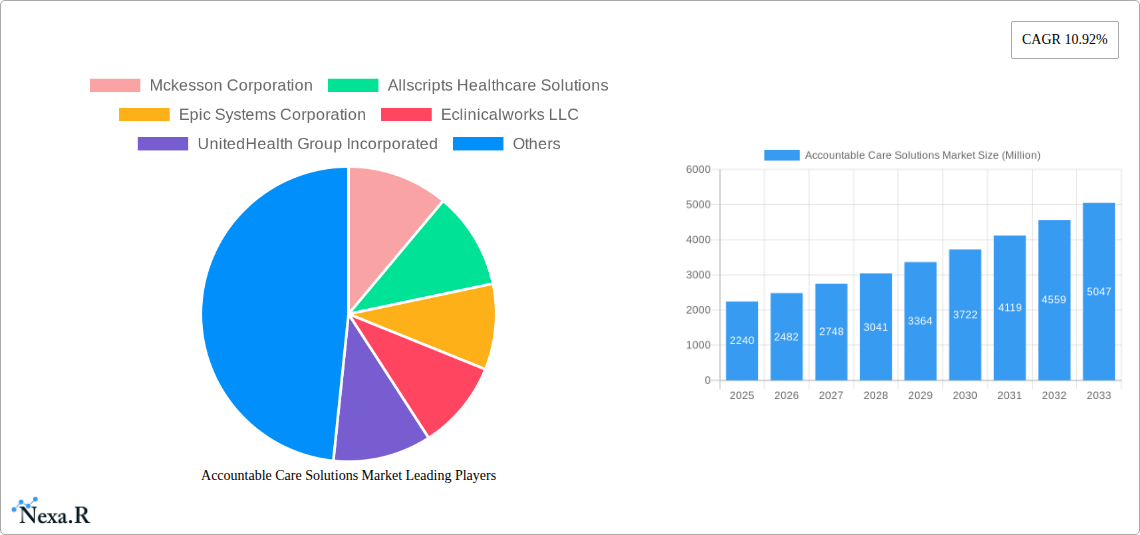
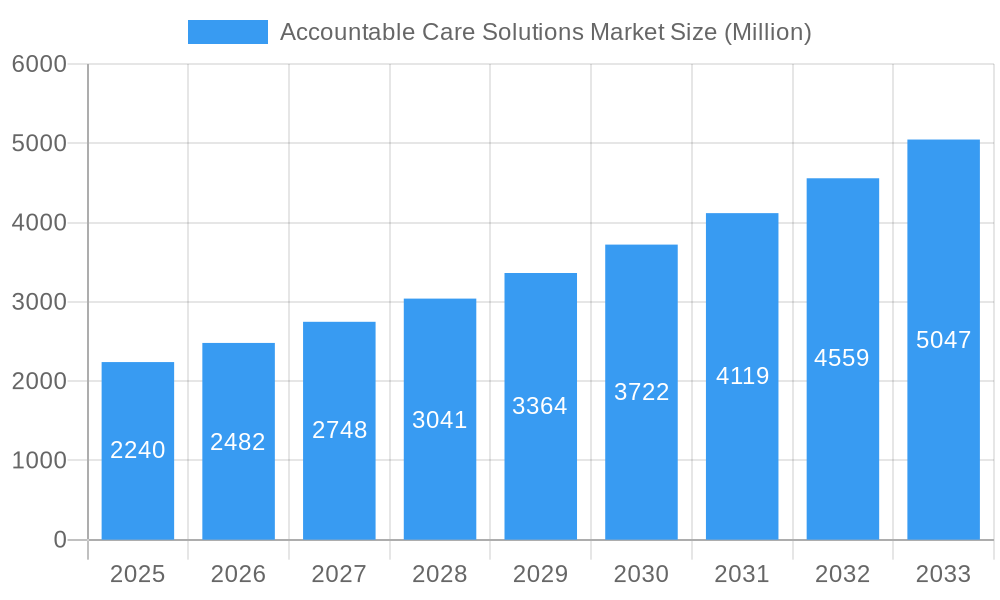
The Accountable Care Solutions (ACS) market, valued at $2.24 billion in 2025, is experiencing robust growth, projected to expand at a Compound Annual Growth Rate (CAGR) of 10.92% from 2025 to 2033. This expansion is driven by several key factors. The increasing prevalence of chronic diseases necessitates efficient and coordinated care, making ACS solutions crucial for managing healthcare costs and improving patient outcomes. Government initiatives promoting value-based care models, coupled with the rising adoption of electronic health records (EHRs) and advanced analytics, further fuel market growth. Furthermore, the shift towards cloud-based deployments offers scalability and accessibility, enhancing the appeal of ACS solutions among healthcare providers and payers. The market is segmented by product and services (including Electronic Health Records, Healthcare Analytics, Revenue Cycle Management, and Claims & Payment Management), deployment (on-premise, web & cloud-based), and end-user (healthcare providers and payers). Competition is fierce, with major players like McKesson, Allscripts, Epic Systems, and Cerner vying for market share through continuous innovation and strategic partnerships.
Accountable Care Solutions Market Market Size (In Billion)
North America currently dominates the ACS market, driven by advanced healthcare infrastructure and early adoption of innovative technologies. However, significant growth opportunities exist in the Asia-Pacific region, fueled by increasing healthcare expenditure and the rising adoption of digital health solutions. Europe is also experiencing steady growth, though regulatory landscapes may pose some challenges. While the market faces restraints like data security concerns and the complexities of integrating diverse healthcare systems, the long-term outlook remains positive. The increasing focus on population health management and the need for improved interoperability are likely to drive continued market expansion throughout the forecast period. The market's success hinges on the ability of vendors to deliver solutions that seamlessly integrate existing systems, improve data analytics capabilities, and enhance care coordination across the healthcare continuum.
Accountable Care Solutions Market Company Market Share
Accountable Care Solutions Market: A Comprehensive Report (2019-2033)
This comprehensive report provides an in-depth analysis of the Accountable Care Solutions market, encompassing its dynamics, growth trends, key players, and future outlook. With a focus on the parent market of Healthcare IT and the child market of Population Health Management, this study offers invaluable insights for industry professionals, investors, and strategic decision-makers. The report covers the period 2019-2033, with 2025 as the base year and a forecast period of 2025-2033. The market size is presented in millions of units.
Accountable Care Solutions Market Dynamics & Structure
The Accountable Care Solutions market is characterized by a moderately consolidated structure, with key players like McKesson Corporation, Allscripts Healthcare Solutions, and Epic Systems Corporation holding significant market share. The market's dynamics are shaped by several factors, including rapid technological advancements in areas such as AI-driven analytics and cloud-based solutions, evolving regulatory frameworks promoting value-based care, and increasing competition from alternative solutions. Mergers and acquisitions (M&A) activity remains a significant driver of market consolidation, with an estimated xx M&A deals in the historical period (2019-2024).
- Market Concentration: Highly concentrated with top 5 players holding approximately xx% market share in 2024.
- Technological Innovation: AI, machine learning, and cloud computing are driving efficiency and data-driven insights. However, integration challenges and data security concerns present barriers.
- Regulatory Landscape: Government regulations and initiatives promoting value-based care are major drivers, although navigating compliance can be complex.
- Competitive Substitutes: Traditional fee-for-service models pose competition, along with emerging telehealth platforms.
- End-User Demographics: The market is driven by the increasing adoption of value-based care models by healthcare providers and payers.
- M&A Trends: Strategic acquisitions are consolidating market power and expanding product portfolios, increasing at a CAGR of xx% from 2019 to 2024.
Accountable Care Solutions Market Growth Trends & Insights
The Accountable Care Solutions market is experiencing robust growth, driven by the global shift towards value-based care models and the increasing adoption of advanced technologies. The market size is projected to reach xx million units by 2025, growing at a CAGR of xx% during the forecast period (2025-2033). This growth is fueled by factors such as rising healthcare costs, increasing chronic disease prevalence, and the growing need for improved healthcare outcomes. Technological disruptions, such as the adoption of AI-powered analytics and cloud-based solutions, are further accelerating market expansion. Shifts in consumer behavior, with patients increasingly demanding personalized and cost-effective care, also contribute significantly. The market penetration is expected to reach xx% by 2033.
Dominant Regions, Countries, or Segments in Accountable Care Solutions Market
North America currently dominates the Accountable Care Solutions market, driven by early adoption of value-based care, robust healthcare IT infrastructure, and significant investments in healthcare technology. Within the segments, Electronic Health/Medical Records (EHRs) and Healthcare Analytics hold the largest market share. Revenue Cycle Management (RCM) solutions are also experiencing significant growth due to increasing pressures on healthcare providers to improve financial efficiency. The Web & Cloud-Based deployment model is gaining traction due to its scalability and cost-effectiveness. Healthcare providers represent the largest end-user segment.
- Key Drivers:
- High adoption of EHRs and advanced analytics among healthcare providers.
- Favorable regulatory environment and government incentives promoting value-based care.
- Well-established healthcare IT infrastructure in North America.
- Increasing investment in population health management initiatives.
- Dominance Factors:
- High market penetration of EHRs and RCM solutions.
- Strong growth potential in areas like predictive analytics and remote patient monitoring.
- Established presence of major technology vendors.
Accountable Care Solutions Market Product Landscape
The Accountable Care Solutions market offers a diverse range of products and services, including EHRs, healthcare analytics platforms, revenue cycle management (RCM) solutions, claims management, and payment management. Recent innovations focus on improving interoperability, enhancing data analytics capabilities, and streamlining workflows. These advancements offer unique selling propositions such as improved care coordination, reduced administrative burdens, and enhanced patient engagement. The key focus is on developing user-friendly interfaces, integrating AI and machine learning for improved decision-making, and ensuring robust data security.
Key Drivers, Barriers & Challenges in Accountable Care Solutions Market
Key Drivers:
The market is primarily driven by the increasing adoption of value-based care models, technological advancements such as AI and machine learning, and government regulations promoting interoperability and data exchange. The growing demand for improved care coordination, reduced healthcare costs, and enhanced patient outcomes further propels market growth. Examples include the implementation of Medicare's ACO programs and the increasing use of telehealth.
Key Challenges and Restraints:
Key challenges include the high cost of implementation and maintenance of ACO solutions, interoperability issues between different systems, and data security concerns. The complexity of implementing new technologies and the resistance to change among healthcare providers also pose obstacles. Supply chain disruptions and regulatory hurdles further add to the challenges. These factors result in an estimated xx% reduction in market growth annually.
Emerging Opportunities in Accountable Care Solutions Market
Emerging opportunities lie in areas such as personalized medicine, predictive analytics, remote patient monitoring, and the integration of wearables and IoT devices. Untapped markets in developing countries with growing healthcare systems present significant potential. The increasing demand for telehealth solutions, driven by the COVID-19 pandemic, creates further opportunities. Evolving consumer preferences for personalized and proactive care, coupled with the need for more efficient and cost-effective healthcare delivery, are driving innovation and opening new avenues for market growth.
Growth Accelerators in the Accountable Care Solutions Market Industry
Technological breakthroughs in areas such as AI, machine learning, and cloud computing are key accelerators. Strategic partnerships between technology providers and healthcare organizations facilitate wider adoption and integration of solutions. Government policies and initiatives promoting value-based care and interoperability further propel market growth. Expansion into new geographical markets, particularly in developing economies with growing healthcare needs, offers significant potential for long-term growth.
Key Players Shaping the Accountable Care Solutions Market Market
Notable Milestones in Accountable Care Solutions Market Sector
- March 2022: Collaborative Health Systems and Community Care Alliance enter into a joint venture to expand accountable care services.
- March 2022: CMS introduces the REACH accountable care model, replacing the GPDC model.
In-Depth Accountable Care Solutions Market Market Outlook
The Accountable Care Solutions market is poised for continued robust growth, driven by technological advancements, favorable regulatory environments, and the ongoing shift towards value-based care. Strategic partnerships, expansion into new markets, and the development of innovative solutions will further fuel market expansion. The focus on improving interoperability, enhancing data analytics capabilities, and personalizing care will create significant opportunities for key players in the coming years. The market is expected to reach xx million units by 2033, representing substantial growth potential for businesses operating in this dynamic sector.
Accountable Care Solutions Market Segmentation
-
1. Product & Services
- 1.1. Electronic Health/Medical Records
- 1.2. Healthcare Analytics
- 1.3. Revenue Cycle Management Solutions (RCM)
- 1.4. Claims Management Solutions
- 1.5. Payment Management Solutions
- 1.6. Support and Maintenance Services
- 1.7. Other Products & Services
-
2. Deployment
- 2.1. On-premise
- 2.2. Web & Cloud-Based
-
3. End User
- 3.1. Healthcare Providers
- 3.2. Healthcare Payers
Accountable Care Solutions Market Segmentation By Geography
-
1. North America
- 1.1. United States
- 1.2. Canada
- 1.3. Mexico
-
2. Europe
- 2.1. Germany
- 2.2. United Kingdom
- 2.3. France
- 2.4. Italy
- 2.5. Spain
- 2.6. Rest of Europe
-
3. Asia Pacific
- 3.1. China
- 3.2. Japan
- 3.3. India
- 3.4. Australia
- 3.5. South Korea
- 3.6. Rest of Asia Pacific
-
4. Middle East and Africa
- 4.1. GCC
- 4.2. South Africa
- 4.3. Rest of Middle East and Africa
-
5. South America
- 5.1. Brazil
- 5.2. Argentina
- 5.3. Rest of South America
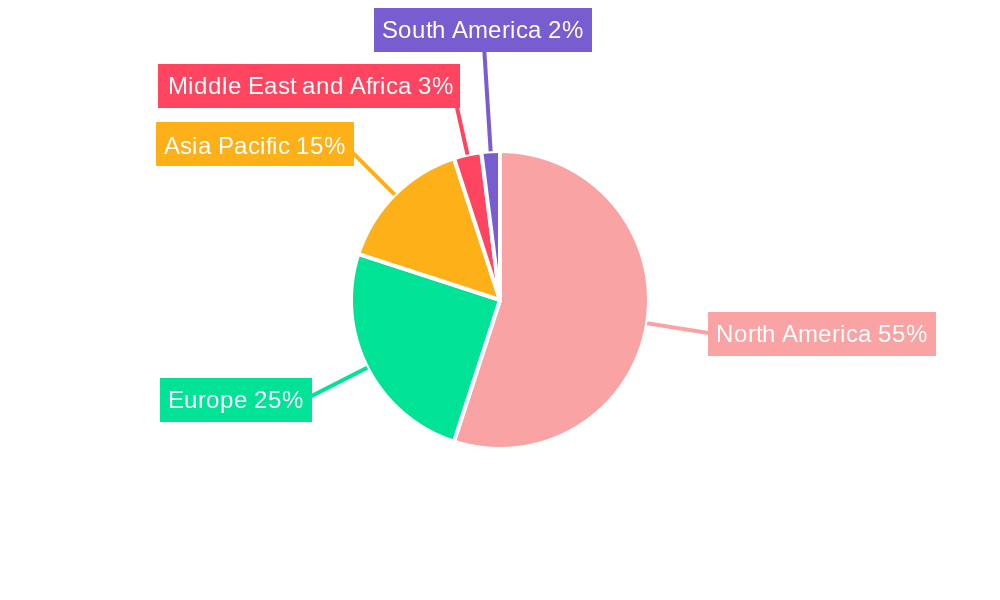
Accountable Care Solutions Market Regional Market Share
Geographic Coverage of Accountable Care Solutions Market
Accountable Care Solutions Market REPORT HIGHLIGHTS
| Aspects | Details |
|---|---|
| Study Period | 2020-2034 |
| Base Year | 2025 |
| Estimated Year | 2026 |
| Forecast Period | 2026-2034 |
| Historical Period | 2020-2025 |
| Growth Rate | CAGR of 10.92% from 2020-2034 |
| Segmentation |
|
Table of Contents
- 1. Introduction
- 1.1. Research Scope
- 1.2. Market Segmentation
- 1.3. Research Objective
- 1.4. Definitions and Assumptions
- 2. Executive Summary
- 2.1. Market Snapshot
- 3. Market Dynamics
- 3.1. Market Drivers
- 3.2. Market Restrains
- 3.3. Market Trends
- 3.4. Market Opportunities
- 4. Market Factor Analysis
- 4.1. Porters Five Forces
- 4.1.1. Bargaining Power of Suppliers
- 4.1.2. Bargaining Power of Buyers
- 4.1.3. Threat of New Entrants
- 4.1.4. Threat of Substitutes
- 4.1.5. Competitive Rivalry
- 4.2. PESTEL analysis
- 4.3. BCG Analysis
- 4.3.1. Stars (High Growth, High Market Share)
- 4.3.2. Cash Cows (Low Growth, High Market Share)
- 4.3.3. Question Mark (High Growth, Low Market Share)
- 4.3.4. Dogs (Low Growth, Low Market Share)
- 4.4. Ansoff Matrix Analysis
- 4.5. Supply Chain Analysis
- 4.6. Regulatory Landscape
- 4.7. Current Market Potential and Opportunity Assessment (TAM–SAM–SOM Framework)
- 4.8. NRP Analyst Note
- 4.1. Porters Five Forces
- 5. Market Analysis, Insights and Forecast 2021-2033
- 5.1. Market Analysis, Insights and Forecast - by Product & Services
- 5.1.1. Electronic Health/Medical Records
- 5.1.2. Healthcare Analytics
- 5.1.3. Revenue Cycle Management Solutions (RCM)
- 5.1.4. Claims Management Solutions
- 5.1.5. Payment Management Solutions
- 5.1.6. Support and Maintenance Services
- 5.1.7. Other Products & Services
- 5.2. Market Analysis, Insights and Forecast - by Deployment
- 5.2.1. On-premise
- 5.2.2. Web & Cloud-Based
- 5.3. Market Analysis, Insights and Forecast - by End User
- 5.3.1. Healthcare Providers
- 5.3.2. Healthcare Payers
- 5.4. Market Analysis, Insights and Forecast - by Region
- 5.4.1. North America
- 5.4.2. Europe
- 5.4.3. Asia Pacific
- 5.4.4. Middle East and Africa
- 5.4.5. South America
- 5.1. Market Analysis, Insights and Forecast - by Product & Services
- 6. Global Accountable Care Solutions Market Analysis, Insights and Forecast, 2021-2033
- 6.1. Market Analysis, Insights and Forecast - by Product & Services
- 6.1.1. Electronic Health/Medical Records
- 6.1.2. Healthcare Analytics
- 6.1.3. Revenue Cycle Management Solutions (RCM)
- 6.1.4. Claims Management Solutions
- 6.1.5. Payment Management Solutions
- 6.1.6. Support and Maintenance Services
- 6.1.7. Other Products & Services
- 6.2. Market Analysis, Insights and Forecast - by Deployment
- 6.2.1. On-premise
- 6.2.2. Web & Cloud-Based
- 6.3. Market Analysis, Insights and Forecast - by End User
- 6.3.1. Healthcare Providers
- 6.3.2. Healthcare Payers
- 6.1. Market Analysis, Insights and Forecast - by Product & Services
- 7. North America Accountable Care Solutions Market Analysis, Insights and Forecast, 2020-2032
- 7.1. Market Analysis, Insights and Forecast - by Product & Services
- 7.1.1. Electronic Health/Medical Records
- 7.1.2. Healthcare Analytics
- 7.1.3. Revenue Cycle Management Solutions (RCM)
- 7.1.4. Claims Management Solutions
- 7.1.5. Payment Management Solutions
- 7.1.6. Support and Maintenance Services
- 7.1.7. Other Products & Services
- 7.2. Market Analysis, Insights and Forecast - by Deployment
- 7.2.1. On-premise
- 7.2.2. Web & Cloud-Based
- 7.3. Market Analysis, Insights and Forecast - by End User
- 7.3.1. Healthcare Providers
- 7.3.2. Healthcare Payers
- 7.1. Market Analysis, Insights and Forecast - by Product & Services
- 8. Europe Accountable Care Solutions Market Analysis, Insights and Forecast, 2020-2032
- 8.1. Market Analysis, Insights and Forecast - by Product & Services
- 8.1.1. Electronic Health/Medical Records
- 8.1.2. Healthcare Analytics
- 8.1.3. Revenue Cycle Management Solutions (RCM)
- 8.1.4. Claims Management Solutions
- 8.1.5. Payment Management Solutions
- 8.1.6. Support and Maintenance Services
- 8.1.7. Other Products & Services
- 8.2. Market Analysis, Insights and Forecast - by Deployment
- 8.2.1. On-premise
- 8.2.2. Web & Cloud-Based
- 8.3. Market Analysis, Insights and Forecast - by End User
- 8.3.1. Healthcare Providers
- 8.3.2. Healthcare Payers
- 8.1. Market Analysis, Insights and Forecast - by Product & Services
- 9. Asia Pacific Accountable Care Solutions Market Analysis, Insights and Forecast, 2020-2032
- 9.1. Market Analysis, Insights and Forecast - by Product & Services
- 9.1.1. Electronic Health/Medical Records
- 9.1.2. Healthcare Analytics
- 9.1.3. Revenue Cycle Management Solutions (RCM)
- 9.1.4. Claims Management Solutions
- 9.1.5. Payment Management Solutions
- 9.1.6. Support and Maintenance Services
- 9.1.7. Other Products & Services
- 9.2. Market Analysis, Insights and Forecast - by Deployment
- 9.2.1. On-premise
- 9.2.2. Web & Cloud-Based
- 9.3. Market Analysis, Insights and Forecast - by End User
- 9.3.1. Healthcare Providers
- 9.3.2. Healthcare Payers
- 9.1. Market Analysis, Insights and Forecast - by Product & Services
- 10. Middle East and Africa Accountable Care Solutions Market Analysis, Insights and Forecast, 2020-2032
- 10.1. Market Analysis, Insights and Forecast - by Product & Services
- 10.1.1. Electronic Health/Medical Records
- 10.1.2. Healthcare Analytics
- 10.1.3. Revenue Cycle Management Solutions (RCM)
- 10.1.4. Claims Management Solutions
- 10.1.5. Payment Management Solutions
- 10.1.6. Support and Maintenance Services
- 10.1.7. Other Products & Services
- 10.2. Market Analysis, Insights and Forecast - by Deployment
- 10.2.1. On-premise
- 10.2.2. Web & Cloud-Based
- 10.3. Market Analysis, Insights and Forecast - by End User
- 10.3.1. Healthcare Providers
- 10.3.2. Healthcare Payers
- 10.1. Market Analysis, Insights and Forecast - by Product & Services
- 11. South America Accountable Care Solutions Market Analysis, Insights and Forecast, 2020-2032
- 11.1. Market Analysis, Insights and Forecast - by Product & Services
- 11.1.1. Electronic Health/Medical Records
- 11.1.2. Healthcare Analytics
- 11.1.3. Revenue Cycle Management Solutions (RCM)
- 11.1.4. Claims Management Solutions
- 11.1.5. Payment Management Solutions
- 11.1.6. Support and Maintenance Services
- 11.1.7. Other Products & Services
- 11.2. Market Analysis, Insights and Forecast - by Deployment
- 11.2.1. On-premise
- 11.2.2. Web & Cloud-Based
- 11.3. Market Analysis, Insights and Forecast - by End User
- 11.3.1. Healthcare Providers
- 11.3.2. Healthcare Payers
- 11.1. Market Analysis, Insights and Forecast - by Product & Services
- 12. Competitive Analysis
- 12.1. Company Profiles
- 12.1.1 Mckesson Corporation
- 12.1.1.1. Company Overview
- 12.1.1.2. Products
- 12.1.1.3. Company Financials
- 12.1.1.4. SWOT Analysis
- 12.1.2 Allscripts Healthcare Solutions
- 12.1.2.1. Company Overview
- 12.1.2.2. Products
- 12.1.2.3. Company Financials
- 12.1.2.4. SWOT Analysis
- 12.1.3 Epic Systems Corporation
- 12.1.3.1. Company Overview
- 12.1.3.2. Products
- 12.1.3.3. Company Financials
- 12.1.3.4. SWOT Analysis
- 12.1.4 Eclinicalworks LLC
- 12.1.4.1. Company Overview
- 12.1.4.2. Products
- 12.1.4.3. Company Financials
- 12.1.4.4. SWOT Analysis
- 12.1.5 UnitedHealth Group Incorporated
- 12.1.5.1. Company Overview
- 12.1.5.2. Products
- 12.1.5.3. Company Financials
- 12.1.5.4. SWOT Analysis
- 12.1.6 Verisk Analytics Inc
- 12.1.6.1. Company Overview
- 12.1.6.2. Products
- 12.1.6.3. Company Financials
- 12.1.6.4. SWOT Analysis
- 12.1.7 Constellation Software
- 12.1.7.1. Company Overview
- 12.1.7.2. Products
- 12.1.7.3. Company Financials
- 12.1.7.4. SWOT Analysis
- 12.1.8 IBM Healthcare
- 12.1.8.1. Company Overview
- 12.1.8.2. Products
- 12.1.8.3. Company Financials
- 12.1.8.4. SWOT Analysis
- 12.1.9 Cerner Corporation
- 12.1.9.1. Company Overview
- 12.1.9.2. Products
- 12.1.9.3. Company Financials
- 12.1.9.4. SWOT Analysis
- 12.1.10 ZeOmega Inc
- 12.1.10.1. Company Overview
- 12.1.10.2. Products
- 12.1.10.3. Company Financials
- 12.1.10.4. SWOT Analysis
- 12.1.11 Aetna Inc
- 12.1.11.1. Company Overview
- 12.1.11.2. Products
- 12.1.11.3. Company Financials
- 12.1.11.4. SWOT Analysis
- 12.1.12 Athenahealth Inc
- 12.1.12.1. Company Overview
- 12.1.12.2. Products
- 12.1.12.3. Company Financials
- 12.1.12.4. SWOT Analysis
- 12.1.1 Mckesson Corporation
- 12.2. Market Entropy
- 12.2.1 Company's Key Areas Served
- 12.2.2 Recent Developments
- 12.3. Company Market Share Analysis 2025
- 12.3.1 Top 5 Companies Market Share Analysis
- 12.3.2 Top 3 Companies Market Share Analysis
- 12.4. List of Potential Customers
- 13. Research Methodology
List of Figures
- Figure 1: Global Accountable Care Solutions Market Revenue Breakdown (Million, %) by Region 2025 & 2033
- Figure 2: Global Accountable Care Solutions Market Volume Breakdown (K Unit, %) by Region 2025 & 2033
- Figure 3: North America Accountable Care Solutions Market Revenue (Million), by Product & Services 2025 & 2033
- Figure 4: North America Accountable Care Solutions Market Volume (K Unit), by Product & Services 2025 & 2033
- Figure 5: North America Accountable Care Solutions Market Revenue Share (%), by Product & Services 2025 & 2033
- Figure 6: North America Accountable Care Solutions Market Volume Share (%), by Product & Services 2025 & 2033
- Figure 7: North America Accountable Care Solutions Market Revenue (Million), by Deployment 2025 & 2033
- Figure 8: North America Accountable Care Solutions Market Volume (K Unit), by Deployment 2025 & 2033
- Figure 9: North America Accountable Care Solutions Market Revenue Share (%), by Deployment 2025 & 2033
- Figure 10: North America Accountable Care Solutions Market Volume Share (%), by Deployment 2025 & 2033
- Figure 11: North America Accountable Care Solutions Market Revenue (Million), by End User 2025 & 2033
- Figure 12: North America Accountable Care Solutions Market Volume (K Unit), by End User 2025 & 2033
- Figure 13: North America Accountable Care Solutions Market Revenue Share (%), by End User 2025 & 2033
- Figure 14: North America Accountable Care Solutions Market Volume Share (%), by End User 2025 & 2033
- Figure 15: North America Accountable Care Solutions Market Revenue (Million), by Country 2025 & 2033
- Figure 16: North America Accountable Care Solutions Market Volume (K Unit), by Country 2025 & 2033
- Figure 17: North America Accountable Care Solutions Market Revenue Share (%), by Country 2025 & 2033
- Figure 18: North America Accountable Care Solutions Market Volume Share (%), by Country 2025 & 2033
- Figure 19: Europe Accountable Care Solutions Market Revenue (Million), by Product & Services 2025 & 2033
- Figure 20: Europe Accountable Care Solutions Market Volume (K Unit), by Product & Services 2025 & 2033
- Figure 21: Europe Accountable Care Solutions Market Revenue Share (%), by Product & Services 2025 & 2033
- Figure 22: Europe Accountable Care Solutions Market Volume Share (%), by Product & Services 2025 & 2033
- Figure 23: Europe Accountable Care Solutions Market Revenue (Million), by Deployment 2025 & 2033
- Figure 24: Europe Accountable Care Solutions Market Volume (K Unit), by Deployment 2025 & 2033
- Figure 25: Europe Accountable Care Solutions Market Revenue Share (%), by Deployment 2025 & 2033
- Figure 26: Europe Accountable Care Solutions Market Volume Share (%), by Deployment 2025 & 2033
- Figure 27: Europe Accountable Care Solutions Market Revenue (Million), by End User 2025 & 2033
- Figure 28: Europe Accountable Care Solutions Market Volume (K Unit), by End User 2025 & 2033
- Figure 29: Europe Accountable Care Solutions Market Revenue Share (%), by End User 2025 & 2033
- Figure 30: Europe Accountable Care Solutions Market Volume Share (%), by End User 2025 & 2033
- Figure 31: Europe Accountable Care Solutions Market Revenue (Million), by Country 2025 & 2033
- Figure 32: Europe Accountable Care Solutions Market Volume (K Unit), by Country 2025 & 2033
- Figure 33: Europe Accountable Care Solutions Market Revenue Share (%), by Country 2025 & 2033
- Figure 34: Europe Accountable Care Solutions Market Volume Share (%), by Country 2025 & 2033
- Figure 35: Asia Pacific Accountable Care Solutions Market Revenue (Million), by Product & Services 2025 & 2033
- Figure 36: Asia Pacific Accountable Care Solutions Market Volume (K Unit), by Product & Services 2025 & 2033
- Figure 37: Asia Pacific Accountable Care Solutions Market Revenue Share (%), by Product & Services 2025 & 2033
- Figure 38: Asia Pacific Accountable Care Solutions Market Volume Share (%), by Product & Services 2025 & 2033
- Figure 39: Asia Pacific Accountable Care Solutions Market Revenue (Million), by Deployment 2025 & 2033
- Figure 40: Asia Pacific Accountable Care Solutions Market Volume (K Unit), by Deployment 2025 & 2033
- Figure 41: Asia Pacific Accountable Care Solutions Market Revenue Share (%), by Deployment 2025 & 2033
- Figure 42: Asia Pacific Accountable Care Solutions Market Volume Share (%), by Deployment 2025 & 2033
- Figure 43: Asia Pacific Accountable Care Solutions Market Revenue (Million), by End User 2025 & 2033
- Figure 44: Asia Pacific Accountable Care Solutions Market Volume (K Unit), by End User 2025 & 2033
- Figure 45: Asia Pacific Accountable Care Solutions Market Revenue Share (%), by End User 2025 & 2033
- Figure 46: Asia Pacific Accountable Care Solutions Market Volume Share (%), by End User 2025 & 2033
- Figure 47: Asia Pacific Accountable Care Solutions Market Revenue (Million), by Country 2025 & 2033
- Figure 48: Asia Pacific Accountable Care Solutions Market Volume (K Unit), by Country 2025 & 2033
- Figure 49: Asia Pacific Accountable Care Solutions Market Revenue Share (%), by Country 2025 & 2033
- Figure 50: Asia Pacific Accountable Care Solutions Market Volume Share (%), by Country 2025 & 2033
- Figure 51: Middle East and Africa Accountable Care Solutions Market Revenue (Million), by Product & Services 2025 & 2033
- Figure 52: Middle East and Africa Accountable Care Solutions Market Volume (K Unit), by Product & Services 2025 & 2033
- Figure 53: Middle East and Africa Accountable Care Solutions Market Revenue Share (%), by Product & Services 2025 & 2033
- Figure 54: Middle East and Africa Accountable Care Solutions Market Volume Share (%), by Product & Services 2025 & 2033
- Figure 55: Middle East and Africa Accountable Care Solutions Market Revenue (Million), by Deployment 2025 & 2033
- Figure 56: Middle East and Africa Accountable Care Solutions Market Volume (K Unit), by Deployment 2025 & 2033
- Figure 57: Middle East and Africa Accountable Care Solutions Market Revenue Share (%), by Deployment 2025 & 2033
- Figure 58: Middle East and Africa Accountable Care Solutions Market Volume Share (%), by Deployment 2025 & 2033
- Figure 59: Middle East and Africa Accountable Care Solutions Market Revenue (Million), by End User 2025 & 2033
- Figure 60: Middle East and Africa Accountable Care Solutions Market Volume (K Unit), by End User 2025 & 2033
- Figure 61: Middle East and Africa Accountable Care Solutions Market Revenue Share (%), by End User 2025 & 2033
- Figure 62: Middle East and Africa Accountable Care Solutions Market Volume Share (%), by End User 2025 & 2033
- Figure 63: Middle East and Africa Accountable Care Solutions Market Revenue (Million), by Country 2025 & 2033
- Figure 64: Middle East and Africa Accountable Care Solutions Market Volume (K Unit), by Country 2025 & 2033
- Figure 65: Middle East and Africa Accountable Care Solutions Market Revenue Share (%), by Country 2025 & 2033
- Figure 66: Middle East and Africa Accountable Care Solutions Market Volume Share (%), by Country 2025 & 2033
- Figure 67: South America Accountable Care Solutions Market Revenue (Million), by Product & Services 2025 & 2033
- Figure 68: South America Accountable Care Solutions Market Volume (K Unit), by Product & Services 2025 & 2033
- Figure 69: South America Accountable Care Solutions Market Revenue Share (%), by Product & Services 2025 & 2033
- Figure 70: South America Accountable Care Solutions Market Volume Share (%), by Product & Services 2025 & 2033
- Figure 71: South America Accountable Care Solutions Market Revenue (Million), by Deployment 2025 & 2033
- Figure 72: South America Accountable Care Solutions Market Volume (K Unit), by Deployment 2025 & 2033
- Figure 73: South America Accountable Care Solutions Market Revenue Share (%), by Deployment 2025 & 2033
- Figure 74: South America Accountable Care Solutions Market Volume Share (%), by Deployment 2025 & 2033
- Figure 75: South America Accountable Care Solutions Market Revenue (Million), by End User 2025 & 2033
- Figure 76: South America Accountable Care Solutions Market Volume (K Unit), by End User 2025 & 2033
- Figure 77: South America Accountable Care Solutions Market Revenue Share (%), by End User 2025 & 2033
- Figure 78: South America Accountable Care Solutions Market Volume Share (%), by End User 2025 & 2033
- Figure 79: South America Accountable Care Solutions Market Revenue (Million), by Country 2025 & 2033
- Figure 80: South America Accountable Care Solutions Market Volume (K Unit), by Country 2025 & 2033
- Figure 81: South America Accountable Care Solutions Market Revenue Share (%), by Country 2025 & 2033
- Figure 82: South America Accountable Care Solutions Market Volume Share (%), by Country 2025 & 2033
List of Tables
- Table 1: Global Accountable Care Solutions Market Revenue Million Forecast, by Product & Services 2020 & 2033
- Table 2: Global Accountable Care Solutions Market Volume K Unit Forecast, by Product & Services 2020 & 2033
- Table 3: Global Accountable Care Solutions Market Revenue Million Forecast, by Deployment 2020 & 2033
- Table 4: Global Accountable Care Solutions Market Volume K Unit Forecast, by Deployment 2020 & 2033
- Table 5: Global Accountable Care Solutions Market Revenue Million Forecast, by End User 2020 & 2033
- Table 6: Global Accountable Care Solutions Market Volume K Unit Forecast, by End User 2020 & 2033
- Table 7: Global Accountable Care Solutions Market Revenue Million Forecast, by Region 2020 & 2033
- Table 8: Global Accountable Care Solutions Market Volume K Unit Forecast, by Region 2020 & 2033
- Table 9: Global Accountable Care Solutions Market Revenue Million Forecast, by Product & Services 2020 & 2033
- Table 10: Global Accountable Care Solutions Market Volume K Unit Forecast, by Product & Services 2020 & 2033
- Table 11: Global Accountable Care Solutions Market Revenue Million Forecast, by Deployment 2020 & 2033
- Table 12: Global Accountable Care Solutions Market Volume K Unit Forecast, by Deployment 2020 & 2033
- Table 13: Global Accountable Care Solutions Market Revenue Million Forecast, by End User 2020 & 2033
- Table 14: Global Accountable Care Solutions Market Volume K Unit Forecast, by End User 2020 & 2033
- Table 15: Global Accountable Care Solutions Market Revenue Million Forecast, by Country 2020 & 2033
- Table 16: Global Accountable Care Solutions Market Volume K Unit Forecast, by Country 2020 & 2033
- Table 17: United States Accountable Care Solutions Market Revenue (Million) Forecast, by Application 2020 & 2033
- Table 18: United States Accountable Care Solutions Market Volume (K Unit) Forecast, by Application 2020 & 2033
- Table 19: Canada Accountable Care Solutions Market Revenue (Million) Forecast, by Application 2020 & 2033
- Table 20: Canada Accountable Care Solutions Market Volume (K Unit) Forecast, by Application 2020 & 2033
- Table 21: Mexico Accountable Care Solutions Market Revenue (Million) Forecast, by Application 2020 & 2033
- Table 22: Mexico Accountable Care Solutions Market Volume (K Unit) Forecast, by Application 2020 & 2033
- Table 23: Global Accountable Care Solutions Market Revenue Million Forecast, by Product & Services 2020 & 2033
- Table 24: Global Accountable Care Solutions Market Volume K Unit Forecast, by Product & Services 2020 & 2033
- Table 25: Global Accountable Care Solutions Market Revenue Million Forecast, by Deployment 2020 & 2033
- Table 26: Global Accountable Care Solutions Market Volume K Unit Forecast, by Deployment 2020 & 2033
- Table 27: Global Accountable Care Solutions Market Revenue Million Forecast, by End User 2020 & 2033
- Table 28: Global Accountable Care Solutions Market Volume K Unit Forecast, by End User 2020 & 2033
- Table 29: Global Accountable Care Solutions Market Revenue Million Forecast, by Country 2020 & 2033
- Table 30: Global Accountable Care Solutions Market Volume K Unit Forecast, by Country 2020 & 2033
- Table 31: Germany Accountable Care Solutions Market Revenue (Million) Forecast, by Application 2020 & 2033
- Table 32: Germany Accountable Care Solutions Market Volume (K Unit) Forecast, by Application 2020 & 2033
- Table 33: United Kingdom Accountable Care Solutions Market Revenue (Million) Forecast, by Application 2020 & 2033
- Table 34: United Kingdom Accountable Care Solutions Market Volume (K Unit) Forecast, by Application 2020 & 2033
- Table 35: France Accountable Care Solutions Market Revenue (Million) Forecast, by Application 2020 & 2033
- Table 36: France Accountable Care Solutions Market Volume (K Unit) Forecast, by Application 2020 & 2033
- Table 37: Italy Accountable Care Solutions Market Revenue (Million) Forecast, by Application 2020 & 2033
- Table 38: Italy Accountable Care Solutions Market Volume (K Unit) Forecast, by Application 2020 & 2033
- Table 39: Spain Accountable Care Solutions Market Revenue (Million) Forecast, by Application 2020 & 2033
- Table 40: Spain Accountable Care Solutions Market Volume (K Unit) Forecast, by Application 2020 & 2033
- Table 41: Rest of Europe Accountable Care Solutions Market Revenue (Million) Forecast, by Application 2020 & 2033
- Table 42: Rest of Europe Accountable Care Solutions Market Volume (K Unit) Forecast, by Application 2020 & 2033
- Table 43: Global Accountable Care Solutions Market Revenue Million Forecast, by Product & Services 2020 & 2033
- Table 44: Global Accountable Care Solutions Market Volume K Unit Forecast, by Product & Services 2020 & 2033
- Table 45: Global Accountable Care Solutions Market Revenue Million Forecast, by Deployment 2020 & 2033
- Table 46: Global Accountable Care Solutions Market Volume K Unit Forecast, by Deployment 2020 & 2033
- Table 47: Global Accountable Care Solutions Market Revenue Million Forecast, by End User 2020 & 2033
- Table 48: Global Accountable Care Solutions Market Volume K Unit Forecast, by End User 2020 & 2033
- Table 49: Global Accountable Care Solutions Market Revenue Million Forecast, by Country 2020 & 2033
- Table 50: Global Accountable Care Solutions Market Volume K Unit Forecast, by Country 2020 & 2033
- Table 51: China Accountable Care Solutions Market Revenue (Million) Forecast, by Application 2020 & 2033
- Table 52: China Accountable Care Solutions Market Volume (K Unit) Forecast, by Application 2020 & 2033
- Table 53: Japan Accountable Care Solutions Market Revenue (Million) Forecast, by Application 2020 & 2033
- Table 54: Japan Accountable Care Solutions Market Volume (K Unit) Forecast, by Application 2020 & 2033
- Table 55: India Accountable Care Solutions Market Revenue (Million) Forecast, by Application 2020 & 2033
- Table 56: India Accountable Care Solutions Market Volume (K Unit) Forecast, by Application 2020 & 2033
- Table 57: Australia Accountable Care Solutions Market Revenue (Million) Forecast, by Application 2020 & 2033
- Table 58: Australia Accountable Care Solutions Market Volume (K Unit) Forecast, by Application 2020 & 2033
- Table 59: South Korea Accountable Care Solutions Market Revenue (Million) Forecast, by Application 2020 & 2033
- Table 60: South Korea Accountable Care Solutions Market Volume (K Unit) Forecast, by Application 2020 & 2033
- Table 61: Rest of Asia Pacific Accountable Care Solutions Market Revenue (Million) Forecast, by Application 2020 & 2033
- Table 62: Rest of Asia Pacific Accountable Care Solutions Market Volume (K Unit) Forecast, by Application 2020 & 2033
- Table 63: Global Accountable Care Solutions Market Revenue Million Forecast, by Product & Services 2020 & 2033
- Table 64: Global Accountable Care Solutions Market Volume K Unit Forecast, by Product & Services 2020 & 2033
- Table 65: Global Accountable Care Solutions Market Revenue Million Forecast, by Deployment 2020 & 2033
- Table 66: Global Accountable Care Solutions Market Volume K Unit Forecast, by Deployment 2020 & 2033
- Table 67: Global Accountable Care Solutions Market Revenue Million Forecast, by End User 2020 & 2033
- Table 68: Global Accountable Care Solutions Market Volume K Unit Forecast, by End User 2020 & 2033
- Table 69: Global Accountable Care Solutions Market Revenue Million Forecast, by Country 2020 & 2033
- Table 70: Global Accountable Care Solutions Market Volume K Unit Forecast, by Country 2020 & 2033
- Table 71: GCC Accountable Care Solutions Market Revenue (Million) Forecast, by Application 2020 & 2033
- Table 72: GCC Accountable Care Solutions Market Volume (K Unit) Forecast, by Application 2020 & 2033
- Table 73: South Africa Accountable Care Solutions Market Revenue (Million) Forecast, by Application 2020 & 2033
- Table 74: South Africa Accountable Care Solutions Market Volume (K Unit) Forecast, by Application 2020 & 2033
- Table 75: Rest of Middle East and Africa Accountable Care Solutions Market Revenue (Million) Forecast, by Application 2020 & 2033
- Table 76: Rest of Middle East and Africa Accountable Care Solutions Market Volume (K Unit) Forecast, by Application 2020 & 2033
- Table 77: Global Accountable Care Solutions Market Revenue Million Forecast, by Product & Services 2020 & 2033
- Table 78: Global Accountable Care Solutions Market Volume K Unit Forecast, by Product & Services 2020 & 2033
- Table 79: Global Accountable Care Solutions Market Revenue Million Forecast, by Deployment 2020 & 2033
- Table 80: Global Accountable Care Solutions Market Volume K Unit Forecast, by Deployment 2020 & 2033
- Table 81: Global Accountable Care Solutions Market Revenue Million Forecast, by End User 2020 & 2033
- Table 82: Global Accountable Care Solutions Market Volume K Unit Forecast, by End User 2020 & 2033
- Table 83: Global Accountable Care Solutions Market Revenue Million Forecast, by Country 2020 & 2033
- Table 84: Global Accountable Care Solutions Market Volume K Unit Forecast, by Country 2020 & 2033
- Table 85: Brazil Accountable Care Solutions Market Revenue (Million) Forecast, by Application 2020 & 2033
- Table 86: Brazil Accountable Care Solutions Market Volume (K Unit) Forecast, by Application 2020 & 2033
- Table 87: Argentina Accountable Care Solutions Market Revenue (Million) Forecast, by Application 2020 & 2033
- Table 88: Argentina Accountable Care Solutions Market Volume (K Unit) Forecast, by Application 2020 & 2033
- Table 89: Rest of South America Accountable Care Solutions Market Revenue (Million) Forecast, by Application 2020 & 2033
- Table 90: Rest of South America Accountable Care Solutions Market Volume (K Unit) Forecast, by Application 2020 & 2033
Frequently Asked Questions
1. What is the projected Compound Annual Growth Rate (CAGR) of the Accountable Care Solutions Market?
The projected CAGR is approximately 10.92%.
2. Which companies are prominent players in the Accountable Care Solutions Market?
Key companies in the market include Mckesson Corporation, Allscripts Healthcare Solutions, Epic Systems Corporation, Eclinicalworks LLC, UnitedHealth Group Incorporated, Verisk Analytics Inc, Constellation Software, IBM Healthcare, Cerner Corporation, ZeOmega Inc, Aetna Inc, Athenahealth Inc.
3. What are the main segments of the Accountable Care Solutions Market?
The market segments include Product & Services, Deployment, End User.
4. Can you provide details about the market size?
The market size is estimated to be USD 2.24 Million as of 2022.
5. What are some drivers contributing to market growth?
Emergence of Big Data in Healthcare; Government Regulations and Initiatives to Promote Patient-Centric Care; Increasing Demand to Curtail Healthcare Costs.
6. What are the notable trends driving market growth?
Electronic Health/Medical Records Segment is Expected to Hold a Significant Market Share Over the Forecast Period.
7. Are there any restraints impacting market growth?
Data Security and Privacy Concerns; High Investments Required for Supporting Infrastructure.
8. Can you provide examples of recent developments in the market?
In March 2022, Collaborative Health Systems, a population health management organization, and Community Care Alliance, an accountable care organization, entered into a venture.
9. What pricing options are available for accessing the report?
Pricing options include single-user, multi-user, and enterprise licenses priced at USD 4750, USD 5250, and USD 8750 respectively.
10. Is the market size provided in terms of value or volume?
The market size is provided in terms of value, measured in Million and volume, measured in K Unit.
11. Are there any specific market keywords associated with the report?
Yes, the market keyword associated with the report is "Accountable Care Solutions Market," which aids in identifying and referencing the specific market segment covered.
12. How do I determine which pricing option suits my needs best?
The pricing options vary based on user requirements and access needs. Individual users may opt for single-user licenses, while businesses requiring broader access may choose multi-user or enterprise licenses for cost-effective access to the report.
13. Are there any additional resources or data provided in the Accountable Care Solutions Market report?
While the report offers comprehensive insights, it's advisable to review the specific contents or supplementary materials provided to ascertain if additional resources or data are available.
14. How can I stay updated on further developments or reports in the Accountable Care Solutions Market?
To stay informed about further developments, trends, and reports in the Accountable Care Solutions Market, consider subscribing to industry newsletters, following relevant companies and organizations, or regularly checking reputable industry news sources and publications.
Methodology
Step 1 - Identification of Relevant Samples Size from Population Database


Step 2 - Approaches for Defining Global Market Size (Value, Volume* & Price*)

Note*: In applicable scenarios
Step 3 - Data Sources
Primary Research
- Web Analytics
- Survey Reports
- Research Institute
- Latest Research Reports
- Opinion Leaders
Secondary Research
- Annual Reports
- White Paper
- Latest Press Release
- Industry Association
- Paid Database
- Investor Presentations

Step 4 - Data Triangulation
Involves using different sources of information in order to increase the validity of a study
These sources are likely to be stakeholders in a program - participants, other researchers, program staff, other community members, and so on.
Then we put all data in single framework & apply various statistical tools to find out the dynamic on the market.
During the analysis stage, feedback from the stakeholder groups would be compared to determine areas of agreement as well as areas of divergence