

Key Insights
The global agricultural analytics market is experiencing robust growth, driven by the increasing adoption of precision agriculture techniques and the rising demand for efficient farming practices. A compound annual growth rate (CAGR) of 14.40% from 2019 to 2024 indicates a significant expansion, projected to continue throughout the forecast period (2025-2033). This growth is fueled by several key factors. The increasing availability of affordable sensors, drones, and satellite imagery is generating vast amounts of data, enabling more precise decision-making. Furthermore, advancements in artificial intelligence (AI) and machine learning (ML) are facilitating the development of sophisticated analytics solutions capable of optimizing resource allocation, predicting yields, and improving overall farm efficiency. The market is segmented by deployment type (on-premise and cloud), farm size (small and medium, large), component type (solutions and services), and analytics type (farm and livestock). Cloud-based solutions are gaining significant traction due to their scalability, accessibility, and cost-effectiveness. Large farms, with their greater resource capacity, are early adopters of these technologies, while smaller farms are increasingly adopting these solutions to enhance their competitiveness. The market's growth is also influenced by government initiatives promoting technological advancements in agriculture and the increasing awareness among farmers regarding the benefits of data-driven decision-making.
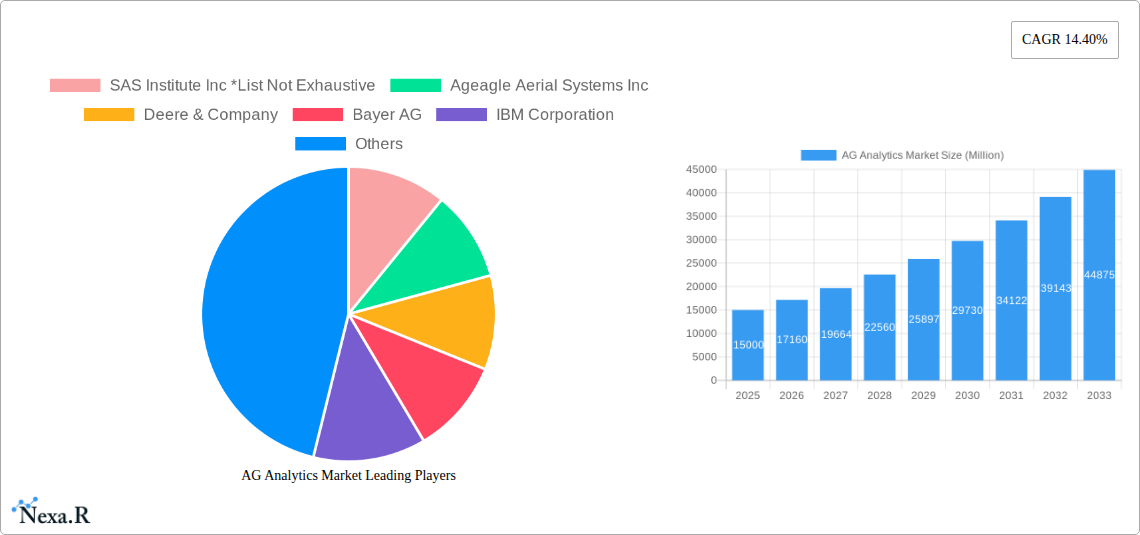
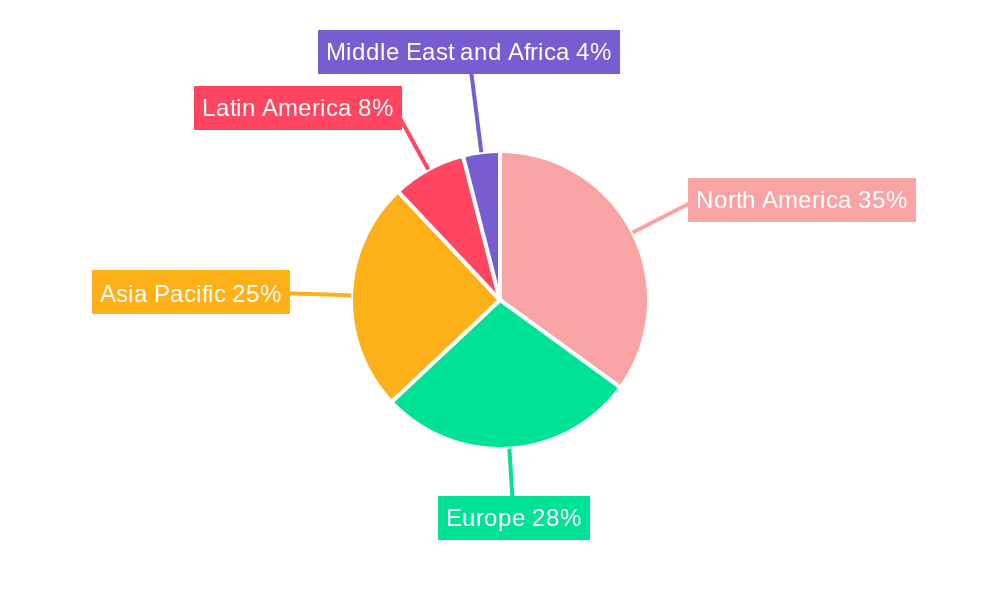
However, the market faces certain challenges. High initial investment costs for technology adoption, particularly for smaller farms, can be a barrier to entry. Data security and privacy concerns related to the collection and analysis of sensitive farm data also need addressing. Furthermore, the lack of skilled professionals to effectively implement and interpret the data generated by these sophisticated analytics systems poses a potential restraint. Despite these challenges, the long-term outlook for the agricultural analytics market remains positive, with continued technological innovation, supportive government policies, and growing farmer awareness expected to drive considerable growth in the coming years. Key players in the market, including SAS Institute Inc., Deere & Company, and IBM Corporation, are actively investing in research and development to enhance their offerings and expand their market share. The market’s geographical spread is expected to see substantial growth across North America, Europe, and the Asia-Pacific region, with developing economies showing the greatest potential.
AG Analytics Market: A Comprehensive Report (2019-2033)
This comprehensive report provides an in-depth analysis of the AG Analytics market, encompassing its dynamics, growth trends, key players, and future outlook. With a focus on both the parent market (Precision Agriculture) and the child market (AG Analytics), this report offers invaluable insights for industry professionals, investors, and stakeholders seeking to understand and capitalize on this rapidly evolving sector. The report covers the period 2019-2033, with a base year of 2025 and a forecast period of 2025-2033. Market values are presented in million units.
AG Analytics Market Market Dynamics & Structure
The AG Analytics market is characterized by moderate concentration, with several key players holding significant market share. However, the market also exhibits considerable dynamism driven by technological innovation, evolving regulatory landscapes, and strategic mergers and acquisitions (M&A). The study period (2019-2024) witnessed a total of xx M&A deals, with an average deal value of xx million. This activity is expected to continue, further shaping the competitive landscape.
- Market Concentration: The top 5 players account for approximately xx% of the market share in 2025.
- Technological Innovation: Advancements in AI, machine learning, and IoT are driving the adoption of sophisticated analytics solutions. However, challenges remain in data integration and interoperability.
- Regulatory Frameworks: Government regulations related to data privacy and security are impacting market growth, requiring enhanced data management practices.
- Competitive Product Substitutes: Traditional methods of farm management pose some competition; however, the advantages of data-driven insights are increasingly evident.
- End-User Demographics: Large farms are currently the primary adopters of AG analytics, but the market is expanding to include small and medium farms.
- M&A Trends: Consolidation is expected to continue, leading to larger players with more comprehensive offerings.
AG Analytics Market Growth Trends & Insights
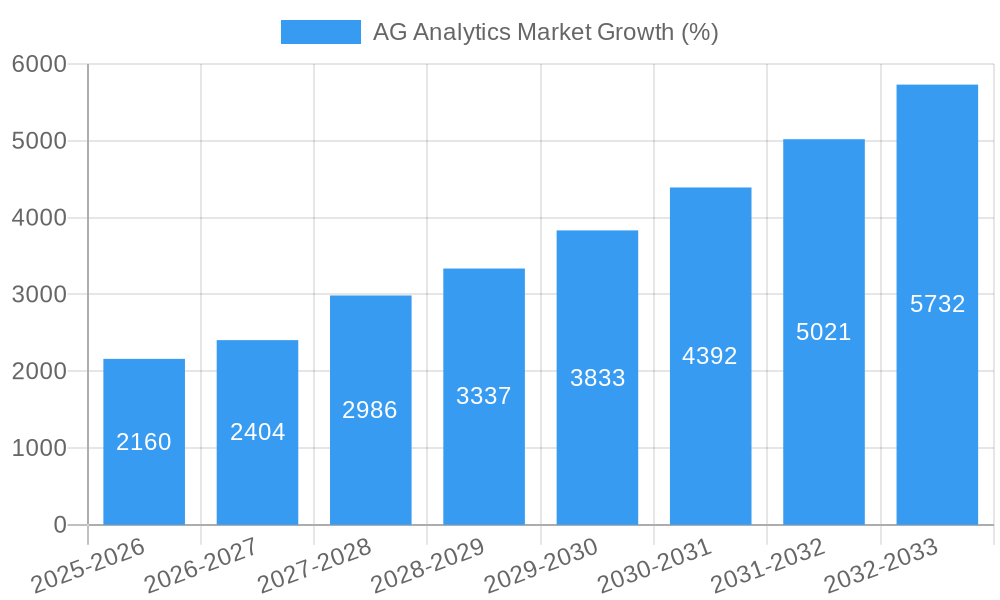
The global AG Analytics market is experiencing robust growth, driven by the increasing adoption of precision agriculture techniques and the need for efficient resource management. The market size was valued at xx million in 2024 and is projected to reach xx million by 2033, exhibiting a CAGR of xx% during the forecast period (2025-2033). This growth is fueled by several key factors: rising demand for increased crop yields, the escalating cost of agricultural inputs, and growing awareness among farmers about the benefits of data-driven decision-making. Market penetration currently stands at xx% in developed regions and xx% in developing regions, with significant room for expansion. Technological disruptions, such as the integration of AI and cloud computing, are accelerating adoption rates and creating new opportunities for market players. Consumer behavior is shifting towards more data-centric approaches to farming, contributing to the market's overall growth trajectory.
Dominant Regions, Countries, or Segments in AG Analytics Market
North America currently dominates the AG Analytics market, driven by high technological adoption, advanced infrastructure, and established agricultural practices. Europe and Asia-Pacific are also significant markets, exhibiting strong growth potential. Within the market segments, the cloud-based deployment type is experiencing the most rapid growth, followed by the farm analytics segment. Large farms are leading adopters, although increasing affordability and accessibility are driving adoption among small and medium farms.
- Key Drivers:
- North America: High investment in agricultural technology, favorable government policies.
- Europe: Stringent environmental regulations, focus on sustainable agriculture.
- Asia-Pacific: Rapid technological advancements, growing adoption of precision farming.
- Segment Dominance:
- Deployment Type: Cloud (xx% market share in 2025)
- Farm Size: Large Farms (xx% market share in 2025)
- Component Type: Solutions (xx% market share in 2025)
- Type: Farm Analytics (xx% market share in 2025)
AG Analytics Market Product Landscape
The AG Analytics market offers a diverse range of products, including software solutions, hardware devices, and data analytics services. Recent product innovations include AI-powered predictive models for yield optimization, advanced sensor technologies for real-time data collection, and cloud-based platforms for seamless data management and analysis. These advancements enhance efficiency, reduce operational costs, and improve the overall profitability of agricultural operations. Key innovations focus on improving the accuracy and reliability of data analysis, enhancing user interfaces for ease of use, and providing integrated solutions that cater to the specific needs of various farm sizes and types.
Key Drivers, Barriers & Challenges in AG Analytics Market
Key Drivers: The AG Analytics market is primarily driven by the need for increased efficiency and productivity in agriculture. Factors such as technological advancements (AI, IoT), rising labor costs, and growing demand for food are propelling market expansion. Government initiatives supporting precision agriculture further accelerate market growth.
Challenges & Restraints: High initial investment costs, limited access to high-speed internet in rural areas, and concerns regarding data security and privacy are key barriers. Furthermore, the complexity of integrating various data sources and the lack of skilled personnel can hinder widespread adoption. Supply chain disruptions related to hardware components have also impacted market growth, resulting in a xx% reduction in production in 2024 (estimated).
Emerging Opportunities in AG Analytics Market
Untapped markets in developing countries, particularly in Africa and South America, represent significant opportunities for growth. Integration of AG analytics with other technologies like drones and robotics offers further expansion potential. The development of tailored solutions for specific crops and livestock types creates niche market opportunities. The increasing focus on sustainable and environmentally friendly farming practices is driving demand for AG analytics solutions that support resource optimization.
Growth Accelerators in the AG Analytics Market Industry
Technological breakthroughs in areas like AI, machine learning, and remote sensing continue to propel market expansion. Strategic partnerships between technology providers and agricultural businesses foster innovation and market penetration. Government initiatives promoting digitalization and precision agriculture provide incentives for market adoption. The expansion into emerging markets and the development of user-friendly interfaces are further accelerating market growth.
Key Players Shaping the AG Analytics Market Market
- SAS Institute Inc
- Ageagle Aerial Systems Inc
- Deere & Company
- Bayer AG
- IBM Corporation
- Conservis Corporation
- PrecisionHawk Inc
- Trimble Inc
- Vistex Inc
- Iteris Inc
- Agrivi
Notable Milestones in AG Analytics Market Sector
- 2020: Launch of the first AI-powered precision irrigation system.
- 2021: Partnership between a major technology company and a leading agricultural cooperative to develop a data analytics platform.
- 2022: Acquisition of a smaller AG analytics company by a large agricultural machinery manufacturer.
- 2023: Introduction of new regulations regarding data privacy in the agricultural sector.
- 2024: Increased investment in research and development related to satellite imagery and crop monitoring.
In-Depth AG Analytics Market Market Outlook
The AG Analytics market is poised for continued robust growth, driven by technological innovation, increasing demand for improved agricultural efficiency, and government support for precision agriculture. Strategic partnerships, expansion into new markets, and the development of innovative solutions will be critical for success in this dynamic market. Significant opportunities exist for players who can effectively leverage data analytics to improve farm productivity, optimize resource utilization, and enhance sustainability. The continued integration with other precision agriculture technologies will shape the future of this sector and drive market value growth significantly in the coming decade.
AG Analytics Market Segmentation
-
1. Component Type
- 1.1. Solutions
- 1.2. Services
-
2. Type
- 2.1. Farm Analytics
- 2.2. Livestock Analytics
-
3. Deployment Type
- 3.1. On-Premise
- 3.2. Cloud
-
4. Farm Size
- 4.1. Small and Medium Farms
- 4.2. Large Farms
AG Analytics Market Segmentation By Geography
- 1. North America
- 2. Europe
- 3. Asia Pacific
- 4. Latin America
- 5. Middle East and Africa
AG Analytics Market REPORT HIGHLIGHTS
| Aspects | Details |
|---|---|
| Study Period | 2019-2033 |
| Base Year | 2024 |
| Estimated Year | 2025 |
| Forecast Period | 2025-2033 |
| Historical Period | 2019-2024 |
| Growth Rate | CAGR of 14.40% from 2019-2033 |
| Segmentation |
|
Table of Contents
- 1. Introduction
- 1.1. Research Scope
- 1.2. Market Segmentation
- 1.3. Research Methodology
- 1.4. Definitions and Assumptions
- 2. Executive Summary
- 2.1. Introduction
- 3. Market Dynamics
- 3.1. Introduction
- 3.2. Market Drivers
- 3.2.1. ; Rising Usage of Cutting-edge Technology-based Solutions for Farming
- 3.3. Market Restrains
- 3.3.1. ; High Capital Cost and Complexity Regarding System Upgrades
- 3.4. Market Trends
- 3.4.1. Farm Analytics is Expected to Grow at a Significant Rate Over the Forecast Period
- 4. Market Factor Analysis
- 4.1. Porters Five Forces
- 4.2. Supply/Value Chain
- 4.3. PESTEL analysis
- 4.4. Market Entropy
- 4.5. Patent/Trademark Analysis
- 5. Global AG Analytics Market Analysis, Insights and Forecast, 2019-2031
- 5.1. Market Analysis, Insights and Forecast - by Component Type
- 5.1.1. Solutions
- 5.1.2. Services
- 5.2. Market Analysis, Insights and Forecast - by Type
- 5.2.1. Farm Analytics
- 5.2.2. Livestock Analytics
- 5.3. Market Analysis, Insights and Forecast - by Deployment Type
- 5.3.1. On-Premise
- 5.3.2. Cloud
- 5.4. Market Analysis, Insights and Forecast - by Farm Size
- 5.4.1. Small and Medium Farms
- 5.4.2. Large Farms
- 5.5. Market Analysis, Insights and Forecast - by Region
- 5.5.1. North America
- 5.5.2. Europe
- 5.5.3. Asia Pacific
- 5.5.4. Latin America
- 5.5.5. Middle East and Africa
- 5.1. Market Analysis, Insights and Forecast - by Component Type
- 6. North America AG Analytics Market Analysis, Insights and Forecast, 2019-2031
- 6.1. Market Analysis, Insights and Forecast - by Component Type
- 6.1.1. Solutions
- 6.1.2. Services
- 6.2. Market Analysis, Insights and Forecast - by Type
- 6.2.1. Farm Analytics
- 6.2.2. Livestock Analytics
- 6.3. Market Analysis, Insights and Forecast - by Deployment Type
- 6.3.1. On-Premise
- 6.3.2. Cloud
- 6.4. Market Analysis, Insights and Forecast - by Farm Size
- 6.4.1. Small and Medium Farms
- 6.4.2. Large Farms
- 6.1. Market Analysis, Insights and Forecast - by Component Type
- 7. Europe AG Analytics Market Analysis, Insights and Forecast, 2019-2031
- 7.1. Market Analysis, Insights and Forecast - by Component Type
- 7.1.1. Solutions
- 7.1.2. Services
- 7.2. Market Analysis, Insights and Forecast - by Type
- 7.2.1. Farm Analytics
- 7.2.2. Livestock Analytics
- 7.3. Market Analysis, Insights and Forecast - by Deployment Type
- 7.3.1. On-Premise
- 7.3.2. Cloud
- 7.4. Market Analysis, Insights and Forecast - by Farm Size
- 7.4.1. Small and Medium Farms
- 7.4.2. Large Farms
- 7.1. Market Analysis, Insights and Forecast - by Component Type
- 8. Asia Pacific AG Analytics Market Analysis, Insights and Forecast, 2019-2031
- 8.1. Market Analysis, Insights and Forecast - by Component Type
- 8.1.1. Solutions
- 8.1.2. Services
- 8.2. Market Analysis, Insights and Forecast - by Type
- 8.2.1. Farm Analytics
- 8.2.2. Livestock Analytics
- 8.3. Market Analysis, Insights and Forecast - by Deployment Type
- 8.3.1. On-Premise
- 8.3.2. Cloud
- 8.4. Market Analysis, Insights and Forecast - by Farm Size
- 8.4.1. Small and Medium Farms
- 8.4.2. Large Farms
- 8.1. Market Analysis, Insights and Forecast - by Component Type
- 9. Latin America AG Analytics Market Analysis, Insights and Forecast, 2019-2031
- 9.1. Market Analysis, Insights and Forecast - by Component Type
- 9.1.1. Solutions
- 9.1.2. Services
- 9.2. Market Analysis, Insights and Forecast - by Type
- 9.2.1. Farm Analytics
- 9.2.2. Livestock Analytics
- 9.3. Market Analysis, Insights and Forecast - by Deployment Type
- 9.3.1. On-Premise
- 9.3.2. Cloud
- 9.4. Market Analysis, Insights and Forecast - by Farm Size
- 9.4.1. Small and Medium Farms
- 9.4.2. Large Farms
- 9.1. Market Analysis, Insights and Forecast - by Component Type
- 10. Middle East and Africa AG Analytics Market Analysis, Insights and Forecast, 2019-2031
- 10.1. Market Analysis, Insights and Forecast - by Component Type
- 10.1.1. Solutions
- 10.1.2. Services
- 10.2. Market Analysis, Insights and Forecast - by Type
- 10.2.1. Farm Analytics
- 10.2.2. Livestock Analytics
- 10.3. Market Analysis, Insights and Forecast - by Deployment Type
- 10.3.1. On-Premise
- 10.3.2. Cloud
- 10.4. Market Analysis, Insights and Forecast - by Farm Size
- 10.4.1. Small and Medium Farms
- 10.4.2. Large Farms
- 10.1. Market Analysis, Insights and Forecast - by Component Type
- 11. North America AG Analytics Market Analysis, Insights and Forecast, 2019-2031
- 11.1. Market Analysis, Insights and Forecast - By Country/Sub-region
- 11.1.1.
- 12. Europe AG Analytics Market Analysis, Insights and Forecast, 2019-2031
- 12.1. Market Analysis, Insights and Forecast - By Country/Sub-region
- 12.1.1.
- 13. Asia Pacific AG Analytics Market Analysis, Insights and Forecast, 2019-2031
- 13.1. Market Analysis, Insights and Forecast - By Country/Sub-region
- 13.1.1.
- 14. Latin America AG Analytics Market Analysis, Insights and Forecast, 2019-2031
- 14.1. Market Analysis, Insights and Forecast - By Country/Sub-region
- 14.1.1.
- 15. Middle East and Africa AG Analytics Market Analysis, Insights and Forecast, 2019-2031
- 15.1. Market Analysis, Insights and Forecast - By Country/Sub-region
- 15.1.1.
- 16. Competitive Analysis
- 16.1. Global Market Share Analysis 2024
- 16.2. Company Profiles
- 16.2.1 SAS Institute Inc *List Not Exhaustive
- 16.2.1.1. Overview
- 16.2.1.2. Products
- 16.2.1.3. SWOT Analysis
- 16.2.1.4. Recent Developments
- 16.2.1.5. Financials (Based on Availability)
- 16.2.2 Ageagle Aerial Systems Inc
- 16.2.2.1. Overview
- 16.2.2.2. Products
- 16.2.2.3. SWOT Analysis
- 16.2.2.4. Recent Developments
- 16.2.2.5. Financials (Based on Availability)
- 16.2.3 Deere & Company
- 16.2.3.1. Overview
- 16.2.3.2. Products
- 16.2.3.3. SWOT Analysis
- 16.2.3.4. Recent Developments
- 16.2.3.5. Financials (Based on Availability)
- 16.2.4 Bayer AG
- 16.2.4.1. Overview
- 16.2.4.2. Products
- 16.2.4.3. SWOT Analysis
- 16.2.4.4. Recent Developments
- 16.2.4.5. Financials (Based on Availability)
- 16.2.5 IBM Corporation
- 16.2.5.1. Overview
- 16.2.5.2. Products
- 16.2.5.3. SWOT Analysis
- 16.2.5.4. Recent Developments
- 16.2.5.5. Financials (Based on Availability)
- 16.2.6 Conservis Corporation
- 16.2.6.1. Overview
- 16.2.6.2. Products
- 16.2.6.3. SWOT Analysis
- 16.2.6.4. Recent Developments
- 16.2.6.5. Financials (Based on Availability)
- 16.2.7 PrecisionHawk Inc
- 16.2.7.1. Overview
- 16.2.7.2. Products
- 16.2.7.3. SWOT Analysis
- 16.2.7.4. Recent Developments
- 16.2.7.5. Financials (Based on Availability)
- 16.2.8 Trimble Inc
- 16.2.8.1. Overview
- 16.2.8.2. Products
- 16.2.8.3. SWOT Analysis
- 16.2.8.4. Recent Developments
- 16.2.8.5. Financials (Based on Availability)
- 16.2.9 Vistex Inc
- 16.2.9.1. Overview
- 16.2.9.2. Products
- 16.2.9.3. SWOT Analysis
- 16.2.9.4. Recent Developments
- 16.2.9.5. Financials (Based on Availability)
- 16.2.10 Iteris Inc
- 16.2.10.1. Overview
- 16.2.10.2. Products
- 16.2.10.3. SWOT Analysis
- 16.2.10.4. Recent Developments
- 16.2.10.5. Financials (Based on Availability)
- 16.2.11 Agrivi
- 16.2.11.1. Overview
- 16.2.11.2. Products
- 16.2.11.3. SWOT Analysis
- 16.2.11.4. Recent Developments
- 16.2.11.5. Financials (Based on Availability)
- 16.2.1 SAS Institute Inc *List Not Exhaustive
List of Figures
- Figure 1: Global AG Analytics Market Revenue Breakdown (Million, %) by Region 2024 & 2032
- Figure 2: North America AG Analytics Market Revenue (Million), by Country 2024 & 2032
- Figure 3: North America AG Analytics Market Revenue Share (%), by Country 2024 & 2032
- Figure 4: Europe AG Analytics Market Revenue (Million), by Country 2024 & 2032
- Figure 5: Europe AG Analytics Market Revenue Share (%), by Country 2024 & 2032
- Figure 6: Asia Pacific AG Analytics Market Revenue (Million), by Country 2024 & 2032
- Figure 7: Asia Pacific AG Analytics Market Revenue Share (%), by Country 2024 & 2032
- Figure 8: Latin America AG Analytics Market Revenue (Million), by Country 2024 & 2032
- Figure 9: Latin America AG Analytics Market Revenue Share (%), by Country 2024 & 2032
- Figure 10: Middle East and Africa AG Analytics Market Revenue (Million), by Country 2024 & 2032
- Figure 11: Middle East and Africa AG Analytics Market Revenue Share (%), by Country 2024 & 2032
- Figure 12: North America AG Analytics Market Revenue (Million), by Component Type 2024 & 2032
- Figure 13: North America AG Analytics Market Revenue Share (%), by Component Type 2024 & 2032
- Figure 14: North America AG Analytics Market Revenue (Million), by Type 2024 & 2032
- Figure 15: North America AG Analytics Market Revenue Share (%), by Type 2024 & 2032
- Figure 16: North America AG Analytics Market Revenue (Million), by Deployment Type 2024 & 2032
- Figure 17: North America AG Analytics Market Revenue Share (%), by Deployment Type 2024 & 2032
- Figure 18: North America AG Analytics Market Revenue (Million), by Farm Size 2024 & 2032
- Figure 19: North America AG Analytics Market Revenue Share (%), by Farm Size 2024 & 2032
- Figure 20: North America AG Analytics Market Revenue (Million), by Country 2024 & 2032
- Figure 21: North America AG Analytics Market Revenue Share (%), by Country 2024 & 2032
- Figure 22: Europe AG Analytics Market Revenue (Million), by Component Type 2024 & 2032
- Figure 23: Europe AG Analytics Market Revenue Share (%), by Component Type 2024 & 2032
- Figure 24: Europe AG Analytics Market Revenue (Million), by Type 2024 & 2032
- Figure 25: Europe AG Analytics Market Revenue Share (%), by Type 2024 & 2032
- Figure 26: Europe AG Analytics Market Revenue (Million), by Deployment Type 2024 & 2032
- Figure 27: Europe AG Analytics Market Revenue Share (%), by Deployment Type 2024 & 2032
- Figure 28: Europe AG Analytics Market Revenue (Million), by Farm Size 2024 & 2032
- Figure 29: Europe AG Analytics Market Revenue Share (%), by Farm Size 2024 & 2032
- Figure 30: Europe AG Analytics Market Revenue (Million), by Country 2024 & 2032
- Figure 31: Europe AG Analytics Market Revenue Share (%), by Country 2024 & 2032
- Figure 32: Asia Pacific AG Analytics Market Revenue (Million), by Component Type 2024 & 2032
- Figure 33: Asia Pacific AG Analytics Market Revenue Share (%), by Component Type 2024 & 2032
- Figure 34: Asia Pacific AG Analytics Market Revenue (Million), by Type 2024 & 2032
- Figure 35: Asia Pacific AG Analytics Market Revenue Share (%), by Type 2024 & 2032
- Figure 36: Asia Pacific AG Analytics Market Revenue (Million), by Deployment Type 2024 & 2032
- Figure 37: Asia Pacific AG Analytics Market Revenue Share (%), by Deployment Type 2024 & 2032
- Figure 38: Asia Pacific AG Analytics Market Revenue (Million), by Farm Size 2024 & 2032
- Figure 39: Asia Pacific AG Analytics Market Revenue Share (%), by Farm Size 2024 & 2032
- Figure 40: Asia Pacific AG Analytics Market Revenue (Million), by Country 2024 & 2032
- Figure 41: Asia Pacific AG Analytics Market Revenue Share (%), by Country 2024 & 2032
- Figure 42: Latin America AG Analytics Market Revenue (Million), by Component Type 2024 & 2032
- Figure 43: Latin America AG Analytics Market Revenue Share (%), by Component Type 2024 & 2032
- Figure 44: Latin America AG Analytics Market Revenue (Million), by Type 2024 & 2032
- Figure 45: Latin America AG Analytics Market Revenue Share (%), by Type 2024 & 2032
- Figure 46: Latin America AG Analytics Market Revenue (Million), by Deployment Type 2024 & 2032
- Figure 47: Latin America AG Analytics Market Revenue Share (%), by Deployment Type 2024 & 2032
- Figure 48: Latin America AG Analytics Market Revenue (Million), by Farm Size 2024 & 2032
- Figure 49: Latin America AG Analytics Market Revenue Share (%), by Farm Size 2024 & 2032
- Figure 50: Latin America AG Analytics Market Revenue (Million), by Country 2024 & 2032
- Figure 51: Latin America AG Analytics Market Revenue Share (%), by Country 2024 & 2032
- Figure 52: Middle East and Africa AG Analytics Market Revenue (Million), by Component Type 2024 & 2032
- Figure 53: Middle East and Africa AG Analytics Market Revenue Share (%), by Component Type 2024 & 2032
- Figure 54: Middle East and Africa AG Analytics Market Revenue (Million), by Type 2024 & 2032
- Figure 55: Middle East and Africa AG Analytics Market Revenue Share (%), by Type 2024 & 2032
- Figure 56: Middle East and Africa AG Analytics Market Revenue (Million), by Deployment Type 2024 & 2032
- Figure 57: Middle East and Africa AG Analytics Market Revenue Share (%), by Deployment Type 2024 & 2032
- Figure 58: Middle East and Africa AG Analytics Market Revenue (Million), by Farm Size 2024 & 2032
- Figure 59: Middle East and Africa AG Analytics Market Revenue Share (%), by Farm Size 2024 & 2032
- Figure 60: Middle East and Africa AG Analytics Market Revenue (Million), by Country 2024 & 2032
- Figure 61: Middle East and Africa AG Analytics Market Revenue Share (%), by Country 2024 & 2032
List of Tables
- Table 1: Global AG Analytics Market Revenue Million Forecast, by Region 2019 & 2032
- Table 2: Global AG Analytics Market Revenue Million Forecast, by Component Type 2019 & 2032
- Table 3: Global AG Analytics Market Revenue Million Forecast, by Type 2019 & 2032
- Table 4: Global AG Analytics Market Revenue Million Forecast, by Deployment Type 2019 & 2032
- Table 5: Global AG Analytics Market Revenue Million Forecast, by Farm Size 2019 & 2032
- Table 6: Global AG Analytics Market Revenue Million Forecast, by Region 2019 & 2032
- Table 7: Global AG Analytics Market Revenue Million Forecast, by Country 2019 & 2032
- Table 8: AG Analytics Market Revenue (Million) Forecast, by Application 2019 & 2032
- Table 9: Global AG Analytics Market Revenue Million Forecast, by Country 2019 & 2032
- Table 10: AG Analytics Market Revenue (Million) Forecast, by Application 2019 & 2032
- Table 11: Global AG Analytics Market Revenue Million Forecast, by Country 2019 & 2032
- Table 12: AG Analytics Market Revenue (Million) Forecast, by Application 2019 & 2032
- Table 13: Global AG Analytics Market Revenue Million Forecast, by Country 2019 & 2032
- Table 14: AG Analytics Market Revenue (Million) Forecast, by Application 2019 & 2032
- Table 15: Global AG Analytics Market Revenue Million Forecast, by Country 2019 & 2032
- Table 16: AG Analytics Market Revenue (Million) Forecast, by Application 2019 & 2032
- Table 17: Global AG Analytics Market Revenue Million Forecast, by Component Type 2019 & 2032
- Table 18: Global AG Analytics Market Revenue Million Forecast, by Type 2019 & 2032
- Table 19: Global AG Analytics Market Revenue Million Forecast, by Deployment Type 2019 & 2032
- Table 20: Global AG Analytics Market Revenue Million Forecast, by Farm Size 2019 & 2032
- Table 21: Global AG Analytics Market Revenue Million Forecast, by Country 2019 & 2032
- Table 22: Global AG Analytics Market Revenue Million Forecast, by Component Type 2019 & 2032
- Table 23: Global AG Analytics Market Revenue Million Forecast, by Type 2019 & 2032
- Table 24: Global AG Analytics Market Revenue Million Forecast, by Deployment Type 2019 & 2032
- Table 25: Global AG Analytics Market Revenue Million Forecast, by Farm Size 2019 & 2032
- Table 26: Global AG Analytics Market Revenue Million Forecast, by Country 2019 & 2032
- Table 27: Global AG Analytics Market Revenue Million Forecast, by Component Type 2019 & 2032
- Table 28: Global AG Analytics Market Revenue Million Forecast, by Type 2019 & 2032
- Table 29: Global AG Analytics Market Revenue Million Forecast, by Deployment Type 2019 & 2032
- Table 30: Global AG Analytics Market Revenue Million Forecast, by Farm Size 2019 & 2032
- Table 31: Global AG Analytics Market Revenue Million Forecast, by Country 2019 & 2032
- Table 32: Global AG Analytics Market Revenue Million Forecast, by Component Type 2019 & 2032
- Table 33: Global AG Analytics Market Revenue Million Forecast, by Type 2019 & 2032
- Table 34: Global AG Analytics Market Revenue Million Forecast, by Deployment Type 2019 & 2032
- Table 35: Global AG Analytics Market Revenue Million Forecast, by Farm Size 2019 & 2032
- Table 36: Global AG Analytics Market Revenue Million Forecast, by Country 2019 & 2032
- Table 37: Global AG Analytics Market Revenue Million Forecast, by Component Type 2019 & 2032
- Table 38: Global AG Analytics Market Revenue Million Forecast, by Type 2019 & 2032
- Table 39: Global AG Analytics Market Revenue Million Forecast, by Deployment Type 2019 & 2032
- Table 40: Global AG Analytics Market Revenue Million Forecast, by Farm Size 2019 & 2032
- Table 41: Global AG Analytics Market Revenue Million Forecast, by Country 2019 & 2032
Frequently Asked Questions
1. What is the projected Compound Annual Growth Rate (CAGR) of the AG Analytics Market?
The projected CAGR is approximately 14.40%.
2. Which companies are prominent players in the AG Analytics Market?
Key companies in the market include SAS Institute Inc *List Not Exhaustive, Ageagle Aerial Systems Inc, Deere & Company, Bayer AG, IBM Corporation, Conservis Corporation, PrecisionHawk Inc, Trimble Inc, Vistex Inc, Iteris Inc, Agrivi.
3. What are the main segments of the AG Analytics Market?
The market segments include Component Type, Type, Deployment Type, Farm Size.
4. Can you provide details about the market size?
The market size is estimated to be USD XX Million as of 2022.
5. What are some drivers contributing to market growth?
; Rising Usage of Cutting-edge Technology-based Solutions for Farming.
6. What are the notable trends driving market growth?
Farm Analytics is Expected to Grow at a Significant Rate Over the Forecast Period.
7. Are there any restraints impacting market growth?
; High Capital Cost and Complexity Regarding System Upgrades.
8. Can you provide examples of recent developments in the market?
N/A
9. What pricing options are available for accessing the report?
Pricing options include single-user, multi-user, and enterprise licenses priced at USD 4750, USD 5250, and USD 8750 respectively.
10. Is the market size provided in terms of value or volume?
The market size is provided in terms of value, measured in Million.
11. Are there any specific market keywords associated with the report?
Yes, the market keyword associated with the report is "AG Analytics Market," which aids in identifying and referencing the specific market segment covered.
12. How do I determine which pricing option suits my needs best?
The pricing options vary based on user requirements and access needs. Individual users may opt for single-user licenses, while businesses requiring broader access may choose multi-user or enterprise licenses for cost-effective access to the report.
13. Are there any additional resources or data provided in the AG Analytics Market report?
While the report offers comprehensive insights, it's advisable to review the specific contents or supplementary materials provided to ascertain if additional resources or data are available.
14. How can I stay updated on further developments or reports in the AG Analytics Market?
To stay informed about further developments, trends, and reports in the AG Analytics Market, consider subscribing to industry newsletters, following relevant companies and organizations, or regularly checking reputable industry news sources and publications.
Methodology
Step 1 - Identification of Relevant Samples Size from Population Database


Step 2 - Approaches for Defining Global Market Size (Value, Volume* & Price*)

Note*: In applicable scenarios
Step 3 - Data Sources
Primary Research
- Web Analytics
- Survey Reports
- Research Institute
- Latest Research Reports
- Opinion Leaders
Secondary Research
- Annual Reports
- White Paper
- Latest Press Release
- Industry Association
- Paid Database
- Investor Presentations

Step 4 - Data Triangulation
Involves using different sources of information in order to increase the validity of a study
These sources are likely to be stakeholders in a program - participants, other researchers, program staff, other community members, and so on.
Then we put all data in single framework & apply various statistical tools to find out the dynamic on the market.
During the analysis stage, feedback from the stakeholder groups would be compared to determine areas of agreement as well as areas of divergence
