

Key Insights
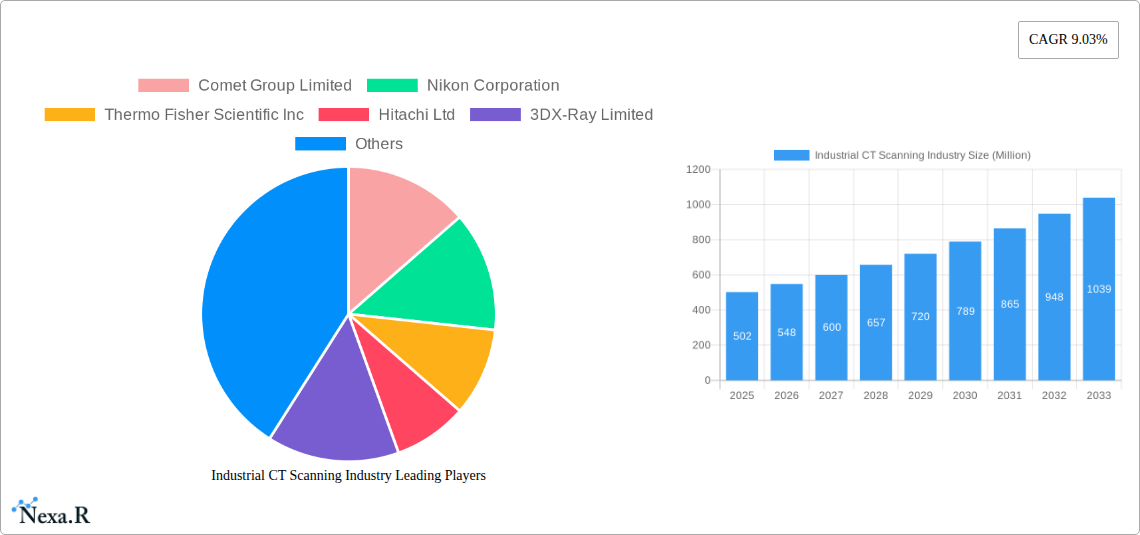
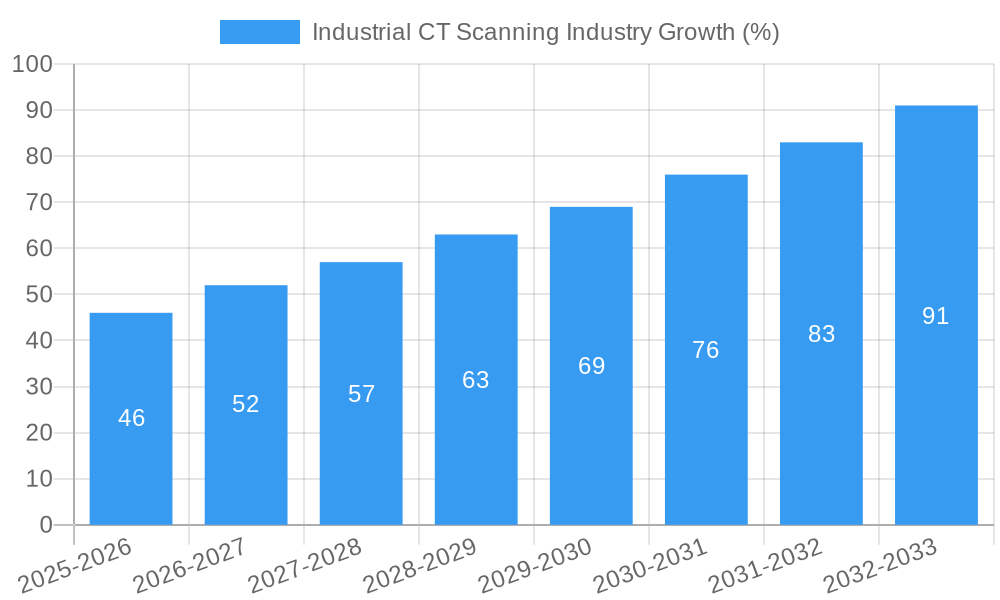
The industrial CT scanning market, valued at $502 million in 2025, is projected to experience robust growth, driven by increasing demand for advanced non-destructive testing (NDT) methods across diverse industries. The 9.03% CAGR from 2019 to 2025 indicates a significant upward trajectory, fueled by several key factors. The automotive sector's push for lightweighting and improved component quality is a major driver, alongside the aerospace industry's need for rigorous quality control in manufacturing complex parts. Furthermore, the electronics industry's reliance on miniaturization and intricate circuit boards necessitates high-resolution imaging provided by industrial CT scanning. Growth is also spurred by advancements in CT scanner technology, offering higher resolutions, faster scan times, and more sophisticated software for analysis. The expanding applications of industrial CT scanning, extending beyond traditional flaw detection to encompass failure analysis and assembly analysis, contribute to this market expansion.
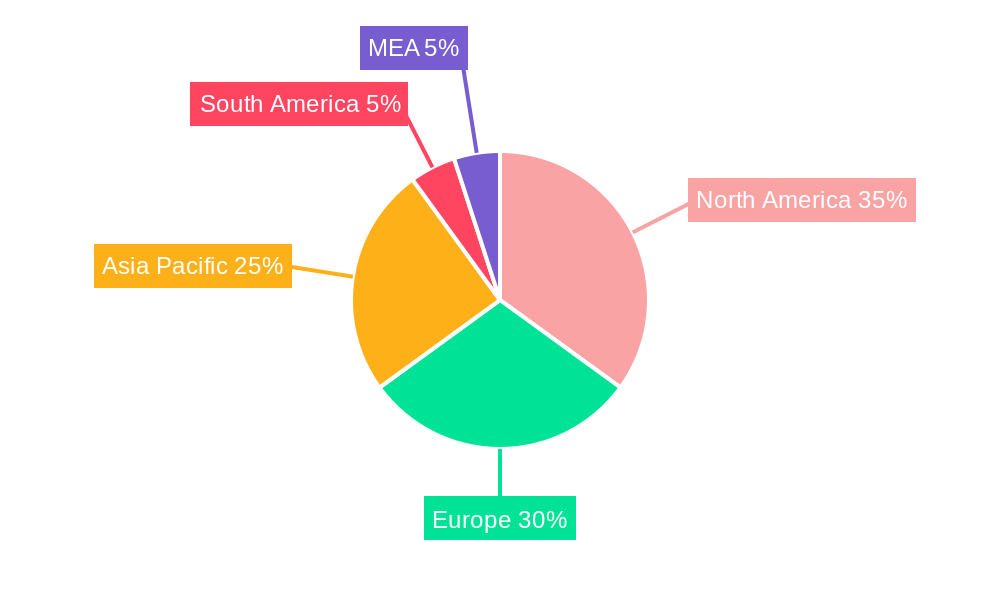
However, the market faces some restraints. The high initial investment cost of industrial CT scanners can be a barrier to entry for smaller companies. Competition among established players like Comet Group, Nikon, and Thermo Fisher Scientific also creates a challenging landscape. Nevertheless, the long-term benefits of improved quality control, reduced waste, and enhanced product safety outweigh these limitations, ensuring continued market growth. Regional growth will be varied, with North America and Europe expected to maintain strong market shares due to established industrial infrastructure and technological advancements. However, Asia-Pacific is projected to witness the most significant growth, propelled by rapid industrialization and increasing manufacturing output in countries like China and India. The market segmentation by application (flaw detection, failure analysis, etc.) and end-user industry (aerospace, automotive, etc.) provides valuable insights for strategic market players seeking to capitalize on specific opportunities. The forecast period of 2025-2033 promises continued expansion, making industrial CT scanning a lucrative and dynamically evolving market.
Industrial CT Scanning Industry Market Report: 2019-2033
This comprehensive report provides an in-depth analysis of the Industrial CT Scanning industry, encompassing market dynamics, growth trends, key players, and future outlook. With a focus on parent and child markets, this report offers crucial insights for industry professionals, investors, and strategic decision-makers. The study period covers 2019-2033, with 2025 as the base and estimated year.
Study Period: 2019–2033 Base Year: 2025 Estimated Year: 2025 Forecast Period: 2025–2033 Historical Period: 2019–2024
Industrial CT Scanning Industry Market Dynamics & Structure
The Industrial CT Scanning market, valued at xx Million in 2024, is experiencing significant growth driven by technological advancements and increasing adoption across various end-user industries. Market concentration is moderate, with several key players holding substantial shares but not dominating completely. Technological innovation, particularly in higher energy systems and advanced image processing, is a major driver. Regulatory frameworks, concerning safety and data security, influence market dynamics. Competitive product substitutes, such as traditional non-destructive testing methods, exist but face limitations in terms of detail and speed. End-user demographics are diverse, spanning various sectors demanding high-precision inspection and analysis. M&A activity has been moderate, with strategic acquisitions focused on expanding technological capabilities and market reach.
- Market Concentration: Moderately concentrated, with top 5 players holding approximately xx% market share in 2024.
- Technological Innovation: Focus on higher energy systems, improved image resolution, and AI-powered analysis.
- Regulatory Frameworks: Safety standards and data privacy regulations impact market growth.
- Competitive Substitutes: Traditional NDT methods present limited competition due to inferior detail and speed.
- M&A Trends: Strategic acquisitions to expand technology portfolios and geographic reach; xx deals recorded between 2019 and 2024.
- End-user Demographics: Diverse, including aerospace, automotive, electronics, and oil & gas sectors.
Industrial CT Scanning Industry Growth Trends & Insights
The Industrial CT Scanning market exhibits a robust CAGR of xx% during the forecast period (2025-2033), fueled by rising demand for quality control, stringent regulatory compliance, and the need for detailed component analysis across multiple industries. Market size is projected to reach xx Million by 2033. Adoption rates are increasing across diverse sectors, driven by improved efficiency and reduced downtime associated with improved defect detection. Technological disruptions, such as advancements in X-ray source technology and AI-powered image analysis, are accelerating market growth. Shifts in consumer behavior towards improved product quality and safety standards are indirectly driving market expansion. The increasing complexity of components in diverse industries necessitates the use of CT scanning for comprehensive analysis, contributing significantly to market growth. The market penetration rate is projected to increase from xx% in 2025 to xx% by 2033.
Dominant Regions, Countries, or Segments in Industrial CT Scanning Industry
North America currently holds the largest market share, driven by strong technological advancements, a robust aerospace industry, and a high concentration of key players. Europe and Asia-Pacific are also witnessing significant growth, driven by increasing industrialization and stringent quality control requirements.
Leading Application Segment: Flaw Detection and Inspection accounts for the largest market share, driven by its critical role in quality assurance and preventing failures in critical components.
Leading End-User Industry: The Aerospace industry is a major driver due to the demanding requirements for safety and reliability in aerospace components. The automotive industry is also a significant contributor.
- North America: Strong technological base, large aerospace sector, and presence of major players.
- Europe: Growing adoption across various industries, driven by stringent regulatory requirements.
- Asia-Pacific: Rapid industrialization and increasing demand for quality control in manufacturing.
- Flaw Detection & Inspection: High demand for ensuring product quality and safety.
- Aerospace Industry: Stringent requirements and critical safety considerations driving high adoption.
Industrial CT Scanning Industry Product Landscape
The industrial CT scanning market offers a range of systems, from benchtop micro-CT systems for smaller samples to large-scale systems capable of scanning massive components. Key innovations include higher energy X-ray sources for enhanced penetration capabilities and advanced software for automated defect detection and analysis. Unique selling propositions often include superior image resolution, faster scan times, and user-friendly software interfaces. Continuous technological advancements focus on improved image quality, increased throughput, and advanced analysis capabilities, leading to greater efficiency and accuracy.
Key Drivers, Barriers & Challenges in Industrial CT Scanning Industry
Key Drivers:
- Increasing demand for quality control and non-destructive testing across multiple industries.
- Advancements in X-ray source technology and image processing algorithms.
- Growing adoption of Industry 4.0 and automation in manufacturing processes.
Key Barriers & Challenges:
- High initial investment costs for advanced systems.
- Skill gap in operating and interpreting CT scan data.
- Competition from alternative non-destructive testing methods. This results in a estimated xx% reduction in market growth annually.
Emerging Opportunities in Industrial CT Scanning Industry
- Expansion into emerging markets with increasing industrial activity.
- Development of specialized systems for specific applications (e.g., additive manufacturing, battery inspection).
- Integration of AI and machine learning for automated defect detection and analysis.
Growth Accelerators in the Industrial CT Scanning Industry
Technological breakthroughs in X-ray source technology, image processing, and AI-powered analysis are key growth drivers. Strategic partnerships between CT scanner manufacturers and end-user industries are accelerating market expansion. Market expansion strategies focusing on emerging markets and specialized applications will further fuel market growth.
Key Players Shaping the Industrial CT Scanning Industry Market
- Comet Group Limited
- Nikon Corporation
- Thermo Fisher Scientific Inc
- Hitachi Ltd
- 3DX-Ray Limited
- Zeiss International
- Omron Corporation
- Waygate Technologies
- Bruker Corporation
- Shimadzu Corporation
Notable Milestones in Industrial CT Scanning Industry Sector
- December 2020: Waygate Technologies launched the Phoenix Power|scan HE, a high-energy CT system with significantly enhanced penetration capabilities. This significantly expanded the range of applications for CT scanning.
- March 2021: ZEISS introduced the ZEISS Xradia CrystalCT micro-CT system, enabling 3D crystallographic imaging and opening up new research and industrial applications. This innovation improved the resolution and detail in micro-CT imaging.
In-Depth Industrial CT Scanning Industry Market Outlook
The Industrial CT Scanning market is poised for continued strong growth, driven by technological advancements, increasing adoption across diverse industries, and the expansion into new applications. Strategic partnerships and market expansion strategies will further fuel this growth, leading to significant market expansion and increased market penetration within the coming years. The continued development of higher energy systems and improved software capabilities will unlock new possibilities for inspection and analysis.
Industrial CT Scanning Industry Segmentation
-
1. Application
- 1.1. Flaw Detection and Inspection
- 1.2. Failure Analysis
- 1.3. Assembly Analysis
- 1.4. Other Applications
-
2. End-user Industry
- 2.1. Aerospace and Defense
- 2.2. Automotive
- 2.3. Electronics
- 2.4. Oil and Gas
- 2.5. Other End-user Industries
Industrial CT Scanning Industry Segmentation By Geography
- 1. North America
- 2. Europe
- 3. Asia
- 4. Australia and New Zealand
- 5. Latin America
- 6. Middle East and Africa
Industrial CT Scanning Industry REPORT HIGHLIGHTS
| Aspects | Details |
|---|---|
| Study Period | 2019-2033 |
| Base Year | 2024 |
| Estimated Year | 2025 |
| Forecast Period | 2025-2033 |
| Historical Period | 2019-2024 |
| Growth Rate | CAGR of 9.03% from 2019-2033 |
| Segmentation |
|
Table of Contents
- 1. Introduction
- 1.1. Research Scope
- 1.2. Market Segmentation
- 1.3. Research Methodology
- 1.4. Definitions and Assumptions
- 2. Executive Summary
- 2.1. Introduction
- 3. Market Dynamics
- 3.1. Introduction
- 3.2. Market Drivers
- 3.2.1. Technology Improvements in Resolution and Image Processing; Intensifying Demand for Portable Radiography Equipment
- 3.3. Market Restrains
- 3.3.1. High Acquisition and Maintenace Cost of Industrial CT systems
- 3.4. Market Trends
- 3.4.1. Aerospace Industry to Drive the Industrial Computed Tomography Market
- 4. Market Factor Analysis
- 4.1. Porters Five Forces
- 4.2. Supply/Value Chain
- 4.3. PESTEL analysis
- 4.4. Market Entropy
- 4.5. Patent/Trademark Analysis
- 5. Global Industrial CT Scanning Industry Analysis, Insights and Forecast, 2019-2031
- 5.1. Market Analysis, Insights and Forecast - by Application
- 5.1.1. Flaw Detection and Inspection
- 5.1.2. Failure Analysis
- 5.1.3. Assembly Analysis
- 5.1.4. Other Applications
- 5.2. Market Analysis, Insights and Forecast - by End-user Industry
- 5.2.1. Aerospace and Defense
- 5.2.2. Automotive
- 5.2.3. Electronics
- 5.2.4. Oil and Gas
- 5.2.5. Other End-user Industries
- 5.3. Market Analysis, Insights and Forecast - by Region
- 5.3.1. North America
- 5.3.2. Europe
- 5.3.3. Asia
- 5.3.4. Australia and New Zealand
- 5.3.5. Latin America
- 5.3.6. Middle East and Africa
- 5.1. Market Analysis, Insights and Forecast - by Application
- 6. North America Industrial CT Scanning Industry Analysis, Insights and Forecast, 2019-2031
- 6.1. Market Analysis, Insights and Forecast - by Application
- 6.1.1. Flaw Detection and Inspection
- 6.1.2. Failure Analysis
- 6.1.3. Assembly Analysis
- 6.1.4. Other Applications
- 6.2. Market Analysis, Insights and Forecast - by End-user Industry
- 6.2.1. Aerospace and Defense
- 6.2.2. Automotive
- 6.2.3. Electronics
- 6.2.4. Oil and Gas
- 6.2.5. Other End-user Industries
- 6.1. Market Analysis, Insights and Forecast - by Application
- 7. Europe Industrial CT Scanning Industry Analysis, Insights and Forecast, 2019-2031
- 7.1. Market Analysis, Insights and Forecast - by Application
- 7.1.1. Flaw Detection and Inspection
- 7.1.2. Failure Analysis
- 7.1.3. Assembly Analysis
- 7.1.4. Other Applications
- 7.2. Market Analysis, Insights and Forecast - by End-user Industry
- 7.2.1. Aerospace and Defense
- 7.2.2. Automotive
- 7.2.3. Electronics
- 7.2.4. Oil and Gas
- 7.2.5. Other End-user Industries
- 7.1. Market Analysis, Insights and Forecast - by Application
- 8. Asia Industrial CT Scanning Industry Analysis, Insights and Forecast, 2019-2031
- 8.1. Market Analysis, Insights and Forecast - by Application
- 8.1.1. Flaw Detection and Inspection
- 8.1.2. Failure Analysis
- 8.1.3. Assembly Analysis
- 8.1.4. Other Applications
- 8.2. Market Analysis, Insights and Forecast - by End-user Industry
- 8.2.1. Aerospace and Defense
- 8.2.2. Automotive
- 8.2.3. Electronics
- 8.2.4. Oil and Gas
- 8.2.5. Other End-user Industries
- 8.1. Market Analysis, Insights and Forecast - by Application
- 9. Australia and New Zealand Industrial CT Scanning Industry Analysis, Insights and Forecast, 2019-2031
- 9.1. Market Analysis, Insights and Forecast - by Application
- 9.1.1. Flaw Detection and Inspection
- 9.1.2. Failure Analysis
- 9.1.3. Assembly Analysis
- 9.1.4. Other Applications
- 9.2. Market Analysis, Insights and Forecast - by End-user Industry
- 9.2.1. Aerospace and Defense
- 9.2.2. Automotive
- 9.2.3. Electronics
- 9.2.4. Oil and Gas
- 9.2.5. Other End-user Industries
- 9.1. Market Analysis, Insights and Forecast - by Application
- 10. Latin America Industrial CT Scanning Industry Analysis, Insights and Forecast, 2019-2031
- 10.1. Market Analysis, Insights and Forecast - by Application
- 10.1.1. Flaw Detection and Inspection
- 10.1.2. Failure Analysis
- 10.1.3. Assembly Analysis
- 10.1.4. Other Applications
- 10.2. Market Analysis, Insights and Forecast - by End-user Industry
- 10.2.1. Aerospace and Defense
- 10.2.2. Automotive
- 10.2.3. Electronics
- 10.2.4. Oil and Gas
- 10.2.5. Other End-user Industries
- 10.1. Market Analysis, Insights and Forecast - by Application
- 11. Middle East and Africa Industrial CT Scanning Industry Analysis, Insights and Forecast, 2019-2031
- 11.1. Market Analysis, Insights and Forecast - by Application
- 11.1.1. Flaw Detection and Inspection
- 11.1.2. Failure Analysis
- 11.1.3. Assembly Analysis
- 11.1.4. Other Applications
- 11.2. Market Analysis, Insights and Forecast - by End-user Industry
- 11.2.1. Aerospace and Defense
- 11.2.2. Automotive
- 11.2.3. Electronics
- 11.2.4. Oil and Gas
- 11.2.5. Other End-user Industries
- 11.1. Market Analysis, Insights and Forecast - by Application
- 12. North America Industrial CT Scanning Industry Analysis, Insights and Forecast, 2019-2031
- 12.1. Market Analysis, Insights and Forecast - By Country/Sub-region
- 12.1.1 United States
- 12.1.2 Canada
- 12.1.3 Mexico
- 13. Europe Industrial CT Scanning Industry Analysis, Insights and Forecast, 2019-2031
- 13.1. Market Analysis, Insights and Forecast - By Country/Sub-region
- 13.1.1 Germany
- 13.1.2 United Kingdom
- 13.1.3 France
- 13.1.4 Spain
- 13.1.5 Italy
- 13.1.6 Spain
- 13.1.7 Belgium
- 13.1.8 Netherland
- 13.1.9 Nordics
- 13.1.10 Rest of Europe
- 14. Asia Pacific Industrial CT Scanning Industry Analysis, Insights and Forecast, 2019-2031
- 14.1. Market Analysis, Insights and Forecast - By Country/Sub-region
- 14.1.1 China
- 14.1.2 Japan
- 14.1.3 India
- 14.1.4 South Korea
- 14.1.5 Southeast Asia
- 14.1.6 Australia
- 14.1.7 Indonesia
- 14.1.8 Phillipes
- 14.1.9 Singapore
- 14.1.10 Thailandc
- 14.1.11 Rest of Asia Pacific
- 15. South America Industrial CT Scanning Industry Analysis, Insights and Forecast, 2019-2031
- 15.1. Market Analysis, Insights and Forecast - By Country/Sub-region
- 15.1.1 Brazil
- 15.1.2 Argentina
- 15.1.3 Peru
- 15.1.4 Chile
- 15.1.5 Colombia
- 15.1.6 Ecuador
- 15.1.7 Venezuela
- 15.1.8 Rest of South America
- 16. North America Industrial CT Scanning Industry Analysis, Insights and Forecast, 2019-2031
- 16.1. Market Analysis, Insights and Forecast - By Country/Sub-region
- 16.1.1 United States
- 16.1.2 Canada
- 16.1.3 Mexico
- 17. MEA Industrial CT Scanning Industry Analysis, Insights and Forecast, 2019-2031
- 17.1. Market Analysis, Insights and Forecast - By Country/Sub-region
- 17.1.1 United Arab Emirates
- 17.1.2 Saudi Arabia
- 17.1.3 South Africa
- 17.1.4 Rest of Middle East and Africa
- 18. Competitive Analysis
- 18.1. Global Market Share Analysis 2024
- 18.2. Company Profiles
- 18.2.1 Comet Group Limited
- 18.2.1.1. Overview
- 18.2.1.2. Products
- 18.2.1.3. SWOT Analysis
- 18.2.1.4. Recent Developments
- 18.2.1.5. Financials (Based on Availability)
- 18.2.2 Nikon Corporation
- 18.2.2.1. Overview
- 18.2.2.2. Products
- 18.2.2.3. SWOT Analysis
- 18.2.2.4. Recent Developments
- 18.2.2.5. Financials (Based on Availability)
- 18.2.3 Thermo Fisher Scientific Inc
- 18.2.3.1. Overview
- 18.2.3.2. Products
- 18.2.3.3. SWOT Analysis
- 18.2.3.4. Recent Developments
- 18.2.3.5. Financials (Based on Availability)
- 18.2.4 Hitachi Ltd
- 18.2.4.1. Overview
- 18.2.4.2. Products
- 18.2.4.3. SWOT Analysis
- 18.2.4.4. Recent Developments
- 18.2.4.5. Financials (Based on Availability)
- 18.2.5 3DX-Ray Limited
- 18.2.5.1. Overview
- 18.2.5.2. Products
- 18.2.5.3. SWOT Analysis
- 18.2.5.4. Recent Developments
- 18.2.5.5. Financials (Based on Availability)
- 18.2.6 Zeiss International
- 18.2.6.1. Overview
- 18.2.6.2. Products
- 18.2.6.3. SWOT Analysis
- 18.2.6.4. Recent Developments
- 18.2.6.5. Financials (Based on Availability)
- 18.2.7 Omron Corporation
- 18.2.7.1. Overview
- 18.2.7.2. Products
- 18.2.7.3. SWOT Analysis
- 18.2.7.4. Recent Developments
- 18.2.7.5. Financials (Based on Availability)
- 18.2.8 Waygate Technologies
- 18.2.8.1. Overview
- 18.2.8.2. Products
- 18.2.8.3. SWOT Analysis
- 18.2.8.4. Recent Developments
- 18.2.8.5. Financials (Based on Availability)
- 18.2.9 Bruker Corporation
- 18.2.9.1. Overview
- 18.2.9.2. Products
- 18.2.9.3. SWOT Analysis
- 18.2.9.4. Recent Developments
- 18.2.9.5. Financials (Based on Availability)
- 18.2.10 Shimadzu Corporation
- 18.2.10.1. Overview
- 18.2.10.2. Products
- 18.2.10.3. SWOT Analysis
- 18.2.10.4. Recent Developments
- 18.2.10.5. Financials (Based on Availability)
- 18.2.1 Comet Group Limited
List of Figures
- Figure 1: Global Industrial CT Scanning Industry Revenue Breakdown (Million, %) by Region 2024 & 2032
- Figure 2: Global Industrial CT Scanning Industry Volume Breakdown (K Unit, %) by Region 2024 & 2032
- Figure 3: North America Industrial CT Scanning Industry Revenue (Million), by Country 2024 & 2032
- Figure 4: North America Industrial CT Scanning Industry Volume (K Unit), by Country 2024 & 2032
- Figure 5: North America Industrial CT Scanning Industry Revenue Share (%), by Country 2024 & 2032
- Figure 6: North America Industrial CT Scanning Industry Volume Share (%), by Country 2024 & 2032
- Figure 7: Europe Industrial CT Scanning Industry Revenue (Million), by Country 2024 & 2032
- Figure 8: Europe Industrial CT Scanning Industry Volume (K Unit), by Country 2024 & 2032
- Figure 9: Europe Industrial CT Scanning Industry Revenue Share (%), by Country 2024 & 2032
- Figure 10: Europe Industrial CT Scanning Industry Volume Share (%), by Country 2024 & 2032
- Figure 11: Asia Pacific Industrial CT Scanning Industry Revenue (Million), by Country 2024 & 2032
- Figure 12: Asia Pacific Industrial CT Scanning Industry Volume (K Unit), by Country 2024 & 2032
- Figure 13: Asia Pacific Industrial CT Scanning Industry Revenue Share (%), by Country 2024 & 2032
- Figure 14: Asia Pacific Industrial CT Scanning Industry Volume Share (%), by Country 2024 & 2032
- Figure 15: South America Industrial CT Scanning Industry Revenue (Million), by Country 2024 & 2032
- Figure 16: South America Industrial CT Scanning Industry Volume (K Unit), by Country 2024 & 2032
- Figure 17: South America Industrial CT Scanning Industry Revenue Share (%), by Country 2024 & 2032
- Figure 18: South America Industrial CT Scanning Industry Volume Share (%), by Country 2024 & 2032
- Figure 19: North America Industrial CT Scanning Industry Revenue (Million), by Country 2024 & 2032
- Figure 20: North America Industrial CT Scanning Industry Volume (K Unit), by Country 2024 & 2032
- Figure 21: North America Industrial CT Scanning Industry Revenue Share (%), by Country 2024 & 2032
- Figure 22: North America Industrial CT Scanning Industry Volume Share (%), by Country 2024 & 2032
- Figure 23: MEA Industrial CT Scanning Industry Revenue (Million), by Country 2024 & 2032
- Figure 24: MEA Industrial CT Scanning Industry Volume (K Unit), by Country 2024 & 2032
- Figure 25: MEA Industrial CT Scanning Industry Revenue Share (%), by Country 2024 & 2032
- Figure 26: MEA Industrial CT Scanning Industry Volume Share (%), by Country 2024 & 2032
- Figure 27: North America Industrial CT Scanning Industry Revenue (Million), by Application 2024 & 2032
- Figure 28: North America Industrial CT Scanning Industry Volume (K Unit), by Application 2024 & 2032
- Figure 29: North America Industrial CT Scanning Industry Revenue Share (%), by Application 2024 & 2032
- Figure 30: North America Industrial CT Scanning Industry Volume Share (%), by Application 2024 & 2032
- Figure 31: North America Industrial CT Scanning Industry Revenue (Million), by End-user Industry 2024 & 2032
- Figure 32: North America Industrial CT Scanning Industry Volume (K Unit), by End-user Industry 2024 & 2032
- Figure 33: North America Industrial CT Scanning Industry Revenue Share (%), by End-user Industry 2024 & 2032
- Figure 34: North America Industrial CT Scanning Industry Volume Share (%), by End-user Industry 2024 & 2032
- Figure 35: North America Industrial CT Scanning Industry Revenue (Million), by Country 2024 & 2032
- Figure 36: North America Industrial CT Scanning Industry Volume (K Unit), by Country 2024 & 2032
- Figure 37: North America Industrial CT Scanning Industry Revenue Share (%), by Country 2024 & 2032
- Figure 38: North America Industrial CT Scanning Industry Volume Share (%), by Country 2024 & 2032
- Figure 39: Europe Industrial CT Scanning Industry Revenue (Million), by Application 2024 & 2032
- Figure 40: Europe Industrial CT Scanning Industry Volume (K Unit), by Application 2024 & 2032
- Figure 41: Europe Industrial CT Scanning Industry Revenue Share (%), by Application 2024 & 2032
- Figure 42: Europe Industrial CT Scanning Industry Volume Share (%), by Application 2024 & 2032
- Figure 43: Europe Industrial CT Scanning Industry Revenue (Million), by End-user Industry 2024 & 2032
- Figure 44: Europe Industrial CT Scanning Industry Volume (K Unit), by End-user Industry 2024 & 2032
- Figure 45: Europe Industrial CT Scanning Industry Revenue Share (%), by End-user Industry 2024 & 2032
- Figure 46: Europe Industrial CT Scanning Industry Volume Share (%), by End-user Industry 2024 & 2032
- Figure 47: Europe Industrial CT Scanning Industry Revenue (Million), by Country 2024 & 2032
- Figure 48: Europe Industrial CT Scanning Industry Volume (K Unit), by Country 2024 & 2032
- Figure 49: Europe Industrial CT Scanning Industry Revenue Share (%), by Country 2024 & 2032
- Figure 50: Europe Industrial CT Scanning Industry Volume Share (%), by Country 2024 & 2032
- Figure 51: Asia Industrial CT Scanning Industry Revenue (Million), by Application 2024 & 2032
- Figure 52: Asia Industrial CT Scanning Industry Volume (K Unit), by Application 2024 & 2032
- Figure 53: Asia Industrial CT Scanning Industry Revenue Share (%), by Application 2024 & 2032
- Figure 54: Asia Industrial CT Scanning Industry Volume Share (%), by Application 2024 & 2032
- Figure 55: Asia Industrial CT Scanning Industry Revenue (Million), by End-user Industry 2024 & 2032
- Figure 56: Asia Industrial CT Scanning Industry Volume (K Unit), by End-user Industry 2024 & 2032
- Figure 57: Asia Industrial CT Scanning Industry Revenue Share (%), by End-user Industry 2024 & 2032
- Figure 58: Asia Industrial CT Scanning Industry Volume Share (%), by End-user Industry 2024 & 2032
- Figure 59: Asia Industrial CT Scanning Industry Revenue (Million), by Country 2024 & 2032
- Figure 60: Asia Industrial CT Scanning Industry Volume (K Unit), by Country 2024 & 2032
- Figure 61: Asia Industrial CT Scanning Industry Revenue Share (%), by Country 2024 & 2032
- Figure 62: Asia Industrial CT Scanning Industry Volume Share (%), by Country 2024 & 2032
- Figure 63: Australia and New Zealand Industrial CT Scanning Industry Revenue (Million), by Application 2024 & 2032
- Figure 64: Australia and New Zealand Industrial CT Scanning Industry Volume (K Unit), by Application 2024 & 2032
- Figure 65: Australia and New Zealand Industrial CT Scanning Industry Revenue Share (%), by Application 2024 & 2032
- Figure 66: Australia and New Zealand Industrial CT Scanning Industry Volume Share (%), by Application 2024 & 2032
- Figure 67: Australia and New Zealand Industrial CT Scanning Industry Revenue (Million), by End-user Industry 2024 & 2032
- Figure 68: Australia and New Zealand Industrial CT Scanning Industry Volume (K Unit), by End-user Industry 2024 & 2032
- Figure 69: Australia and New Zealand Industrial CT Scanning Industry Revenue Share (%), by End-user Industry 2024 & 2032
- Figure 70: Australia and New Zealand Industrial CT Scanning Industry Volume Share (%), by End-user Industry 2024 & 2032
- Figure 71: Australia and New Zealand Industrial CT Scanning Industry Revenue (Million), by Country 2024 & 2032
- Figure 72: Australia and New Zealand Industrial CT Scanning Industry Volume (K Unit), by Country 2024 & 2032
- Figure 73: Australia and New Zealand Industrial CT Scanning Industry Revenue Share (%), by Country 2024 & 2032
- Figure 74: Australia and New Zealand Industrial CT Scanning Industry Volume Share (%), by Country 2024 & 2032
- Figure 75: Latin America Industrial CT Scanning Industry Revenue (Million), by Application 2024 & 2032
- Figure 76: Latin America Industrial CT Scanning Industry Volume (K Unit), by Application 2024 & 2032
- Figure 77: Latin America Industrial CT Scanning Industry Revenue Share (%), by Application 2024 & 2032
- Figure 78: Latin America Industrial CT Scanning Industry Volume Share (%), by Application 2024 & 2032
- Figure 79: Latin America Industrial CT Scanning Industry Revenue (Million), by End-user Industry 2024 & 2032
- Figure 80: Latin America Industrial CT Scanning Industry Volume (K Unit), by End-user Industry 2024 & 2032
- Figure 81: Latin America Industrial CT Scanning Industry Revenue Share (%), by End-user Industry 2024 & 2032
- Figure 82: Latin America Industrial CT Scanning Industry Volume Share (%), by End-user Industry 2024 & 2032
- Figure 83: Latin America Industrial CT Scanning Industry Revenue (Million), by Country 2024 & 2032
- Figure 84: Latin America Industrial CT Scanning Industry Volume (K Unit), by Country 2024 & 2032
- Figure 85: Latin America Industrial CT Scanning Industry Revenue Share (%), by Country 2024 & 2032
- Figure 86: Latin America Industrial CT Scanning Industry Volume Share (%), by Country 2024 & 2032
- Figure 87: Middle East and Africa Industrial CT Scanning Industry Revenue (Million), by Application 2024 & 2032
- Figure 88: Middle East and Africa Industrial CT Scanning Industry Volume (K Unit), by Application 2024 & 2032
- Figure 89: Middle East and Africa Industrial CT Scanning Industry Revenue Share (%), by Application 2024 & 2032
- Figure 90: Middle East and Africa Industrial CT Scanning Industry Volume Share (%), by Application 2024 & 2032
- Figure 91: Middle East and Africa Industrial CT Scanning Industry Revenue (Million), by End-user Industry 2024 & 2032
- Figure 92: Middle East and Africa Industrial CT Scanning Industry Volume (K Unit), by End-user Industry 2024 & 2032
- Figure 93: Middle East and Africa Industrial CT Scanning Industry Revenue Share (%), by End-user Industry 2024 & 2032
- Figure 94: Middle East and Africa Industrial CT Scanning Industry Volume Share (%), by End-user Industry 2024 & 2032
- Figure 95: Middle East and Africa Industrial CT Scanning Industry Revenue (Million), by Country 2024 & 2032
- Figure 96: Middle East and Africa Industrial CT Scanning Industry Volume (K Unit), by Country 2024 & 2032
- Figure 97: Middle East and Africa Industrial CT Scanning Industry Revenue Share (%), by Country 2024 & 2032
- Figure 98: Middle East and Africa Industrial CT Scanning Industry Volume Share (%), by Country 2024 & 2032
List of Tables
- Table 1: Global Industrial CT Scanning Industry Revenue Million Forecast, by Region 2019 & 2032
- Table 2: Global Industrial CT Scanning Industry Volume K Unit Forecast, by Region 2019 & 2032
- Table 3: Global Industrial CT Scanning Industry Revenue Million Forecast, by Application 2019 & 2032
- Table 4: Global Industrial CT Scanning Industry Volume K Unit Forecast, by Application 2019 & 2032
- Table 5: Global Industrial CT Scanning Industry Revenue Million Forecast, by End-user Industry 2019 & 2032
- Table 6: Global Industrial CT Scanning Industry Volume K Unit Forecast, by End-user Industry 2019 & 2032
- Table 7: Global Industrial CT Scanning Industry Revenue Million Forecast, by Region 2019 & 2032
- Table 8: Global Industrial CT Scanning Industry Volume K Unit Forecast, by Region 2019 & 2032
- Table 9: Global Industrial CT Scanning Industry Revenue Million Forecast, by Country 2019 & 2032
- Table 10: Global Industrial CT Scanning Industry Volume K Unit Forecast, by Country 2019 & 2032
- Table 11: United States Industrial CT Scanning Industry Revenue (Million) Forecast, by Application 2019 & 2032
- Table 12: United States Industrial CT Scanning Industry Volume (K Unit) Forecast, by Application 2019 & 2032
- Table 13: Canada Industrial CT Scanning Industry Revenue (Million) Forecast, by Application 2019 & 2032
- Table 14: Canada Industrial CT Scanning Industry Volume (K Unit) Forecast, by Application 2019 & 2032
- Table 15: Mexico Industrial CT Scanning Industry Revenue (Million) Forecast, by Application 2019 & 2032
- Table 16: Mexico Industrial CT Scanning Industry Volume (K Unit) Forecast, by Application 2019 & 2032
- Table 17: Global Industrial CT Scanning Industry Revenue Million Forecast, by Country 2019 & 2032
- Table 18: Global Industrial CT Scanning Industry Volume K Unit Forecast, by Country 2019 & 2032
- Table 19: Germany Industrial CT Scanning Industry Revenue (Million) Forecast, by Application 2019 & 2032
- Table 20: Germany Industrial CT Scanning Industry Volume (K Unit) Forecast, by Application 2019 & 2032
- Table 21: United Kingdom Industrial CT Scanning Industry Revenue (Million) Forecast, by Application 2019 & 2032
- Table 22: United Kingdom Industrial CT Scanning Industry Volume (K Unit) Forecast, by Application 2019 & 2032
- Table 23: France Industrial CT Scanning Industry Revenue (Million) Forecast, by Application 2019 & 2032
- Table 24: France Industrial CT Scanning Industry Volume (K Unit) Forecast, by Application 2019 & 2032
- Table 25: Spain Industrial CT Scanning Industry Revenue (Million) Forecast, by Application 2019 & 2032
- Table 26: Spain Industrial CT Scanning Industry Volume (K Unit) Forecast, by Application 2019 & 2032
- Table 27: Italy Industrial CT Scanning Industry Revenue (Million) Forecast, by Application 2019 & 2032
- Table 28: Italy Industrial CT Scanning Industry Volume (K Unit) Forecast, by Application 2019 & 2032
- Table 29: Spain Industrial CT Scanning Industry Revenue (Million) Forecast, by Application 2019 & 2032
- Table 30: Spain Industrial CT Scanning Industry Volume (K Unit) Forecast, by Application 2019 & 2032
- Table 31: Belgium Industrial CT Scanning Industry Revenue (Million) Forecast, by Application 2019 & 2032
- Table 32: Belgium Industrial CT Scanning Industry Volume (K Unit) Forecast, by Application 2019 & 2032
- Table 33: Netherland Industrial CT Scanning Industry Revenue (Million) Forecast, by Application 2019 & 2032
- Table 34: Netherland Industrial CT Scanning Industry Volume (K Unit) Forecast, by Application 2019 & 2032
- Table 35: Nordics Industrial CT Scanning Industry Revenue (Million) Forecast, by Application 2019 & 2032
- Table 36: Nordics Industrial CT Scanning Industry Volume (K Unit) Forecast, by Application 2019 & 2032
- Table 37: Rest of Europe Industrial CT Scanning Industry Revenue (Million) Forecast, by Application 2019 & 2032
- Table 38: Rest of Europe Industrial CT Scanning Industry Volume (K Unit) Forecast, by Application 2019 & 2032
- Table 39: Global Industrial CT Scanning Industry Revenue Million Forecast, by Country 2019 & 2032
- Table 40: Global Industrial CT Scanning Industry Volume K Unit Forecast, by Country 2019 & 2032
- Table 41: China Industrial CT Scanning Industry Revenue (Million) Forecast, by Application 2019 & 2032
- Table 42: China Industrial CT Scanning Industry Volume (K Unit) Forecast, by Application 2019 & 2032
- Table 43: Japan Industrial CT Scanning Industry Revenue (Million) Forecast, by Application 2019 & 2032
- Table 44: Japan Industrial CT Scanning Industry Volume (K Unit) Forecast, by Application 2019 & 2032
- Table 45: India Industrial CT Scanning Industry Revenue (Million) Forecast, by Application 2019 & 2032
- Table 46: India Industrial CT Scanning Industry Volume (K Unit) Forecast, by Application 2019 & 2032
- Table 47: South Korea Industrial CT Scanning Industry Revenue (Million) Forecast, by Application 2019 & 2032
- Table 48: South Korea Industrial CT Scanning Industry Volume (K Unit) Forecast, by Application 2019 & 2032
- Table 49: Southeast Asia Industrial CT Scanning Industry Revenue (Million) Forecast, by Application 2019 & 2032
- Table 50: Southeast Asia Industrial CT Scanning Industry Volume (K Unit) Forecast, by Application 2019 & 2032
- Table 51: Australia Industrial CT Scanning Industry Revenue (Million) Forecast, by Application 2019 & 2032
- Table 52: Australia Industrial CT Scanning Industry Volume (K Unit) Forecast, by Application 2019 & 2032
- Table 53: Indonesia Industrial CT Scanning Industry Revenue (Million) Forecast, by Application 2019 & 2032
- Table 54: Indonesia Industrial CT Scanning Industry Volume (K Unit) Forecast, by Application 2019 & 2032
- Table 55: Phillipes Industrial CT Scanning Industry Revenue (Million) Forecast, by Application 2019 & 2032
- Table 56: Phillipes Industrial CT Scanning Industry Volume (K Unit) Forecast, by Application 2019 & 2032
- Table 57: Singapore Industrial CT Scanning Industry Revenue (Million) Forecast, by Application 2019 & 2032
- Table 58: Singapore Industrial CT Scanning Industry Volume (K Unit) Forecast, by Application 2019 & 2032
- Table 59: Thailandc Industrial CT Scanning Industry Revenue (Million) Forecast, by Application 2019 & 2032
- Table 60: Thailandc Industrial CT Scanning Industry Volume (K Unit) Forecast, by Application 2019 & 2032
- Table 61: Rest of Asia Pacific Industrial CT Scanning Industry Revenue (Million) Forecast, by Application 2019 & 2032
- Table 62: Rest of Asia Pacific Industrial CT Scanning Industry Volume (K Unit) Forecast, by Application 2019 & 2032
- Table 63: Global Industrial CT Scanning Industry Revenue Million Forecast, by Country 2019 & 2032
- Table 64: Global Industrial CT Scanning Industry Volume K Unit Forecast, by Country 2019 & 2032
- Table 65: Brazil Industrial CT Scanning Industry Revenue (Million) Forecast, by Application 2019 & 2032
- Table 66: Brazil Industrial CT Scanning Industry Volume (K Unit) Forecast, by Application 2019 & 2032
- Table 67: Argentina Industrial CT Scanning Industry Revenue (Million) Forecast, by Application 2019 & 2032
- Table 68: Argentina Industrial CT Scanning Industry Volume (K Unit) Forecast, by Application 2019 & 2032
- Table 69: Peru Industrial CT Scanning Industry Revenue (Million) Forecast, by Application 2019 & 2032
- Table 70: Peru Industrial CT Scanning Industry Volume (K Unit) Forecast, by Application 2019 & 2032
- Table 71: Chile Industrial CT Scanning Industry Revenue (Million) Forecast, by Application 2019 & 2032
- Table 72: Chile Industrial CT Scanning Industry Volume (K Unit) Forecast, by Application 2019 & 2032
- Table 73: Colombia Industrial CT Scanning Industry Revenue (Million) Forecast, by Application 2019 & 2032
- Table 74: Colombia Industrial CT Scanning Industry Volume (K Unit) Forecast, by Application 2019 & 2032
- Table 75: Ecuador Industrial CT Scanning Industry Revenue (Million) Forecast, by Application 2019 & 2032
- Table 76: Ecuador Industrial CT Scanning Industry Volume (K Unit) Forecast, by Application 2019 & 2032
- Table 77: Venezuela Industrial CT Scanning Industry Revenue (Million) Forecast, by Application 2019 & 2032
- Table 78: Venezuela Industrial CT Scanning Industry Volume (K Unit) Forecast, by Application 2019 & 2032
- Table 79: Rest of South America Industrial CT Scanning Industry Revenue (Million) Forecast, by Application 2019 & 2032
- Table 80: Rest of South America Industrial CT Scanning Industry Volume (K Unit) Forecast, by Application 2019 & 2032
- Table 81: Global Industrial CT Scanning Industry Revenue Million Forecast, by Country 2019 & 2032
- Table 82: Global Industrial CT Scanning Industry Volume K Unit Forecast, by Country 2019 & 2032
- Table 83: United States Industrial CT Scanning Industry Revenue (Million) Forecast, by Application 2019 & 2032
- Table 84: United States Industrial CT Scanning Industry Volume (K Unit) Forecast, by Application 2019 & 2032
- Table 85: Canada Industrial CT Scanning Industry Revenue (Million) Forecast, by Application 2019 & 2032
- Table 86: Canada Industrial CT Scanning Industry Volume (K Unit) Forecast, by Application 2019 & 2032
- Table 87: Mexico Industrial CT Scanning Industry Revenue (Million) Forecast, by Application 2019 & 2032
- Table 88: Mexico Industrial CT Scanning Industry Volume (K Unit) Forecast, by Application 2019 & 2032
- Table 89: Global Industrial CT Scanning Industry Revenue Million Forecast, by Country 2019 & 2032
- Table 90: Global Industrial CT Scanning Industry Volume K Unit Forecast, by Country 2019 & 2032
- Table 91: United Arab Emirates Industrial CT Scanning Industry Revenue (Million) Forecast, by Application 2019 & 2032
- Table 92: United Arab Emirates Industrial CT Scanning Industry Volume (K Unit) Forecast, by Application 2019 & 2032
- Table 93: Saudi Arabia Industrial CT Scanning Industry Revenue (Million) Forecast, by Application 2019 & 2032
- Table 94: Saudi Arabia Industrial CT Scanning Industry Volume (K Unit) Forecast, by Application 2019 & 2032
- Table 95: South Africa Industrial CT Scanning Industry Revenue (Million) Forecast, by Application 2019 & 2032
- Table 96: South Africa Industrial CT Scanning Industry Volume (K Unit) Forecast, by Application 2019 & 2032
- Table 97: Rest of Middle East and Africa Industrial CT Scanning Industry Revenue (Million) Forecast, by Application 2019 & 2032
- Table 98: Rest of Middle East and Africa Industrial CT Scanning Industry Volume (K Unit) Forecast, by Application 2019 & 2032
- Table 99: Global Industrial CT Scanning Industry Revenue Million Forecast, by Application 2019 & 2032
- Table 100: Global Industrial CT Scanning Industry Volume K Unit Forecast, by Application 2019 & 2032
- Table 101: Global Industrial CT Scanning Industry Revenue Million Forecast, by End-user Industry 2019 & 2032
- Table 102: Global Industrial CT Scanning Industry Volume K Unit Forecast, by End-user Industry 2019 & 2032
- Table 103: Global Industrial CT Scanning Industry Revenue Million Forecast, by Country 2019 & 2032
- Table 104: Global Industrial CT Scanning Industry Volume K Unit Forecast, by Country 2019 & 2032
- Table 105: Global Industrial CT Scanning Industry Revenue Million Forecast, by Application 2019 & 2032
- Table 106: Global Industrial CT Scanning Industry Volume K Unit Forecast, by Application 2019 & 2032
- Table 107: Global Industrial CT Scanning Industry Revenue Million Forecast, by End-user Industry 2019 & 2032
- Table 108: Global Industrial CT Scanning Industry Volume K Unit Forecast, by End-user Industry 2019 & 2032
- Table 109: Global Industrial CT Scanning Industry Revenue Million Forecast, by Country 2019 & 2032
- Table 110: Global Industrial CT Scanning Industry Volume K Unit Forecast, by Country 2019 & 2032
- Table 111: Global Industrial CT Scanning Industry Revenue Million Forecast, by Application 2019 & 2032
- Table 112: Global Industrial CT Scanning Industry Volume K Unit Forecast, by Application 2019 & 2032
- Table 113: Global Industrial CT Scanning Industry Revenue Million Forecast, by End-user Industry 2019 & 2032
- Table 114: Global Industrial CT Scanning Industry Volume K Unit Forecast, by End-user Industry 2019 & 2032
- Table 115: Global Industrial CT Scanning Industry Revenue Million Forecast, by Country 2019 & 2032
- Table 116: Global Industrial CT Scanning Industry Volume K Unit Forecast, by Country 2019 & 2032
- Table 117: Global Industrial CT Scanning Industry Revenue Million Forecast, by Application 2019 & 2032
- Table 118: Global Industrial CT Scanning Industry Volume K Unit Forecast, by Application 2019 & 2032
- Table 119: Global Industrial CT Scanning Industry Revenue Million Forecast, by End-user Industry 2019 & 2032
- Table 120: Global Industrial CT Scanning Industry Volume K Unit Forecast, by End-user Industry 2019 & 2032
- Table 121: Global Industrial CT Scanning Industry Revenue Million Forecast, by Country 2019 & 2032
- Table 122: Global Industrial CT Scanning Industry Volume K Unit Forecast, by Country 2019 & 2032
- Table 123: Global Industrial CT Scanning Industry Revenue Million Forecast, by Application 2019 & 2032
- Table 124: Global Industrial CT Scanning Industry Volume K Unit Forecast, by Application 2019 & 2032
- Table 125: Global Industrial CT Scanning Industry Revenue Million Forecast, by End-user Industry 2019 & 2032
- Table 126: Global Industrial CT Scanning Industry Volume K Unit Forecast, by End-user Industry 2019 & 2032
- Table 127: Global Industrial CT Scanning Industry Revenue Million Forecast, by Country 2019 & 2032
- Table 128: Global Industrial CT Scanning Industry Volume K Unit Forecast, by Country 2019 & 2032
- Table 129: Global Industrial CT Scanning Industry Revenue Million Forecast, by Application 2019 & 2032
- Table 130: Global Industrial CT Scanning Industry Volume K Unit Forecast, by Application 2019 & 2032
- Table 131: Global Industrial CT Scanning Industry Revenue Million Forecast, by End-user Industry 2019 & 2032
- Table 132: Global Industrial CT Scanning Industry Volume K Unit Forecast, by End-user Industry 2019 & 2032
- Table 133: Global Industrial CT Scanning Industry Revenue Million Forecast, by Country 2019 & 2032
- Table 134: Global Industrial CT Scanning Industry Volume K Unit Forecast, by Country 2019 & 2032
Frequently Asked Questions
1. What is the projected Compound Annual Growth Rate (CAGR) of the Industrial CT Scanning Industry?
The projected CAGR is approximately 9.03%.
2. Which companies are prominent players in the Industrial CT Scanning Industry?
Key companies in the market include Comet Group Limited, Nikon Corporation, Thermo Fisher Scientific Inc, Hitachi Ltd, 3DX-Ray Limited, Zeiss International, Omron Corporation, Waygate Technologies, Bruker Corporation, Shimadzu Corporation.
3. What are the main segments of the Industrial CT Scanning Industry?
The market segments include Application, End-user Industry.
4. Can you provide details about the market size?
The market size is estimated to be USD 502.00 Million as of 2022.
5. What are some drivers contributing to market growth?
Technology Improvements in Resolution and Image Processing; Intensifying Demand for Portable Radiography Equipment.
6. What are the notable trends driving market growth?
Aerospace Industry to Drive the Industrial Computed Tomography Market.
7. Are there any restraints impacting market growth?
High Acquisition and Maintenace Cost of Industrial CT systems.
8. Can you provide examples of recent developments in the market?
March 2021 - ZEISS introduced ZEISS Xradia CrystalCT micro-computed tomography (microCT) system to enable 3D crystallographic imaging of polycrystalline materials for a wide range of metal and alloy, additive manufacturing, ceramic, and pharmaceutical samples in industrial and academic laboratories.
9. What pricing options are available for accessing the report?
Pricing options include single-user, multi-user, and enterprise licenses priced at USD 4750, USD 5250, and USD 8750 respectively.
10. Is the market size provided in terms of value or volume?
The market size is provided in terms of value, measured in Million and volume, measured in K Unit.
11. Are there any specific market keywords associated with the report?
Yes, the market keyword associated with the report is "Industrial CT Scanning Industry," which aids in identifying and referencing the specific market segment covered.
12. How do I determine which pricing option suits my needs best?
The pricing options vary based on user requirements and access needs. Individual users may opt for single-user licenses, while businesses requiring broader access may choose multi-user or enterprise licenses for cost-effective access to the report.
13. Are there any additional resources or data provided in the Industrial CT Scanning Industry report?
While the report offers comprehensive insights, it's advisable to review the specific contents or supplementary materials provided to ascertain if additional resources or data are available.
14. How can I stay updated on further developments or reports in the Industrial CT Scanning Industry?
To stay informed about further developments, trends, and reports in the Industrial CT Scanning Industry, consider subscribing to industry newsletters, following relevant companies and organizations, or regularly checking reputable industry news sources and publications.
Methodology
Step 1 - Identification of Relevant Samples Size from Population Database


Step 2 - Approaches for Defining Global Market Size (Value, Volume* & Price*)

Note*: In applicable scenarios
Step 3 - Data Sources
Primary Research
- Web Analytics
- Survey Reports
- Research Institute
- Latest Research Reports
- Opinion Leaders
Secondary Research
- Annual Reports
- White Paper
- Latest Press Release
- Industry Association
- Paid Database
- Investor Presentations

Step 4 - Data Triangulation
Involves using different sources of information in order to increase the validity of a study
These sources are likely to be stakeholders in a program - participants, other researchers, program staff, other community members, and so on.
Then we put all data in single framework & apply various statistical tools to find out the dynamic on the market.
During the analysis stage, feedback from the stakeholder groups would be compared to determine areas of agreement as well as areas of divergence
