

Key Insights
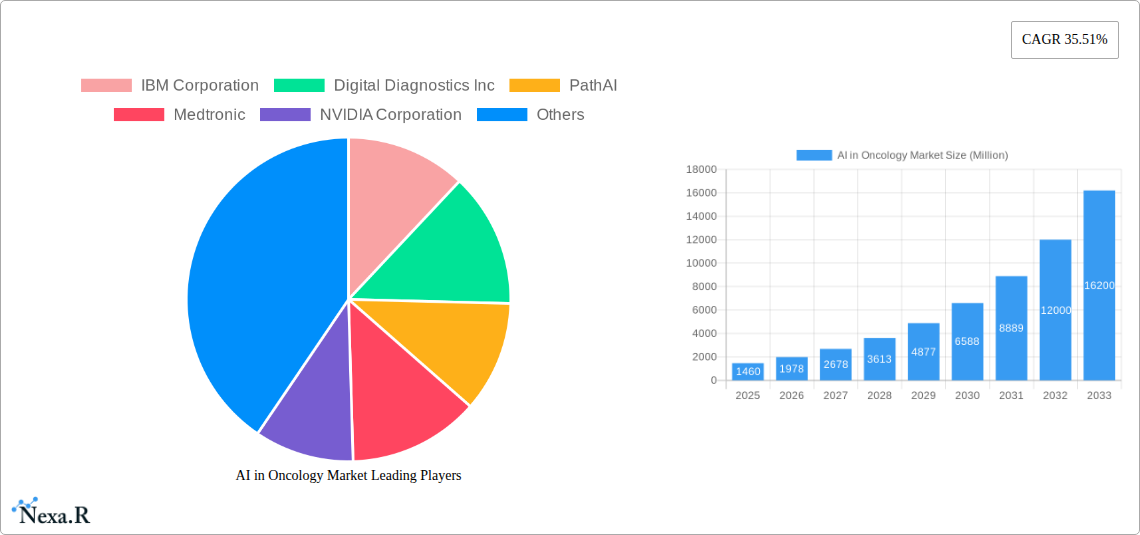
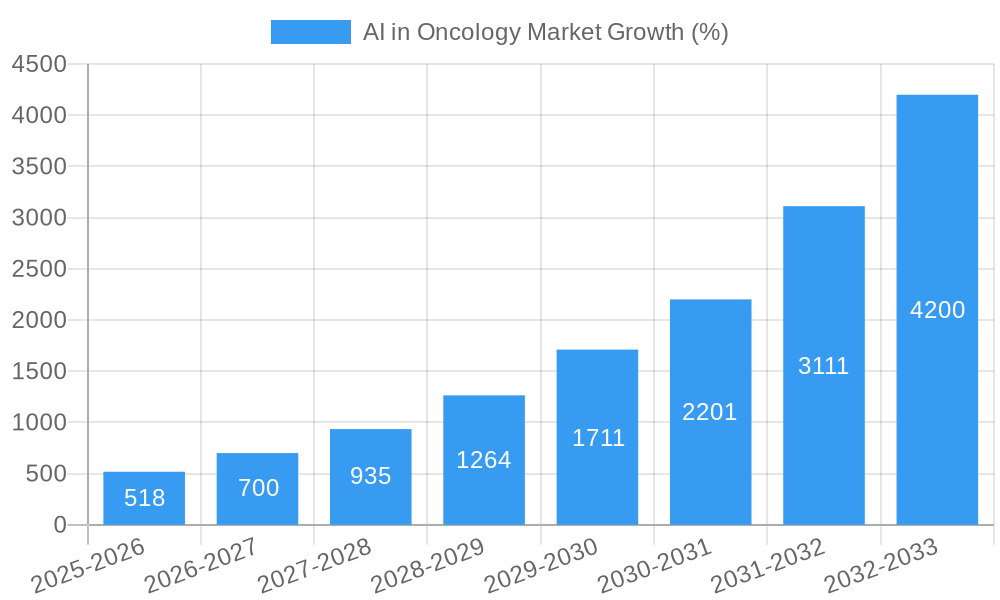
The AI in Oncology market is experiencing explosive growth, projected to reach $1.46 billion in 2025 and exhibiting a remarkable Compound Annual Growth Rate (CAGR) of 35.51% from 2025 to 2033. This surge is driven by several key factors. Firstly, the increasing prevalence of cancer globally fuels the demand for advanced diagnostic and treatment tools. AI offers significant advantages in image analysis for early and accurate cancer detection, leading to improved patient outcomes and reduced mortality rates. Secondly, the complexity of cancer treatment necessitates personalized approaches. AI algorithms can analyze vast datasets of patient information, including genomic data and medical history, enabling oncologists to tailor treatment plans to individual needs, optimizing efficacy and minimizing side effects. Furthermore, AI accelerates drug discovery and development processes, significantly reducing the time and cost associated with bringing new therapies to market. The market is segmented across various components (software, hardware, and services), cancer types (breast, lung, prostate, colorectal, brain, and others), treatment types (chemotherapy, radiotherapy, immunotherapy, and others), and applications (cancer detection, drug discovery, and development). The leading players, including IBM, NVIDIA, GE Healthcare, and others, are actively investing in research and development, driving innovation and market expansion.
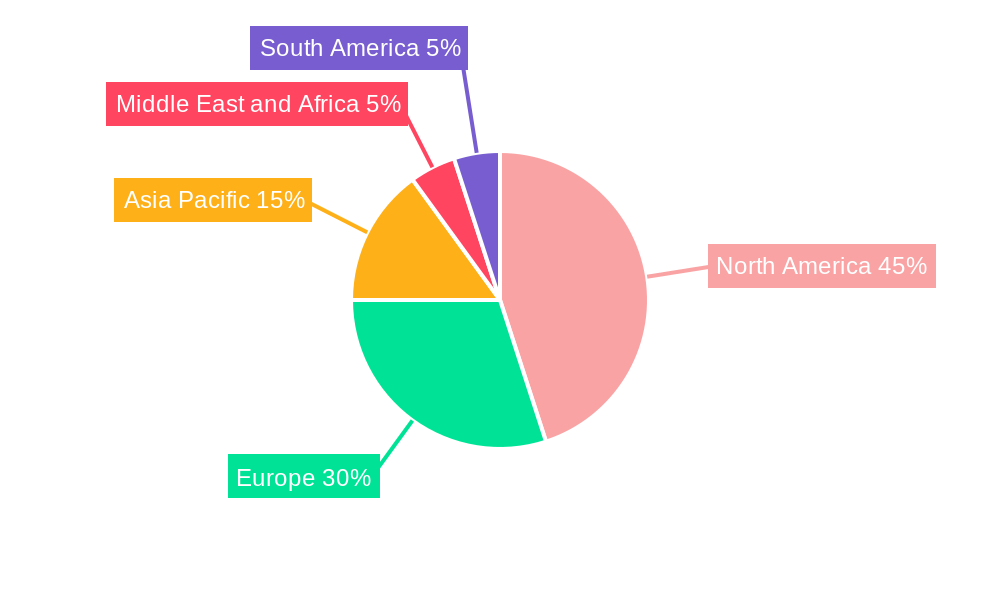
The market's growth is further fueled by technological advancements in AI, particularly deep learning and machine learning. These technologies enable the development of sophisticated algorithms capable of analyzing complex medical images, predicting treatment response, and identifying potential drug targets. However, challenges remain, such as the need for robust data infrastructure to support AI algorithms, concerns around data privacy and security, and the regulatory hurdles associated with adopting AI-driven solutions in healthcare. Nevertheless, the potential benefits of AI in oncology are substantial, promising to revolutionize cancer care and improve patient lives. The North American market currently holds a significant share, but rapid growth is anticipated in the Asia-Pacific region, driven by increasing healthcare investment and technological advancements. The forecast period of 2025-2033 indicates substantial continued market expansion, driven by ongoing technological developments and the ever-increasing need for improved cancer diagnosis and treatment.
AI in Oncology Market: A Comprehensive Report (2019-2033)
This comprehensive report provides a detailed analysis of the AI in Oncology market, encompassing market dynamics, growth trends, regional segmentation, product landscape, key players, and future outlook. With a study period spanning 2019-2033, a base year of 2025, and a forecast period of 2025-2033, this report offers invaluable insights for industry professionals, investors, and researchers. The report delves into parent markets (Oncology Market) and child markets (AI-powered Oncology solutions within specific cancer types and treatment modalities) to provide a holistic view. The total market size in 2025 is estimated at xx Million, projected to reach xx Million by 2033.
AI in Oncology Market Market Dynamics & Structure
The AI in Oncology market is characterized by a moderately concentrated structure, with a few major players holding significant market share. Technological innovation, particularly in deep learning and computer vision, is a primary growth driver. Stringent regulatory frameworks, especially concerning data privacy and algorithm validation, pose both challenges and opportunities. The market faces competition from traditional diagnostic and therapeutic methods, but AI solutions offer the potential for improved accuracy, efficiency, and personalized treatment. End-user demographics include hospitals, clinics, research institutions, and pharmaceutical companies. Mergers and acquisitions (M&A) activity is steadily increasing, with larger companies acquiring smaller AI startups to expand their capabilities. In the historical period (2019-2024), xx M&A deals were recorded, indicating a growing trend.
- Market Concentration: Moderately concentrated, with top 5 players holding approximately xx% market share in 2025.
- Technological Innovation: Deep learning, computer vision, natural language processing driving advancements.
- Regulatory Landscape: Stringent regulations concerning data privacy and algorithm validation.
- Competitive Landscape: Traditional methods and new AI solutions coexisting, leading to increased competition.
- M&A Activity: Significant increase in M&A activity, suggesting industry consolidation.
AI in Oncology Market Growth Trends & Insights
The AI in Oncology market is experiencing robust growth, driven by the increasing prevalence of cancer, rising demand for personalized medicine, and technological advancements. The market size exhibited a CAGR of xx% during the historical period (2019-2024) and is projected to maintain a CAGR of xx% during the forecast period (2025-2033). Market penetration of AI-powered solutions is increasing across various cancer types and treatment modalities. Technological disruptions, such as the development of more sophisticated algorithms and improved data analytics capabilities, are accelerating adoption. Consumer behavior is shifting towards a preference for personalized and data-driven cancer care, further fueling market growth. Early detection capabilities and improved treatment outcomes are major factors influencing adoption rates.
Dominant Regions, Countries, or Segments in AI in Oncology Market
North America currently dominates the AI in Oncology market, owing to robust healthcare infrastructure, high adoption of advanced technologies, and substantial investments in R&D. Within North America, the United States holds the largest market share. However, Asia-Pacific is expected to witness the fastest growth rate over the forecast period driven by increasing healthcare expenditure and rising cancer incidence.
Leading Segments:
- Component: Software solutions currently hold the largest market share (xx%), followed by services (xx%) and hardware (xx%). Software is expected to maintain its leading position due to increasing demand for AI-powered diagnostic and treatment planning tools.
- Cancer Type: Breast cancer, lung cancer, and colorectal cancer currently represent the largest segments in terms of AI applications.
- Treatment Type: Applications in Chemotherapy and Radiotherapy are dominant, with a projected increase in Immunotherapy applications.
- Application: Cancer detection is the dominant application, followed by drug discovery and drug development.
AI in Oncology Market Product Landscape
The AI in Oncology market offers a diverse range of products, including software solutions for image analysis, diagnostic assistance, and treatment planning; hardware such as high-performance computing systems and specialized imaging equipment; and services encompassing data analytics, algorithm development, and implementation support. Key technological advancements include the development of deep learning models capable of identifying subtle patterns in medical images, natural language processing tools for analyzing patient records and clinical trials data, and AI-driven drug discovery platforms for accelerating the development of new cancer therapies. Unique selling propositions often center on improved accuracy, reduced turnaround time, and personalized treatment recommendations.
Key Drivers, Barriers & Challenges in AI in Oncology Market
Key Drivers:
- The rising prevalence of cancer globally.
- Increasing demand for personalized medicine.
- Technological advancements in AI and machine learning.
- Growing investments in research and development.
- Favorable regulatory environment in some regions.
Key Challenges:
- High cost of AI-powered solutions.
- Data privacy concerns and regulatory hurdles.
- Lack of standardized data formats and interoperability issues.
- Limited clinical validation data for some AI algorithms.
- Skilled workforce shortage in the field.
Emerging Opportunities in AI in Oncology Market
- Liquid biopsy analysis: AI is enhancing the analysis of blood samples to detect circulating tumor DNA (ctDNA) for early cancer detection and personalized treatment.
- AI-powered robotic surgery: AI is increasing precision and reducing invasiveness in surgical oncology procedures.
- Expansion into emerging markets: Significant growth potential exists in countries with high cancer incidence rates and developing healthcare infrastructure.
- Development of novel AI algorithms: Continued innovation is expected to improve the accuracy, sensitivity, and specificity of existing AI-powered tools.
Growth Accelerators in the AI in Oncology Market Industry
Strategic partnerships between technology companies, healthcare providers, and pharmaceutical firms are driving growth by combining expertise and resources. Technological advancements, particularly in deep learning and computer vision, continue to enhance the capabilities of AI-powered tools. The increasing adoption of cloud computing is facilitating data sharing and collaboration, further accelerating market expansion.
Key Players Shaping the AI in Oncology Market Market
- IBM Corporation
- Digital Diagnostics Inc
- PathAI
- Medtronic
- NVIDIA Corporation
- GE Healthcare
- Siemens Healthineers AG
- Azra AI
- Median Technologies Inc
- Intel Corporation
- ConcertAI LLC
Notable Milestones in AI in Oncology Market Sector
- September 2021: Owkin, Inc. announced a deep-learning model predicting survival outcomes for hepatocellular carcinoma.
- August 2022: Medtronic launched the AI-powered GI Genius intelligent endoscopy module in India for colorectal cancer detection.
In-Depth AI in Oncology Market Market Outlook
The AI in Oncology market is poised for continued strong growth, driven by technological advancements, increasing demand for personalized medicine, and rising investments in R&D. Strategic partnerships, expansion into emerging markets, and the development of novel AI algorithms present significant opportunities for market players. The focus on improved accuracy, reduced cost, and increased accessibility of AI-powered solutions will further drive market expansion in the coming years.
AI in Oncology Market Segmentation
-
1. Component
- 1.1. Software Solutions
- 1.2. Hardware
- 1.3. Services
-
2. Cancer Type
- 2.1. Breast Cancer
- 2.2. Lung Cancer
- 2.3. Prostate Cancer
- 2.4. Colorectal Cancer
- 2.5. Brain Tumor
- 2.6. Other Cancer Types
-
3. Treatment Type
- 3.1. Chemotherapy
- 3.2. Radiotherapy
- 3.3. Immunotherapy
- 3.4. Other Treatment Types
-
4. Application
- 4.1. Cancer Detection
- 4.2. Drug Discovery
- 4.3. Drug Development
- 4.4. Other Applications
AI in Oncology Market Segmentation By Geography
-
1. North America
- 1.1. United States
- 1.2. Canada
- 1.3. Mexico
-
2. Europe
- 2.1. Germany
- 2.2. United Kingdom
- 2.3. France
- 2.4. Italy
- 2.5. Spain
- 2.6. Rest of Europe
-
3. Asia Pacific
- 3.1. China
- 3.2. Japan
- 3.3. India
- 3.4. Australia
- 3.5. South Korea
- 3.6. Rest of Asia Pacific
-
4. Middle East and Africa
- 4.1. GCC
- 4.2. South Africa
- 4.3. Rest of Middle East and Africa
-
5. South America
- 5.1. Brazil
- 5.2. Argentina
- 5.3. Rest of South America
AI in Oncology Market REPORT HIGHLIGHTS
| Aspects | Details |
|---|---|
| Study Period | 2019-2033 |
| Base Year | 2024 |
| Estimated Year | 2025 |
| Forecast Period | 2025-2033 |
| Historical Period | 2019-2024 |
| Growth Rate | CAGR of 35.51% from 2019-2033 |
| Segmentation |
|
Table of Contents
- 1. Introduction
- 1.1. Research Scope
- 1.2. Market Segmentation
- 1.3. Research Methodology
- 1.4. Definitions and Assumptions
- 2. Executive Summary
- 2.1. Introduction
- 3. Market Dynamics
- 3.1. Introduction
- 3.2. Market Drivers
- 3.2.1. Surging Advancements in Healthcare Infrastructure; Increasing Prevalence of Cancer; Rising Demand for Early and Accurate Diagnosis of Cancer
- 3.3. Market Restrains
- 3.3.1. High Initial Costs and Concerns over the Replacement of Human Workforce
- 3.4. Market Trends
- 3.4.1. Chemotherapy Segment is Expected to Have a Highest Growth Rate in the Forecast Period
- 4. Market Factor Analysis
- 4.1. Porters Five Forces
- 4.2. Supply/Value Chain
- 4.3. PESTEL analysis
- 4.4. Market Entropy
- 4.5. Patent/Trademark Analysis
- 5. Global AI in Oncology Market Analysis, Insights and Forecast, 2019-2031
- 5.1. Market Analysis, Insights and Forecast - by Component
- 5.1.1. Software Solutions
- 5.1.2. Hardware
- 5.1.3. Services
- 5.2. Market Analysis, Insights and Forecast - by Cancer Type
- 5.2.1. Breast Cancer
- 5.2.2. Lung Cancer
- 5.2.3. Prostate Cancer
- 5.2.4. Colorectal Cancer
- 5.2.5. Brain Tumor
- 5.2.6. Other Cancer Types
- 5.3. Market Analysis, Insights and Forecast - by Treatment Type
- 5.3.1. Chemotherapy
- 5.3.2. Radiotherapy
- 5.3.3. Immunotherapy
- 5.3.4. Other Treatment Types
- 5.4. Market Analysis, Insights and Forecast - by Application
- 5.4.1. Cancer Detection
- 5.4.2. Drug Discovery
- 5.4.3. Drug Development
- 5.4.4. Other Applications
- 5.5. Market Analysis, Insights and Forecast - by Region
- 5.5.1. North America
- 5.5.2. Europe
- 5.5.3. Asia Pacific
- 5.5.4. Middle East and Africa
- 5.5.5. South America
- 5.1. Market Analysis, Insights and Forecast - by Component
- 6. North America AI in Oncology Market Analysis, Insights and Forecast, 2019-2031
- 6.1. Market Analysis, Insights and Forecast - by Component
- 6.1.1. Software Solutions
- 6.1.2. Hardware
- 6.1.3. Services
- 6.2. Market Analysis, Insights and Forecast - by Cancer Type
- 6.2.1. Breast Cancer
- 6.2.2. Lung Cancer
- 6.2.3. Prostate Cancer
- 6.2.4. Colorectal Cancer
- 6.2.5. Brain Tumor
- 6.2.6. Other Cancer Types
- 6.3. Market Analysis, Insights and Forecast - by Treatment Type
- 6.3.1. Chemotherapy
- 6.3.2. Radiotherapy
- 6.3.3. Immunotherapy
- 6.3.4. Other Treatment Types
- 6.4. Market Analysis, Insights and Forecast - by Application
- 6.4.1. Cancer Detection
- 6.4.2. Drug Discovery
- 6.4.3. Drug Development
- 6.4.4. Other Applications
- 6.1. Market Analysis, Insights and Forecast - by Component
- 7. Europe AI in Oncology Market Analysis, Insights and Forecast, 2019-2031
- 7.1. Market Analysis, Insights and Forecast - by Component
- 7.1.1. Software Solutions
- 7.1.2. Hardware
- 7.1.3. Services
- 7.2. Market Analysis, Insights and Forecast - by Cancer Type
- 7.2.1. Breast Cancer
- 7.2.2. Lung Cancer
- 7.2.3. Prostate Cancer
- 7.2.4. Colorectal Cancer
- 7.2.5. Brain Tumor
- 7.2.6. Other Cancer Types
- 7.3. Market Analysis, Insights and Forecast - by Treatment Type
- 7.3.1. Chemotherapy
- 7.3.2. Radiotherapy
- 7.3.3. Immunotherapy
- 7.3.4. Other Treatment Types
- 7.4. Market Analysis, Insights and Forecast - by Application
- 7.4.1. Cancer Detection
- 7.4.2. Drug Discovery
- 7.4.3. Drug Development
- 7.4.4. Other Applications
- 7.1. Market Analysis, Insights and Forecast - by Component
- 8. Asia Pacific AI in Oncology Market Analysis, Insights and Forecast, 2019-2031
- 8.1. Market Analysis, Insights and Forecast - by Component
- 8.1.1. Software Solutions
- 8.1.2. Hardware
- 8.1.3. Services
- 8.2. Market Analysis, Insights and Forecast - by Cancer Type
- 8.2.1. Breast Cancer
- 8.2.2. Lung Cancer
- 8.2.3. Prostate Cancer
- 8.2.4. Colorectal Cancer
- 8.2.5. Brain Tumor
- 8.2.6. Other Cancer Types
- 8.3. Market Analysis, Insights and Forecast - by Treatment Type
- 8.3.1. Chemotherapy
- 8.3.2. Radiotherapy
- 8.3.3. Immunotherapy
- 8.3.4. Other Treatment Types
- 8.4. Market Analysis, Insights and Forecast - by Application
- 8.4.1. Cancer Detection
- 8.4.2. Drug Discovery
- 8.4.3. Drug Development
- 8.4.4. Other Applications
- 8.1. Market Analysis, Insights and Forecast - by Component
- 9. Middle East and Africa AI in Oncology Market Analysis, Insights and Forecast, 2019-2031
- 9.1. Market Analysis, Insights and Forecast - by Component
- 9.1.1. Software Solutions
- 9.1.2. Hardware
- 9.1.3. Services
- 9.2. Market Analysis, Insights and Forecast - by Cancer Type
- 9.2.1. Breast Cancer
- 9.2.2. Lung Cancer
- 9.2.3. Prostate Cancer
- 9.2.4. Colorectal Cancer
- 9.2.5. Brain Tumor
- 9.2.6. Other Cancer Types
- 9.3. Market Analysis, Insights and Forecast - by Treatment Type
- 9.3.1. Chemotherapy
- 9.3.2. Radiotherapy
- 9.3.3. Immunotherapy
- 9.3.4. Other Treatment Types
- 9.4. Market Analysis, Insights and Forecast - by Application
- 9.4.1. Cancer Detection
- 9.4.2. Drug Discovery
- 9.4.3. Drug Development
- 9.4.4. Other Applications
- 9.1. Market Analysis, Insights and Forecast - by Component
- 10. South America AI in Oncology Market Analysis, Insights and Forecast, 2019-2031
- 10.1. Market Analysis, Insights and Forecast - by Component
- 10.1.1. Software Solutions
- 10.1.2. Hardware
- 10.1.3. Services
- 10.2. Market Analysis, Insights and Forecast - by Cancer Type
- 10.2.1. Breast Cancer
- 10.2.2. Lung Cancer
- 10.2.3. Prostate Cancer
- 10.2.4. Colorectal Cancer
- 10.2.5. Brain Tumor
- 10.2.6. Other Cancer Types
- 10.3. Market Analysis, Insights and Forecast - by Treatment Type
- 10.3.1. Chemotherapy
- 10.3.2. Radiotherapy
- 10.3.3. Immunotherapy
- 10.3.4. Other Treatment Types
- 10.4. Market Analysis, Insights and Forecast - by Application
- 10.4.1. Cancer Detection
- 10.4.2. Drug Discovery
- 10.4.3. Drug Development
- 10.4.4. Other Applications
- 10.1. Market Analysis, Insights and Forecast - by Component
- 11. North America AI in Oncology Market Analysis, Insights and Forecast, 2019-2031
- 11.1. Market Analysis, Insights and Forecast - By Country/Sub-region
- 11.1.1. undefined
- 12. Europe AI in Oncology Market Analysis, Insights and Forecast, 2019-2031
- 12.1. Market Analysis, Insights and Forecast - By Country/Sub-region
- 12.1.1. undefined
- 13. Asia Pacific AI in Oncology Market Analysis, Insights and Forecast, 2019-2031
- 13.1. Market Analysis, Insights and Forecast - By Country/Sub-region
- 13.1.1. undefined
- 14. Middle East and Africa AI in Oncology Market Analysis, Insights and Forecast, 2019-2031
- 14.1. Market Analysis, Insights and Forecast - By Country/Sub-region
- 14.1.1. undefined
- 15. South America AI in Oncology Market Analysis, Insights and Forecast, 2019-2031
- 15.1. Market Analysis, Insights and Forecast - By Country/Sub-region
- 15.1.1. undefined
- 16. Competitive Analysis
- 16.1. Global Market Share Analysis 2024
- 16.2. Company Profiles
- 16.2.1 IBM Corporation
- 16.2.1.1. Overview
- 16.2.1.2. Products
- 16.2.1.3. SWOT Analysis
- 16.2.1.4. Recent Developments
- 16.2.1.5. Financials (Based on Availability)
- 16.2.2 Digital Diagnostics Inc
- 16.2.2.1. Overview
- 16.2.2.2. Products
- 16.2.2.3. SWOT Analysis
- 16.2.2.4. Recent Developments
- 16.2.2.5. Financials (Based on Availability)
- 16.2.3 PathAI
- 16.2.3.1. Overview
- 16.2.3.2. Products
- 16.2.3.3. SWOT Analysis
- 16.2.3.4. Recent Developments
- 16.2.3.5. Financials (Based on Availability)
- 16.2.4 Medtronic
- 16.2.4.1. Overview
- 16.2.4.2. Products
- 16.2.4.3. SWOT Analysis
- 16.2.4.4. Recent Developments
- 16.2.4.5. Financials (Based on Availability)
- 16.2.5 NVIDIA Corporation
- 16.2.5.1. Overview
- 16.2.5.2. Products
- 16.2.5.3. SWOT Analysis
- 16.2.5.4. Recent Developments
- 16.2.5.5. Financials (Based on Availability)
- 16.2.6 GE Healthcare
- 16.2.6.1. Overview
- 16.2.6.2. Products
- 16.2.6.3. SWOT Analysis
- 16.2.6.4. Recent Developments
- 16.2.6.5. Financials (Based on Availability)
- 16.2.7 Siemens Healthineers AG
- 16.2.7.1. Overview
- 16.2.7.2. Products
- 16.2.7.3. SWOT Analysis
- 16.2.7.4. Recent Developments
- 16.2.7.5. Financials (Based on Availability)
- 16.2.8 Azra AI
- 16.2.8.1. Overview
- 16.2.8.2. Products
- 16.2.8.3. SWOT Analysis
- 16.2.8.4. Recent Developments
- 16.2.8.5. Financials (Based on Availability)
- 16.2.9 Median Technologies Inc
- 16.2.9.1. Overview
- 16.2.9.2. Products
- 16.2.9.3. SWOT Analysis
- 16.2.9.4. Recent Developments
- 16.2.9.5. Financials (Based on Availability)
- 16.2.10 Intel Corporation
- 16.2.10.1. Overview
- 16.2.10.2. Products
- 16.2.10.3. SWOT Analysis
- 16.2.10.4. Recent Developments
- 16.2.10.5. Financials (Based on Availability)
- 16.2.11 ConcertAI LLC
- 16.2.11.1. Overview
- 16.2.11.2. Products
- 16.2.11.3. SWOT Analysis
- 16.2.11.4. Recent Developments
- 16.2.11.5. Financials (Based on Availability)
- 16.2.1 IBM Corporation
List of Figures
- Figure 1: Global AI in Oncology Market Revenue Breakdown (Million, %) by Region 2024 & 2032
- Figure 2: Global AI in Oncology Market Volume Breakdown (K Unit, %) by Region 2024 & 2032
- Figure 3: North America AI in Oncology Market Revenue (Million), by Country 2024 & 2032
- Figure 4: North America AI in Oncology Market Volume (K Unit), by Country 2024 & 2032
- Figure 5: North America AI in Oncology Market Revenue Share (%), by Country 2024 & 2032
- Figure 6: North America AI in Oncology Market Volume Share (%), by Country 2024 & 2032
- Figure 7: Europe AI in Oncology Market Revenue (Million), by Country 2024 & 2032
- Figure 8: Europe AI in Oncology Market Volume (K Unit), by Country 2024 & 2032
- Figure 9: Europe AI in Oncology Market Revenue Share (%), by Country 2024 & 2032
- Figure 10: Europe AI in Oncology Market Volume Share (%), by Country 2024 & 2032
- Figure 11: Asia Pacific AI in Oncology Market Revenue (Million), by Country 2024 & 2032
- Figure 12: Asia Pacific AI in Oncology Market Volume (K Unit), by Country 2024 & 2032
- Figure 13: Asia Pacific AI in Oncology Market Revenue Share (%), by Country 2024 & 2032
- Figure 14: Asia Pacific AI in Oncology Market Volume Share (%), by Country 2024 & 2032
- Figure 15: Middle East and Africa AI in Oncology Market Revenue (Million), by Country 2024 & 2032
- Figure 16: Middle East and Africa AI in Oncology Market Volume (K Unit), by Country 2024 & 2032
- Figure 17: Middle East and Africa AI in Oncology Market Revenue Share (%), by Country 2024 & 2032
- Figure 18: Middle East and Africa AI in Oncology Market Volume Share (%), by Country 2024 & 2032
- Figure 19: South America AI in Oncology Market Revenue (Million), by Country 2024 & 2032
- Figure 20: South America AI in Oncology Market Volume (K Unit), by Country 2024 & 2032
- Figure 21: South America AI in Oncology Market Revenue Share (%), by Country 2024 & 2032
- Figure 22: South America AI in Oncology Market Volume Share (%), by Country 2024 & 2032
- Figure 23: North America AI in Oncology Market Revenue (Million), by Component 2024 & 2032
- Figure 24: North America AI in Oncology Market Volume (K Unit), by Component 2024 & 2032
- Figure 25: North America AI in Oncology Market Revenue Share (%), by Component 2024 & 2032
- Figure 26: North America AI in Oncology Market Volume Share (%), by Component 2024 & 2032
- Figure 27: North America AI in Oncology Market Revenue (Million), by Cancer Type 2024 & 2032
- Figure 28: North America AI in Oncology Market Volume (K Unit), by Cancer Type 2024 & 2032
- Figure 29: North America AI in Oncology Market Revenue Share (%), by Cancer Type 2024 & 2032
- Figure 30: North America AI in Oncology Market Volume Share (%), by Cancer Type 2024 & 2032
- Figure 31: North America AI in Oncology Market Revenue (Million), by Treatment Type 2024 & 2032
- Figure 32: North America AI in Oncology Market Volume (K Unit), by Treatment Type 2024 & 2032
- Figure 33: North America AI in Oncology Market Revenue Share (%), by Treatment Type 2024 & 2032
- Figure 34: North America AI in Oncology Market Volume Share (%), by Treatment Type 2024 & 2032
- Figure 35: North America AI in Oncology Market Revenue (Million), by Application 2024 & 2032
- Figure 36: North America AI in Oncology Market Volume (K Unit), by Application 2024 & 2032
- Figure 37: North America AI in Oncology Market Revenue Share (%), by Application 2024 & 2032
- Figure 38: North America AI in Oncology Market Volume Share (%), by Application 2024 & 2032
- Figure 39: North America AI in Oncology Market Revenue (Million), by Country 2024 & 2032
- Figure 40: North America AI in Oncology Market Volume (K Unit), by Country 2024 & 2032
- Figure 41: North America AI in Oncology Market Revenue Share (%), by Country 2024 & 2032
- Figure 42: North America AI in Oncology Market Volume Share (%), by Country 2024 & 2032
- Figure 43: Europe AI in Oncology Market Revenue (Million), by Component 2024 & 2032
- Figure 44: Europe AI in Oncology Market Volume (K Unit), by Component 2024 & 2032
- Figure 45: Europe AI in Oncology Market Revenue Share (%), by Component 2024 & 2032
- Figure 46: Europe AI in Oncology Market Volume Share (%), by Component 2024 & 2032
- Figure 47: Europe AI in Oncology Market Revenue (Million), by Cancer Type 2024 & 2032
- Figure 48: Europe AI in Oncology Market Volume (K Unit), by Cancer Type 2024 & 2032
- Figure 49: Europe AI in Oncology Market Revenue Share (%), by Cancer Type 2024 & 2032
- Figure 50: Europe AI in Oncology Market Volume Share (%), by Cancer Type 2024 & 2032
- Figure 51: Europe AI in Oncology Market Revenue (Million), by Treatment Type 2024 & 2032
- Figure 52: Europe AI in Oncology Market Volume (K Unit), by Treatment Type 2024 & 2032
- Figure 53: Europe AI in Oncology Market Revenue Share (%), by Treatment Type 2024 & 2032
- Figure 54: Europe AI in Oncology Market Volume Share (%), by Treatment Type 2024 & 2032
- Figure 55: Europe AI in Oncology Market Revenue (Million), by Application 2024 & 2032
- Figure 56: Europe AI in Oncology Market Volume (K Unit), by Application 2024 & 2032
- Figure 57: Europe AI in Oncology Market Revenue Share (%), by Application 2024 & 2032
- Figure 58: Europe AI in Oncology Market Volume Share (%), by Application 2024 & 2032
- Figure 59: Europe AI in Oncology Market Revenue (Million), by Country 2024 & 2032
- Figure 60: Europe AI in Oncology Market Volume (K Unit), by Country 2024 & 2032
- Figure 61: Europe AI in Oncology Market Revenue Share (%), by Country 2024 & 2032
- Figure 62: Europe AI in Oncology Market Volume Share (%), by Country 2024 & 2032
- Figure 63: Asia Pacific AI in Oncology Market Revenue (Million), by Component 2024 & 2032
- Figure 64: Asia Pacific AI in Oncology Market Volume (K Unit), by Component 2024 & 2032
- Figure 65: Asia Pacific AI in Oncology Market Revenue Share (%), by Component 2024 & 2032
- Figure 66: Asia Pacific AI in Oncology Market Volume Share (%), by Component 2024 & 2032
- Figure 67: Asia Pacific AI in Oncology Market Revenue (Million), by Cancer Type 2024 & 2032
- Figure 68: Asia Pacific AI in Oncology Market Volume (K Unit), by Cancer Type 2024 & 2032
- Figure 69: Asia Pacific AI in Oncology Market Revenue Share (%), by Cancer Type 2024 & 2032
- Figure 70: Asia Pacific AI in Oncology Market Volume Share (%), by Cancer Type 2024 & 2032
- Figure 71: Asia Pacific AI in Oncology Market Revenue (Million), by Treatment Type 2024 & 2032
- Figure 72: Asia Pacific AI in Oncology Market Volume (K Unit), by Treatment Type 2024 & 2032
- Figure 73: Asia Pacific AI in Oncology Market Revenue Share (%), by Treatment Type 2024 & 2032
- Figure 74: Asia Pacific AI in Oncology Market Volume Share (%), by Treatment Type 2024 & 2032
- Figure 75: Asia Pacific AI in Oncology Market Revenue (Million), by Application 2024 & 2032
- Figure 76: Asia Pacific AI in Oncology Market Volume (K Unit), by Application 2024 & 2032
- Figure 77: Asia Pacific AI in Oncology Market Revenue Share (%), by Application 2024 & 2032
- Figure 78: Asia Pacific AI in Oncology Market Volume Share (%), by Application 2024 & 2032
- Figure 79: Asia Pacific AI in Oncology Market Revenue (Million), by Country 2024 & 2032
- Figure 80: Asia Pacific AI in Oncology Market Volume (K Unit), by Country 2024 & 2032
- Figure 81: Asia Pacific AI in Oncology Market Revenue Share (%), by Country 2024 & 2032
- Figure 82: Asia Pacific AI in Oncology Market Volume Share (%), by Country 2024 & 2032
- Figure 83: Middle East and Africa AI in Oncology Market Revenue (Million), by Component 2024 & 2032
- Figure 84: Middle East and Africa AI in Oncology Market Volume (K Unit), by Component 2024 & 2032
- Figure 85: Middle East and Africa AI in Oncology Market Revenue Share (%), by Component 2024 & 2032
- Figure 86: Middle East and Africa AI in Oncology Market Volume Share (%), by Component 2024 & 2032
- Figure 87: Middle East and Africa AI in Oncology Market Revenue (Million), by Cancer Type 2024 & 2032
- Figure 88: Middle East and Africa AI in Oncology Market Volume (K Unit), by Cancer Type 2024 & 2032
- Figure 89: Middle East and Africa AI in Oncology Market Revenue Share (%), by Cancer Type 2024 & 2032
- Figure 90: Middle East and Africa AI in Oncology Market Volume Share (%), by Cancer Type 2024 & 2032
- Figure 91: Middle East and Africa AI in Oncology Market Revenue (Million), by Treatment Type 2024 & 2032
- Figure 92: Middle East and Africa AI in Oncology Market Volume (K Unit), by Treatment Type 2024 & 2032
- Figure 93: Middle East and Africa AI in Oncology Market Revenue Share (%), by Treatment Type 2024 & 2032
- Figure 94: Middle East and Africa AI in Oncology Market Volume Share (%), by Treatment Type 2024 & 2032
- Figure 95: Middle East and Africa AI in Oncology Market Revenue (Million), by Application 2024 & 2032
- Figure 96: Middle East and Africa AI in Oncology Market Volume (K Unit), by Application 2024 & 2032
- Figure 97: Middle East and Africa AI in Oncology Market Revenue Share (%), by Application 2024 & 2032
- Figure 98: Middle East and Africa AI in Oncology Market Volume Share (%), by Application 2024 & 2032
- Figure 99: Middle East and Africa AI in Oncology Market Revenue (Million), by Country 2024 & 2032
- Figure 100: Middle East and Africa AI in Oncology Market Volume (K Unit), by Country 2024 & 2032
- Figure 101: Middle East and Africa AI in Oncology Market Revenue Share (%), by Country 2024 & 2032
- Figure 102: Middle East and Africa AI in Oncology Market Volume Share (%), by Country 2024 & 2032
- Figure 103: South America AI in Oncology Market Revenue (Million), by Component 2024 & 2032
- Figure 104: South America AI in Oncology Market Volume (K Unit), by Component 2024 & 2032
- Figure 105: South America AI in Oncology Market Revenue Share (%), by Component 2024 & 2032
- Figure 106: South America AI in Oncology Market Volume Share (%), by Component 2024 & 2032
- Figure 107: South America AI in Oncology Market Revenue (Million), by Cancer Type 2024 & 2032
- Figure 108: South America AI in Oncology Market Volume (K Unit), by Cancer Type 2024 & 2032
- Figure 109: South America AI in Oncology Market Revenue Share (%), by Cancer Type 2024 & 2032
- Figure 110: South America AI in Oncology Market Volume Share (%), by Cancer Type 2024 & 2032
- Figure 111: South America AI in Oncology Market Revenue (Million), by Treatment Type 2024 & 2032
- Figure 112: South America AI in Oncology Market Volume (K Unit), by Treatment Type 2024 & 2032
- Figure 113: South America AI in Oncology Market Revenue Share (%), by Treatment Type 2024 & 2032
- Figure 114: South America AI in Oncology Market Volume Share (%), by Treatment Type 2024 & 2032
- Figure 115: South America AI in Oncology Market Revenue (Million), by Application 2024 & 2032
- Figure 116: South America AI in Oncology Market Volume (K Unit), by Application 2024 & 2032
- Figure 117: South America AI in Oncology Market Revenue Share (%), by Application 2024 & 2032
- Figure 118: South America AI in Oncology Market Volume Share (%), by Application 2024 & 2032
- Figure 119: South America AI in Oncology Market Revenue (Million), by Country 2024 & 2032
- Figure 120: South America AI in Oncology Market Volume (K Unit), by Country 2024 & 2032
- Figure 121: South America AI in Oncology Market Revenue Share (%), by Country 2024 & 2032
- Figure 122: South America AI in Oncology Market Volume Share (%), by Country 2024 & 2032
List of Tables
- Table 1: Global AI in Oncology Market Revenue Million Forecast, by Region 2019 & 2032
- Table 2: Global AI in Oncology Market Volume K Unit Forecast, by Region 2019 & 2032
- Table 3: Global AI in Oncology Market Revenue Million Forecast, by Component 2019 & 2032
- Table 4: Global AI in Oncology Market Volume K Unit Forecast, by Component 2019 & 2032
- Table 5: Global AI in Oncology Market Revenue Million Forecast, by Cancer Type 2019 & 2032
- Table 6: Global AI in Oncology Market Volume K Unit Forecast, by Cancer Type 2019 & 2032
- Table 7: Global AI in Oncology Market Revenue Million Forecast, by Treatment Type 2019 & 2032
- Table 8: Global AI in Oncology Market Volume K Unit Forecast, by Treatment Type 2019 & 2032
- Table 9: Global AI in Oncology Market Revenue Million Forecast, by Application 2019 & 2032
- Table 10: Global AI in Oncology Market Volume K Unit Forecast, by Application 2019 & 2032
- Table 11: Global AI in Oncology Market Revenue Million Forecast, by Region 2019 & 2032
- Table 12: Global AI in Oncology Market Volume K Unit Forecast, by Region 2019 & 2032
- Table 13: Global AI in Oncology Market Revenue Million Forecast, by Country 2019 & 2032
- Table 14: Global AI in Oncology Market Volume K Unit Forecast, by Country 2019 & 2032
- Table 15: Global AI in Oncology Market Revenue Million Forecast, by Country 2019 & 2032
- Table 16: Global AI in Oncology Market Volume K Unit Forecast, by Country 2019 & 2032
- Table 17: Global AI in Oncology Market Revenue Million Forecast, by Country 2019 & 2032
- Table 18: Global AI in Oncology Market Volume K Unit Forecast, by Country 2019 & 2032
- Table 19: Global AI in Oncology Market Revenue Million Forecast, by Country 2019 & 2032
- Table 20: Global AI in Oncology Market Volume K Unit Forecast, by Country 2019 & 2032
- Table 21: Global AI in Oncology Market Revenue Million Forecast, by Country 2019 & 2032
- Table 22: Global AI in Oncology Market Volume K Unit Forecast, by Country 2019 & 2032
- Table 23: Global AI in Oncology Market Revenue Million Forecast, by Component 2019 & 2032
- Table 24: Global AI in Oncology Market Volume K Unit Forecast, by Component 2019 & 2032
- Table 25: Global AI in Oncology Market Revenue Million Forecast, by Cancer Type 2019 & 2032
- Table 26: Global AI in Oncology Market Volume K Unit Forecast, by Cancer Type 2019 & 2032
- Table 27: Global AI in Oncology Market Revenue Million Forecast, by Treatment Type 2019 & 2032
- Table 28: Global AI in Oncology Market Volume K Unit Forecast, by Treatment Type 2019 & 2032
- Table 29: Global AI in Oncology Market Revenue Million Forecast, by Application 2019 & 2032
- Table 30: Global AI in Oncology Market Volume K Unit Forecast, by Application 2019 & 2032
- Table 31: Global AI in Oncology Market Revenue Million Forecast, by Country 2019 & 2032
- Table 32: Global AI in Oncology Market Volume K Unit Forecast, by Country 2019 & 2032
- Table 33: United States AI in Oncology Market Revenue (Million) Forecast, by Application 2019 & 2032
- Table 34: United States AI in Oncology Market Volume (K Unit) Forecast, by Application 2019 & 2032
- Table 35: Canada AI in Oncology Market Revenue (Million) Forecast, by Application 2019 & 2032
- Table 36: Canada AI in Oncology Market Volume (K Unit) Forecast, by Application 2019 & 2032
- Table 37: Mexico AI in Oncology Market Revenue (Million) Forecast, by Application 2019 & 2032
- Table 38: Mexico AI in Oncology Market Volume (K Unit) Forecast, by Application 2019 & 2032
- Table 39: Global AI in Oncology Market Revenue Million Forecast, by Component 2019 & 2032
- Table 40: Global AI in Oncology Market Volume K Unit Forecast, by Component 2019 & 2032
- Table 41: Global AI in Oncology Market Revenue Million Forecast, by Cancer Type 2019 & 2032
- Table 42: Global AI in Oncology Market Volume K Unit Forecast, by Cancer Type 2019 & 2032
- Table 43: Global AI in Oncology Market Revenue Million Forecast, by Treatment Type 2019 & 2032
- Table 44: Global AI in Oncology Market Volume K Unit Forecast, by Treatment Type 2019 & 2032
- Table 45: Global AI in Oncology Market Revenue Million Forecast, by Application 2019 & 2032
- Table 46: Global AI in Oncology Market Volume K Unit Forecast, by Application 2019 & 2032
- Table 47: Global AI in Oncology Market Revenue Million Forecast, by Country 2019 & 2032
- Table 48: Global AI in Oncology Market Volume K Unit Forecast, by Country 2019 & 2032
- Table 49: Germany AI in Oncology Market Revenue (Million) Forecast, by Application 2019 & 2032
- Table 50: Germany AI in Oncology Market Volume (K Unit) Forecast, by Application 2019 & 2032
- Table 51: United Kingdom AI in Oncology Market Revenue (Million) Forecast, by Application 2019 & 2032
- Table 52: United Kingdom AI in Oncology Market Volume (K Unit) Forecast, by Application 2019 & 2032
- Table 53: France AI in Oncology Market Revenue (Million) Forecast, by Application 2019 & 2032
- Table 54: France AI in Oncology Market Volume (K Unit) Forecast, by Application 2019 & 2032
- Table 55: Italy AI in Oncology Market Revenue (Million) Forecast, by Application 2019 & 2032
- Table 56: Italy AI in Oncology Market Volume (K Unit) Forecast, by Application 2019 & 2032
- Table 57: Spain AI in Oncology Market Revenue (Million) Forecast, by Application 2019 & 2032
- Table 58: Spain AI in Oncology Market Volume (K Unit) Forecast, by Application 2019 & 2032
- Table 59: Rest of Europe AI in Oncology Market Revenue (Million) Forecast, by Application 2019 & 2032
- Table 60: Rest of Europe AI in Oncology Market Volume (K Unit) Forecast, by Application 2019 & 2032
- Table 61: Global AI in Oncology Market Revenue Million Forecast, by Component 2019 & 2032
- Table 62: Global AI in Oncology Market Volume K Unit Forecast, by Component 2019 & 2032
- Table 63: Global AI in Oncology Market Revenue Million Forecast, by Cancer Type 2019 & 2032
- Table 64: Global AI in Oncology Market Volume K Unit Forecast, by Cancer Type 2019 & 2032
- Table 65: Global AI in Oncology Market Revenue Million Forecast, by Treatment Type 2019 & 2032
- Table 66: Global AI in Oncology Market Volume K Unit Forecast, by Treatment Type 2019 & 2032
- Table 67: Global AI in Oncology Market Revenue Million Forecast, by Application 2019 & 2032
- Table 68: Global AI in Oncology Market Volume K Unit Forecast, by Application 2019 & 2032
- Table 69: Global AI in Oncology Market Revenue Million Forecast, by Country 2019 & 2032
- Table 70: Global AI in Oncology Market Volume K Unit Forecast, by Country 2019 & 2032
- Table 71: China AI in Oncology Market Revenue (Million) Forecast, by Application 2019 & 2032
- Table 72: China AI in Oncology Market Volume (K Unit) Forecast, by Application 2019 & 2032
- Table 73: Japan AI in Oncology Market Revenue (Million) Forecast, by Application 2019 & 2032
- Table 74: Japan AI in Oncology Market Volume (K Unit) Forecast, by Application 2019 & 2032
- Table 75: India AI in Oncology Market Revenue (Million) Forecast, by Application 2019 & 2032
- Table 76: India AI in Oncology Market Volume (K Unit) Forecast, by Application 2019 & 2032
- Table 77: Australia AI in Oncology Market Revenue (Million) Forecast, by Application 2019 & 2032
- Table 78: Australia AI in Oncology Market Volume (K Unit) Forecast, by Application 2019 & 2032
- Table 79: South Korea AI in Oncology Market Revenue (Million) Forecast, by Application 2019 & 2032
- Table 80: South Korea AI in Oncology Market Volume (K Unit) Forecast, by Application 2019 & 2032
- Table 81: Rest of Asia Pacific AI in Oncology Market Revenue (Million) Forecast, by Application 2019 & 2032
- Table 82: Rest of Asia Pacific AI in Oncology Market Volume (K Unit) Forecast, by Application 2019 & 2032
- Table 83: Global AI in Oncology Market Revenue Million Forecast, by Component 2019 & 2032
- Table 84: Global AI in Oncology Market Volume K Unit Forecast, by Component 2019 & 2032
- Table 85: Global AI in Oncology Market Revenue Million Forecast, by Cancer Type 2019 & 2032
- Table 86: Global AI in Oncology Market Volume K Unit Forecast, by Cancer Type 2019 & 2032
- Table 87: Global AI in Oncology Market Revenue Million Forecast, by Treatment Type 2019 & 2032
- Table 88: Global AI in Oncology Market Volume K Unit Forecast, by Treatment Type 2019 & 2032
- Table 89: Global AI in Oncology Market Revenue Million Forecast, by Application 2019 & 2032
- Table 90: Global AI in Oncology Market Volume K Unit Forecast, by Application 2019 & 2032
- Table 91: Global AI in Oncology Market Revenue Million Forecast, by Country 2019 & 2032
- Table 92: Global AI in Oncology Market Volume K Unit Forecast, by Country 2019 & 2032
- Table 93: GCC AI in Oncology Market Revenue (Million) Forecast, by Application 2019 & 2032
- Table 94: GCC AI in Oncology Market Volume (K Unit) Forecast, by Application 2019 & 2032
- Table 95: South Africa AI in Oncology Market Revenue (Million) Forecast, by Application 2019 & 2032
- Table 96: South Africa AI in Oncology Market Volume (K Unit) Forecast, by Application 2019 & 2032
- Table 97: Rest of Middle East and Africa AI in Oncology Market Revenue (Million) Forecast, by Application 2019 & 2032
- Table 98: Rest of Middle East and Africa AI in Oncology Market Volume (K Unit) Forecast, by Application 2019 & 2032
- Table 99: Global AI in Oncology Market Revenue Million Forecast, by Component 2019 & 2032
- Table 100: Global AI in Oncology Market Volume K Unit Forecast, by Component 2019 & 2032
- Table 101: Global AI in Oncology Market Revenue Million Forecast, by Cancer Type 2019 & 2032
- Table 102: Global AI in Oncology Market Volume K Unit Forecast, by Cancer Type 2019 & 2032
- Table 103: Global AI in Oncology Market Revenue Million Forecast, by Treatment Type 2019 & 2032
- Table 104: Global AI in Oncology Market Volume K Unit Forecast, by Treatment Type 2019 & 2032
- Table 105: Global AI in Oncology Market Revenue Million Forecast, by Application 2019 & 2032
- Table 106: Global AI in Oncology Market Volume K Unit Forecast, by Application 2019 & 2032
- Table 107: Global AI in Oncology Market Revenue Million Forecast, by Country 2019 & 2032
- Table 108: Global AI in Oncology Market Volume K Unit Forecast, by Country 2019 & 2032
- Table 109: Brazil AI in Oncology Market Revenue (Million) Forecast, by Application 2019 & 2032
- Table 110: Brazil AI in Oncology Market Volume (K Unit) Forecast, by Application 2019 & 2032
- Table 111: Argentina AI in Oncology Market Revenue (Million) Forecast, by Application 2019 & 2032
- Table 112: Argentina AI in Oncology Market Volume (K Unit) Forecast, by Application 2019 & 2032
- Table 113: Rest of South America AI in Oncology Market Revenue (Million) Forecast, by Application 2019 & 2032
- Table 114: Rest of South America AI in Oncology Market Volume (K Unit) Forecast, by Application 2019 & 2032
Frequently Asked Questions
1. What is the projected Compound Annual Growth Rate (CAGR) of the AI in Oncology Market?
The projected CAGR is approximately 35.51%.
2. Which companies are prominent players in the AI in Oncology Market?
Key companies in the market include IBM Corporation, Digital Diagnostics Inc, PathAI, Medtronic, NVIDIA Corporation, GE Healthcare, Siemens Healthineers AG, Azra AI, Median Technologies Inc, Intel Corporation, ConcertAI LLC.
3. What are the main segments of the AI in Oncology Market?
The market segments include Component, Cancer Type, Treatment Type, Application.
4. Can you provide details about the market size?
The market size is estimated to be USD 1.46 Million as of 2022.
5. What are some drivers contributing to market growth?
Surging Advancements in Healthcare Infrastructure; Increasing Prevalence of Cancer; Rising Demand for Early and Accurate Diagnosis of Cancer.
6. What are the notable trends driving market growth?
Chemotherapy Segment is Expected to Have a Highest Growth Rate in the Forecast Period.
7. Are there any restraints impacting market growth?
High Initial Costs and Concerns over the Replacement of Human Workforce.
8. Can you provide examples of recent developments in the market?
In September 2021, Owkin, Inc., in collaboration with Cleveland Clinic researchers, announced the development of a deep-learning model that predicts survival and health outcomes for hepatocellular carcinoma.
9. What pricing options are available for accessing the report?
Pricing options include single-user, multi-user, and enterprise licenses priced at USD 4750, USD 5250, and USD 8750 respectively.
10. Is the market size provided in terms of value or volume?
The market size is provided in terms of value, measured in Million and volume, measured in K Unit.
11. Are there any specific market keywords associated with the report?
Yes, the market keyword associated with the report is "AI in Oncology Market," which aids in identifying and referencing the specific market segment covered.
12. How do I determine which pricing option suits my needs best?
The pricing options vary based on user requirements and access needs. Individual users may opt for single-user licenses, while businesses requiring broader access may choose multi-user or enterprise licenses for cost-effective access to the report.
13. Are there any additional resources or data provided in the AI in Oncology Market report?
While the report offers comprehensive insights, it's advisable to review the specific contents or supplementary materials provided to ascertain if additional resources or data are available.
14. How can I stay updated on further developments or reports in the AI in Oncology Market?
To stay informed about further developments, trends, and reports in the AI in Oncology Market, consider subscribing to industry newsletters, following relevant companies and organizations, or regularly checking reputable industry news sources and publications.
Methodology
Step 1 - Identification of Relevant Samples Size from Population Database


Step 2 - Approaches for Defining Global Market Size (Value, Volume* & Price*)

Note*: In applicable scenarios
Step 3 - Data Sources
Primary Research
- Web Analytics
- Survey Reports
- Research Institute
- Latest Research Reports
- Opinion Leaders
Secondary Research
- Annual Reports
- White Paper
- Latest Press Release
- Industry Association
- Paid Database
- Investor Presentations

Step 4 - Data Triangulation
Involves using different sources of information in order to increase the validity of a study
These sources are likely to be stakeholders in a program - participants, other researchers, program staff, other community members, and so on.
Then we put all data in single framework & apply various statistical tools to find out the dynamic on the market.
During the analysis stage, feedback from the stakeholder groups would be compared to determine areas of agreement as well as areas of divergence
