

Key Insights
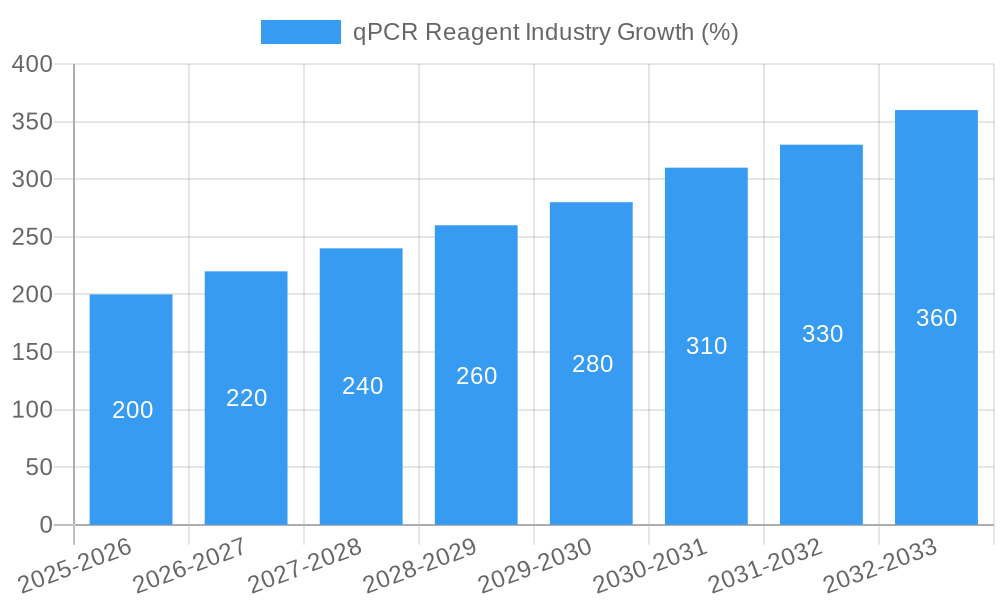
The global qPCR reagent market is experiencing robust growth, driven by the increasing prevalence of infectious diseases, the expanding application of qPCR technology in various research fields, and the rising demand for faster and more accurate diagnostic tools. The market's 7.90% CAGR signifies a substantial expansion, projected to reach significant value by 2033. This growth is fueled by advancements in qPCR technology, including the development of more sensitive and specific reagents, such as dye-based and probe-based qPCR reagents. Furthermore, the increasing adoption of qPCR in personalized medicine, cancer research, and food safety testing is contributing significantly to market expansion. The diverse range of applications, coupled with the relative ease of use and cost-effectiveness of qPCR assays, make it a preferred choice for researchers and clinicians alike. Hospitals and diagnostic centers remain the largest end-users, though research laboratories and academic institutions are also major contributors to market growth. The market is segmented by detection method (dye-based and probe-based reagents), packaging type (core kits and master mixes), and end-user. While the market faces restraints such as stringent regulatory approvals and high initial investment costs for sophisticated equipment, the overall positive trend suggests continued substantial growth throughout the forecast period.
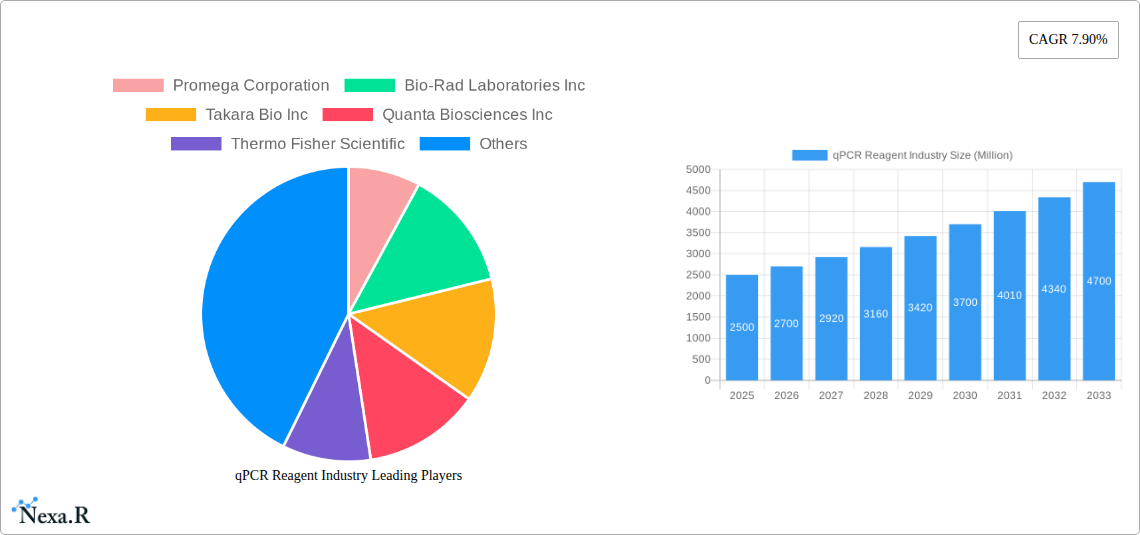
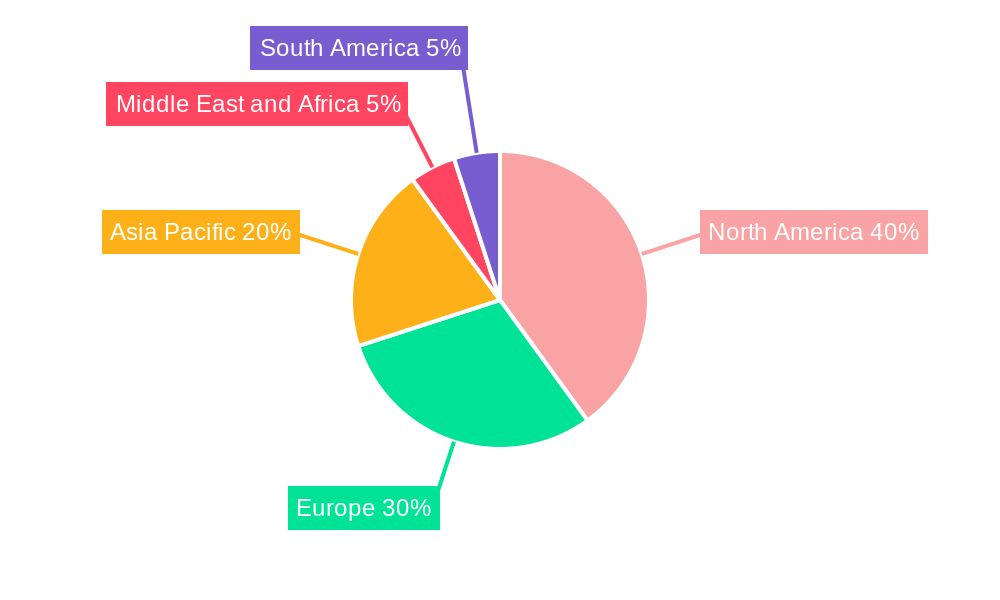
The geographical distribution of the market reflects varying levels of healthcare infrastructure and technological adoption. North America and Europe currently hold significant market share, owing to advanced healthcare systems and robust research funding. However, the Asia-Pacific region is poised for accelerated growth, driven by increasing healthcare expenditure, rising awareness of infectious diseases, and expanding research activities in emerging economies. Companies like Promega Corporation, Bio-Rad Laboratories, and Thermo Fisher Scientific are key players, constantly innovating and expanding their product portfolios to cater to the evolving market needs. Strategic alliances, collaborations, and product launches are common strategies employed by market leaders to strengthen their market positioning and competitiveness. The future of the qPCR reagent market appears bright, with consistent innovation and expanding applications predicted to drive significant expansion in the coming years.
qPCR Reagent Industry: A Comprehensive Market Report (2019-2033)
This comprehensive report provides an in-depth analysis of the qPCR Reagent industry, encompassing market dynamics, growth trends, regional segmentation, product landscape, and key players. The report covers the period from 2019 to 2033, with a focus on the forecast period from 2025 to 2033 and base year 2025. The total market size is projected to reach xx Million by 2033.
qPCR Reagent Industry Market Dynamics & Structure
The qPCR reagent market is characterized by a moderately concentrated landscape with a few dominant players holding significant market share. Technological innovation, particularly in areas like multiplex qPCR and digital PCR, are key drivers. Stringent regulatory frameworks governing diagnostics and research applications influence market growth. Competitive pressure stems from the availability of substitute technologies and the continuous introduction of improved reagents. End-user demographics, with research laboratories and hospitals/diagnostic centers being major consumers, significantly impact market demand. Mergers and acquisitions (M&A) activity has been moderate, with larger players strategically acquiring smaller companies to expand their product portfolios and geographic reach.
- Market Concentration: The top 5 players account for approximately xx% of the market share in 2025.
- Technological Innovation: Focus on higher sensitivity, multiplexing capabilities, and faster turnaround times.
- Regulatory Landscape: Stringent quality control and regulatory approvals (e.g., FDA, CE marking) impact market entry and growth.
- M&A Activity: xx M&A deals recorded between 2019 and 2024, primarily focused on expanding product lines and market access.
- Substitute Technologies: Digital PCR and other nucleic acid amplification methods pose competitive threats.
qPCR Reagent Industry Growth Trends & Insights
The qPCR reagent market is experiencing robust growth, driven by increased adoption in various applications, including disease diagnostics, drug discovery, and agricultural research. The market witnessed a CAGR of xx% during the historical period (2019-2024) and is projected to grow at a CAGR of xx% during the forecast period (2025-2033). Technological advancements, such as the development of more sensitive and specific reagents, are further accelerating market expansion. The increasing prevalence of infectious diseases and the rising demand for personalized medicine are key factors fueling market growth. Consumer behavior shifts towards advanced diagnostic tools and faster results are also influencing market demand.
Dominant Regions, Countries, or Segments in qPCR Reagent Industry
North America currently holds the largest market share in the qPCR reagent industry, followed by Europe and Asia-Pacific. This dominance is attributed to the presence of well-established research institutions, advanced healthcare infrastructure, and a higher adoption rate of qPCR technology in these regions. Within the segments, Probes and Primer-Based qPCR Reagents currently hold a larger market share than Dye-Based qPCR Reagents due to their higher sensitivity and specificity. qPCR Mastermixes are the leading packaging type, favored for their convenience and ease of use. Hospitals & Diagnostic Centers constitute a significant portion of the end-user segment, followed by Research Laboratories & Academic Institutes.
- Key Drivers (North America): Robust research funding, high healthcare expenditure, early adoption of advanced technologies.
- Key Drivers (Europe): Strong presence of pharmaceutical and biotechnology companies, focus on precision medicine.
- Key Drivers (Asia-Pacific): Rapid economic growth, increasing investments in healthcare infrastructure, growing prevalence of infectious diseases.
- Segment Dominance: Probes and Primer-Based qPCR Reagents, qPCR Mastermixes, and Hospitals & Diagnostic Centers show highest growth potential.
qPCR Reagent Industry Product Landscape
The qPCR reagent market offers a wide range of products, including dye-based and probe/primer-based reagents, core kits, and master mixes. Recent innovations have focused on enhancing sensitivity, specificity, and multiplexing capabilities. Products often incorporate advanced features like internal controls and improved shelf life. Companies are increasingly offering customized solutions tailored to specific applications. Unique selling propositions often include superior performance characteristics, streamlined workflows, and reduced assay costs.
Key Drivers, Barriers & Challenges in qPCR Reagent Industry
Key Drivers:
- The rising prevalence of infectious diseases and the growing demand for rapid diagnostics are significant drivers.
- Advancements in qPCR technology, such as multiplexing and digital PCR, are expanding applications and increasing market demand.
- Increased research funding and government initiatives supporting life science research fuel the market.
Key Challenges:
- Stringent regulatory requirements and approvals increase time and costs for product launches.
- Competition from alternative technologies such as next-generation sequencing (NGS) puts pressure on market share.
- Supply chain disruptions and fluctuations in raw material prices pose ongoing challenges.
Emerging Opportunities in qPCR Reagent Industry
- Growing demand for point-of-care diagnostics presents substantial opportunities for developing portable and user-friendly qPCR systems and reagents.
- The increasing focus on personalized medicine and pharmacogenomics is driving the development of customized qPCR assays.
- Expansion into emerging markets with growing healthcare infrastructure offers significant growth potential.
Growth Accelerators in the qPCR Reagent Industry
Technological advancements like the development of novel dyes, probes, and enzymes, coupled with improvements in instrument design, are major growth catalysts. Strategic partnerships between reagent manufacturers and instrument providers enhance market reach and streamline workflows. Market expansion into new applications, like environmental monitoring and food safety, further accelerates market growth.
Key Players Shaping the qPCR Reagent Industry Market
- Promega Corporation
- Bio-Rad Laboratories Inc
- Takara Bio Inc
- Quanta Biosciences Inc
- Thermo Fisher Scientific
- Sigma-Aldrich Corporation (Merck KGaA)
- Agilent Technologies Inc
- F Hoffman-La Roche Ltd
- Kaneka Eurogentec S A
Notable Milestones in qPCR Reagent Industry Sector
- November 2022: PCR Biosystems launched the Clara family of qPCR reagent mixes (Clara Probe Mix, Clara Probe 1-Step Mix, and Clara HRM Mix), improving performance in challenging laboratory settings.
- September 2022: Integrated DNA Technologies introduced the PrimeTime qPCR One-Step Master Mix with a mutant enzyme, optimized for viral research and gene expression applications.
In-Depth qPCR Reagent Industry Market Outlook
The qPCR reagent market is poised for continued growth, driven by ongoing technological innovation and the expanding applications of qPCR technology. Strategic partnerships, market expansion into emerging economies, and the development of next-generation qPCR reagents will be key factors shaping the future of this market. The focus on developing faster, more accurate, and cost-effective assays will drive further market penetration across various sectors.
qPCR Reagent Industry Segmentation
-
1. Detection Method
- 1.1. Dye-Based qPCR Reagents
- 1.2. Probes and Primer-Based qPCR Reagents
-
2. Packaging Type
- 2.1. qPCR Core Kits
- 2.2. qPCR Mastermixes
-
3. End-User
- 3.1. Hospitals & Diagnostic Centers
- 3.2. Research Laboratories & Academic Institutes
- 3.3. Others
qPCR Reagent Industry Segmentation By Geography
-
1. North America
- 1.1. United States
- 1.2. Canada
- 1.3. Mexico
-
2. Europe
- 2.1. Germany
- 2.2. United Kingdom
- 2.3. France
- 2.4. Italy
- 2.5. Spain
- 2.6. Rest of Europe
-
3. Asia Pacific
- 3.1. China
- 3.2. Japan
- 3.3. India
- 3.4. Australia
- 3.5. South Korea
- 3.6. Rest of Asia Pacific
-
4. Middle East and Africa
- 4.1. GCC
- 4.2. South Africa
- 4.3. Rest of Middle East and Africa
-
5. South America
- 5.1. Brazil
- 5.2. Argentina
- 5.3. Rest of South America
qPCR Reagent Industry REPORT HIGHLIGHTS
| Aspects | Details |
|---|---|
| Study Period | 2019-2033 |
| Base Year | 2024 |
| Estimated Year | 2025 |
| Forecast Period | 2025-2033 |
| Historical Period | 2019-2024 |
| Growth Rate | CAGR of 7.90% from 2019-2033 |
| Segmentation |
|
Table of Contents
- 1. Introduction
- 1.1. Research Scope
- 1.2. Market Segmentation
- 1.3. Research Methodology
- 1.4. Definitions and Assumptions
- 2. Executive Summary
- 2.1. Introduction
- 3. Market Dynamics
- 3.1. Introduction
- 3.2. Market Drivers
- 3.2.1. Rising Incidence of Infectious Diseases and Genetic Disorders; Growing Geriatric Population; Increasing Focus on Human Genome Projects
- 3.3. Market Restrains
- 3.3.1. High Cost of Reagents and qPCR Equipment; Lack of Technical Expertise to Operate the qPCR instrument
- 3.4. Market Trends
- 3.4.1. Dye-Based qPCR Reagents are Expected to Dominate the Market
- 4. Market Factor Analysis
- 4.1. Porters Five Forces
- 4.2. Supply/Value Chain
- 4.3. PESTEL analysis
- 4.4. Market Entropy
- 4.5. Patent/Trademark Analysis
- 5. Global qPCR Reagent Industry Analysis, Insights and Forecast, 2019-2031
- 5.1. Market Analysis, Insights and Forecast - by Detection Method
- 5.1.1. Dye-Based qPCR Reagents
- 5.1.2. Probes and Primer-Based qPCR Reagents
- 5.2. Market Analysis, Insights and Forecast - by Packaging Type
- 5.2.1. qPCR Core Kits
- 5.2.2. qPCR Mastermixes
- 5.3. Market Analysis, Insights and Forecast - by End-User
- 5.3.1. Hospitals & Diagnostic Centers
- 5.3.2. Research Laboratories & Academic Institutes
- 5.3.3. Others
- 5.4. Market Analysis, Insights and Forecast - by Region
- 5.4.1. North America
- 5.4.2. Europe
- 5.4.3. Asia Pacific
- 5.4.4. Middle East and Africa
- 5.4.5. South America
- 5.1. Market Analysis, Insights and Forecast - by Detection Method
- 6. North America qPCR Reagent Industry Analysis, Insights and Forecast, 2019-2031
- 6.1. Market Analysis, Insights and Forecast - by Detection Method
- 6.1.1. Dye-Based qPCR Reagents
- 6.1.2. Probes and Primer-Based qPCR Reagents
- 6.2. Market Analysis, Insights and Forecast - by Packaging Type
- 6.2.1. qPCR Core Kits
- 6.2.2. qPCR Mastermixes
- 6.3. Market Analysis, Insights and Forecast - by End-User
- 6.3.1. Hospitals & Diagnostic Centers
- 6.3.2. Research Laboratories & Academic Institutes
- 6.3.3. Others
- 6.1. Market Analysis, Insights and Forecast - by Detection Method
- 7. Europe qPCR Reagent Industry Analysis, Insights and Forecast, 2019-2031
- 7.1. Market Analysis, Insights and Forecast - by Detection Method
- 7.1.1. Dye-Based qPCR Reagents
- 7.1.2. Probes and Primer-Based qPCR Reagents
- 7.2. Market Analysis, Insights and Forecast - by Packaging Type
- 7.2.1. qPCR Core Kits
- 7.2.2. qPCR Mastermixes
- 7.3. Market Analysis, Insights and Forecast - by End-User
- 7.3.1. Hospitals & Diagnostic Centers
- 7.3.2. Research Laboratories & Academic Institutes
- 7.3.3. Others
- 7.1. Market Analysis, Insights and Forecast - by Detection Method
- 8. Asia Pacific qPCR Reagent Industry Analysis, Insights and Forecast, 2019-2031
- 8.1. Market Analysis, Insights and Forecast - by Detection Method
- 8.1.1. Dye-Based qPCR Reagents
- 8.1.2. Probes and Primer-Based qPCR Reagents
- 8.2. Market Analysis, Insights and Forecast - by Packaging Type
- 8.2.1. qPCR Core Kits
- 8.2.2. qPCR Mastermixes
- 8.3. Market Analysis, Insights and Forecast - by End-User
- 8.3.1. Hospitals & Diagnostic Centers
- 8.3.2. Research Laboratories & Academic Institutes
- 8.3.3. Others
- 8.1. Market Analysis, Insights and Forecast - by Detection Method
- 9. Middle East and Africa qPCR Reagent Industry Analysis, Insights and Forecast, 2019-2031
- 9.1. Market Analysis, Insights and Forecast - by Detection Method
- 9.1.1. Dye-Based qPCR Reagents
- 9.1.2. Probes and Primer-Based qPCR Reagents
- 9.2. Market Analysis, Insights and Forecast - by Packaging Type
- 9.2.1. qPCR Core Kits
- 9.2.2. qPCR Mastermixes
- 9.3. Market Analysis, Insights and Forecast - by End-User
- 9.3.1. Hospitals & Diagnostic Centers
- 9.3.2. Research Laboratories & Academic Institutes
- 9.3.3. Others
- 9.1. Market Analysis, Insights and Forecast - by Detection Method
- 10. South America qPCR Reagent Industry Analysis, Insights and Forecast, 2019-2031
- 10.1. Market Analysis, Insights and Forecast - by Detection Method
- 10.1.1. Dye-Based qPCR Reagents
- 10.1.2. Probes and Primer-Based qPCR Reagents
- 10.2. Market Analysis, Insights and Forecast - by Packaging Type
- 10.2.1. qPCR Core Kits
- 10.2.2. qPCR Mastermixes
- 10.3. Market Analysis, Insights and Forecast - by End-User
- 10.3.1. Hospitals & Diagnostic Centers
- 10.3.2. Research Laboratories & Academic Institutes
- 10.3.3. Others
- 10.1. Market Analysis, Insights and Forecast - by Detection Method
- 11. North America qPCR Reagent Industry Analysis, Insights and Forecast, 2019-2031
- 11.1. Market Analysis, Insights and Forecast - By Country/Sub-region
- 11.1.1 United States
- 11.1.2 Canada
- 11.1.3 Mexico
- 12. Europe qPCR Reagent Industry Analysis, Insights and Forecast, 2019-2031
- 12.1. Market Analysis, Insights and Forecast - By Country/Sub-region
- 12.1.1 Germany
- 12.1.2 United Kingdom
- 12.1.3 France
- 12.1.4 Italy
- 12.1.5 Spain
- 12.1.6 Rest of Europe
- 13. Asia Pacific qPCR Reagent Industry Analysis, Insights and Forecast, 2019-2031
- 13.1. Market Analysis, Insights and Forecast - By Country/Sub-region
- 13.1.1 China
- 13.1.2 Japan
- 13.1.3 India
- 13.1.4 Australia
- 13.1.5 South Korea
- 13.1.6 Rest of Asia Pacific
- 14. Middle East and Africa qPCR Reagent Industry Analysis, Insights and Forecast, 2019-2031
- 14.1. Market Analysis, Insights and Forecast - By Country/Sub-region
- 14.1.1 GCC
- 14.1.2 South Africa
- 14.1.3 Rest of Middle East and Africa
- 15. South America qPCR Reagent Industry Analysis, Insights and Forecast, 2019-2031
- 15.1. Market Analysis, Insights and Forecast - By Country/Sub-region
- 15.1.1 Brazil
- 15.1.2 Argentina
- 15.1.3 Rest of South America
- 16. Competitive Analysis
- 16.1. Global Market Share Analysis 2024
- 16.2. Company Profiles
- 16.2.1 Promega Corporation
- 16.2.1.1. Overview
- 16.2.1.2. Products
- 16.2.1.3. SWOT Analysis
- 16.2.1.4. Recent Developments
- 16.2.1.5. Financials (Based on Availability)
- 16.2.2 Bio-Rad Laboratories Inc
- 16.2.2.1. Overview
- 16.2.2.2. Products
- 16.2.2.3. SWOT Analysis
- 16.2.2.4. Recent Developments
- 16.2.2.5. Financials (Based on Availability)
- 16.2.3 Takara Bio Inc
- 16.2.3.1. Overview
- 16.2.3.2. Products
- 16.2.3.3. SWOT Analysis
- 16.2.3.4. Recent Developments
- 16.2.3.5. Financials (Based on Availability)
- 16.2.4 Quanta Biosciences Inc
- 16.2.4.1. Overview
- 16.2.4.2. Products
- 16.2.4.3. SWOT Analysis
- 16.2.4.4. Recent Developments
- 16.2.4.5. Financials (Based on Availability)
- 16.2.5 Thermo Fisher Scientific
- 16.2.5.1. Overview
- 16.2.5.2. Products
- 16.2.5.3. SWOT Analysis
- 16.2.5.4. Recent Developments
- 16.2.5.5. Financials (Based on Availability)
- 16.2.6 Sigma-Aldrich Corporation (Merck KGaA)
- 16.2.6.1. Overview
- 16.2.6.2. Products
- 16.2.6.3. SWOT Analysis
- 16.2.6.4. Recent Developments
- 16.2.6.5. Financials (Based on Availability)
- 16.2.7 Agilent Technologies Inc
- 16.2.7.1. Overview
- 16.2.7.2. Products
- 16.2.7.3. SWOT Analysis
- 16.2.7.4. Recent Developments
- 16.2.7.5. Financials (Based on Availability)
- 16.2.8 F Hoffman-La Roche Ltd
- 16.2.8.1. Overview
- 16.2.8.2. Products
- 16.2.8.3. SWOT Analysis
- 16.2.8.4. Recent Developments
- 16.2.8.5. Financials (Based on Availability)
- 16.2.9 Kaneka Eurogentec S A
- 16.2.9.1. Overview
- 16.2.9.2. Products
- 16.2.9.3. SWOT Analysis
- 16.2.9.4. Recent Developments
- 16.2.9.5. Financials (Based on Availability)
- 16.2.1 Promega Corporation
List of Figures
- Figure 1: Global qPCR Reagent Industry Revenue Breakdown (Million, %) by Region 2024 & 2032
- Figure 2: North America qPCR Reagent Industry Revenue (Million), by Country 2024 & 2032
- Figure 3: North America qPCR Reagent Industry Revenue Share (%), by Country 2024 & 2032
- Figure 4: Europe qPCR Reagent Industry Revenue (Million), by Country 2024 & 2032
- Figure 5: Europe qPCR Reagent Industry Revenue Share (%), by Country 2024 & 2032
- Figure 6: Asia Pacific qPCR Reagent Industry Revenue (Million), by Country 2024 & 2032
- Figure 7: Asia Pacific qPCR Reagent Industry Revenue Share (%), by Country 2024 & 2032
- Figure 8: Middle East and Africa qPCR Reagent Industry Revenue (Million), by Country 2024 & 2032
- Figure 9: Middle East and Africa qPCR Reagent Industry Revenue Share (%), by Country 2024 & 2032
- Figure 10: South America qPCR Reagent Industry Revenue (Million), by Country 2024 & 2032
- Figure 11: South America qPCR Reagent Industry Revenue Share (%), by Country 2024 & 2032
- Figure 12: North America qPCR Reagent Industry Revenue (Million), by Detection Method 2024 & 2032
- Figure 13: North America qPCR Reagent Industry Revenue Share (%), by Detection Method 2024 & 2032
- Figure 14: North America qPCR Reagent Industry Revenue (Million), by Packaging Type 2024 & 2032
- Figure 15: North America qPCR Reagent Industry Revenue Share (%), by Packaging Type 2024 & 2032
- Figure 16: North America qPCR Reagent Industry Revenue (Million), by End-User 2024 & 2032
- Figure 17: North America qPCR Reagent Industry Revenue Share (%), by End-User 2024 & 2032
- Figure 18: North America qPCR Reagent Industry Revenue (Million), by Country 2024 & 2032
- Figure 19: North America qPCR Reagent Industry Revenue Share (%), by Country 2024 & 2032
- Figure 20: Europe qPCR Reagent Industry Revenue (Million), by Detection Method 2024 & 2032
- Figure 21: Europe qPCR Reagent Industry Revenue Share (%), by Detection Method 2024 & 2032
- Figure 22: Europe qPCR Reagent Industry Revenue (Million), by Packaging Type 2024 & 2032
- Figure 23: Europe qPCR Reagent Industry Revenue Share (%), by Packaging Type 2024 & 2032
- Figure 24: Europe qPCR Reagent Industry Revenue (Million), by End-User 2024 & 2032
- Figure 25: Europe qPCR Reagent Industry Revenue Share (%), by End-User 2024 & 2032
- Figure 26: Europe qPCR Reagent Industry Revenue (Million), by Country 2024 & 2032
- Figure 27: Europe qPCR Reagent Industry Revenue Share (%), by Country 2024 & 2032
- Figure 28: Asia Pacific qPCR Reagent Industry Revenue (Million), by Detection Method 2024 & 2032
- Figure 29: Asia Pacific qPCR Reagent Industry Revenue Share (%), by Detection Method 2024 & 2032
- Figure 30: Asia Pacific qPCR Reagent Industry Revenue (Million), by Packaging Type 2024 & 2032
- Figure 31: Asia Pacific qPCR Reagent Industry Revenue Share (%), by Packaging Type 2024 & 2032
- Figure 32: Asia Pacific qPCR Reagent Industry Revenue (Million), by End-User 2024 & 2032
- Figure 33: Asia Pacific qPCR Reagent Industry Revenue Share (%), by End-User 2024 & 2032
- Figure 34: Asia Pacific qPCR Reagent Industry Revenue (Million), by Country 2024 & 2032
- Figure 35: Asia Pacific qPCR Reagent Industry Revenue Share (%), by Country 2024 & 2032
- Figure 36: Middle East and Africa qPCR Reagent Industry Revenue (Million), by Detection Method 2024 & 2032
- Figure 37: Middle East and Africa qPCR Reagent Industry Revenue Share (%), by Detection Method 2024 & 2032
- Figure 38: Middle East and Africa qPCR Reagent Industry Revenue (Million), by Packaging Type 2024 & 2032
- Figure 39: Middle East and Africa qPCR Reagent Industry Revenue Share (%), by Packaging Type 2024 & 2032
- Figure 40: Middle East and Africa qPCR Reagent Industry Revenue (Million), by End-User 2024 & 2032
- Figure 41: Middle East and Africa qPCR Reagent Industry Revenue Share (%), by End-User 2024 & 2032
- Figure 42: Middle East and Africa qPCR Reagent Industry Revenue (Million), by Country 2024 & 2032
- Figure 43: Middle East and Africa qPCR Reagent Industry Revenue Share (%), by Country 2024 & 2032
- Figure 44: South America qPCR Reagent Industry Revenue (Million), by Detection Method 2024 & 2032
- Figure 45: South America qPCR Reagent Industry Revenue Share (%), by Detection Method 2024 & 2032
- Figure 46: South America qPCR Reagent Industry Revenue (Million), by Packaging Type 2024 & 2032
- Figure 47: South America qPCR Reagent Industry Revenue Share (%), by Packaging Type 2024 & 2032
- Figure 48: South America qPCR Reagent Industry Revenue (Million), by End-User 2024 & 2032
- Figure 49: South America qPCR Reagent Industry Revenue Share (%), by End-User 2024 & 2032
- Figure 50: South America qPCR Reagent Industry Revenue (Million), by Country 2024 & 2032
- Figure 51: South America qPCR Reagent Industry Revenue Share (%), by Country 2024 & 2032
List of Tables
- Table 1: Global qPCR Reagent Industry Revenue Million Forecast, by Region 2019 & 2032
- Table 2: Global qPCR Reagent Industry Revenue Million Forecast, by Detection Method 2019 & 2032
- Table 3: Global qPCR Reagent Industry Revenue Million Forecast, by Packaging Type 2019 & 2032
- Table 4: Global qPCR Reagent Industry Revenue Million Forecast, by End-User 2019 & 2032
- Table 5: Global qPCR Reagent Industry Revenue Million Forecast, by Region 2019 & 2032
- Table 6: Global qPCR Reagent Industry Revenue Million Forecast, by Country 2019 & 2032
- Table 7: United States qPCR Reagent Industry Revenue (Million) Forecast, by Application 2019 & 2032
- Table 8: Canada qPCR Reagent Industry Revenue (Million) Forecast, by Application 2019 & 2032
- Table 9: Mexico qPCR Reagent Industry Revenue (Million) Forecast, by Application 2019 & 2032
- Table 10: Global qPCR Reagent Industry Revenue Million Forecast, by Country 2019 & 2032
- Table 11: Germany qPCR Reagent Industry Revenue (Million) Forecast, by Application 2019 & 2032
- Table 12: United Kingdom qPCR Reagent Industry Revenue (Million) Forecast, by Application 2019 & 2032
- Table 13: France qPCR Reagent Industry Revenue (Million) Forecast, by Application 2019 & 2032
- Table 14: Italy qPCR Reagent Industry Revenue (Million) Forecast, by Application 2019 & 2032
- Table 15: Spain qPCR Reagent Industry Revenue (Million) Forecast, by Application 2019 & 2032
- Table 16: Rest of Europe qPCR Reagent Industry Revenue (Million) Forecast, by Application 2019 & 2032
- Table 17: Global qPCR Reagent Industry Revenue Million Forecast, by Country 2019 & 2032
- Table 18: China qPCR Reagent Industry Revenue (Million) Forecast, by Application 2019 & 2032
- Table 19: Japan qPCR Reagent Industry Revenue (Million) Forecast, by Application 2019 & 2032
- Table 20: India qPCR Reagent Industry Revenue (Million) Forecast, by Application 2019 & 2032
- Table 21: Australia qPCR Reagent Industry Revenue (Million) Forecast, by Application 2019 & 2032
- Table 22: South Korea qPCR Reagent Industry Revenue (Million) Forecast, by Application 2019 & 2032
- Table 23: Rest of Asia Pacific qPCR Reagent Industry Revenue (Million) Forecast, by Application 2019 & 2032
- Table 24: Global qPCR Reagent Industry Revenue Million Forecast, by Country 2019 & 2032
- Table 25: GCC qPCR Reagent Industry Revenue (Million) Forecast, by Application 2019 & 2032
- Table 26: South Africa qPCR Reagent Industry Revenue (Million) Forecast, by Application 2019 & 2032
- Table 27: Rest of Middle East and Africa qPCR Reagent Industry Revenue (Million) Forecast, by Application 2019 & 2032
- Table 28: Global qPCR Reagent Industry Revenue Million Forecast, by Country 2019 & 2032
- Table 29: Brazil qPCR Reagent Industry Revenue (Million) Forecast, by Application 2019 & 2032
- Table 30: Argentina qPCR Reagent Industry Revenue (Million) Forecast, by Application 2019 & 2032
- Table 31: Rest of South America qPCR Reagent Industry Revenue (Million) Forecast, by Application 2019 & 2032
- Table 32: Global qPCR Reagent Industry Revenue Million Forecast, by Detection Method 2019 & 2032
- Table 33: Global qPCR Reagent Industry Revenue Million Forecast, by Packaging Type 2019 & 2032
- Table 34: Global qPCR Reagent Industry Revenue Million Forecast, by End-User 2019 & 2032
- Table 35: Global qPCR Reagent Industry Revenue Million Forecast, by Country 2019 & 2032
- Table 36: United States qPCR Reagent Industry Revenue (Million) Forecast, by Application 2019 & 2032
- Table 37: Canada qPCR Reagent Industry Revenue (Million) Forecast, by Application 2019 & 2032
- Table 38: Mexico qPCR Reagent Industry Revenue (Million) Forecast, by Application 2019 & 2032
- Table 39: Global qPCR Reagent Industry Revenue Million Forecast, by Detection Method 2019 & 2032
- Table 40: Global qPCR Reagent Industry Revenue Million Forecast, by Packaging Type 2019 & 2032
- Table 41: Global qPCR Reagent Industry Revenue Million Forecast, by End-User 2019 & 2032
- Table 42: Global qPCR Reagent Industry Revenue Million Forecast, by Country 2019 & 2032
- Table 43: Germany qPCR Reagent Industry Revenue (Million) Forecast, by Application 2019 & 2032
- Table 44: United Kingdom qPCR Reagent Industry Revenue (Million) Forecast, by Application 2019 & 2032
- Table 45: France qPCR Reagent Industry Revenue (Million) Forecast, by Application 2019 & 2032
- Table 46: Italy qPCR Reagent Industry Revenue (Million) Forecast, by Application 2019 & 2032
- Table 47: Spain qPCR Reagent Industry Revenue (Million) Forecast, by Application 2019 & 2032
- Table 48: Rest of Europe qPCR Reagent Industry Revenue (Million) Forecast, by Application 2019 & 2032
- Table 49: Global qPCR Reagent Industry Revenue Million Forecast, by Detection Method 2019 & 2032
- Table 50: Global qPCR Reagent Industry Revenue Million Forecast, by Packaging Type 2019 & 2032
- Table 51: Global qPCR Reagent Industry Revenue Million Forecast, by End-User 2019 & 2032
- Table 52: Global qPCR Reagent Industry Revenue Million Forecast, by Country 2019 & 2032
- Table 53: China qPCR Reagent Industry Revenue (Million) Forecast, by Application 2019 & 2032
- Table 54: Japan qPCR Reagent Industry Revenue (Million) Forecast, by Application 2019 & 2032
- Table 55: India qPCR Reagent Industry Revenue (Million) Forecast, by Application 2019 & 2032
- Table 56: Australia qPCR Reagent Industry Revenue (Million) Forecast, by Application 2019 & 2032
- Table 57: South Korea qPCR Reagent Industry Revenue (Million) Forecast, by Application 2019 & 2032
- Table 58: Rest of Asia Pacific qPCR Reagent Industry Revenue (Million) Forecast, by Application 2019 & 2032
- Table 59: Global qPCR Reagent Industry Revenue Million Forecast, by Detection Method 2019 & 2032
- Table 60: Global qPCR Reagent Industry Revenue Million Forecast, by Packaging Type 2019 & 2032
- Table 61: Global qPCR Reagent Industry Revenue Million Forecast, by End-User 2019 & 2032
- Table 62: Global qPCR Reagent Industry Revenue Million Forecast, by Country 2019 & 2032
- Table 63: GCC qPCR Reagent Industry Revenue (Million) Forecast, by Application 2019 & 2032
- Table 64: South Africa qPCR Reagent Industry Revenue (Million) Forecast, by Application 2019 & 2032
- Table 65: Rest of Middle East and Africa qPCR Reagent Industry Revenue (Million) Forecast, by Application 2019 & 2032
- Table 66: Global qPCR Reagent Industry Revenue Million Forecast, by Detection Method 2019 & 2032
- Table 67: Global qPCR Reagent Industry Revenue Million Forecast, by Packaging Type 2019 & 2032
- Table 68: Global qPCR Reagent Industry Revenue Million Forecast, by End-User 2019 & 2032
- Table 69: Global qPCR Reagent Industry Revenue Million Forecast, by Country 2019 & 2032
- Table 70: Brazil qPCR Reagent Industry Revenue (Million) Forecast, by Application 2019 & 2032
- Table 71: Argentina qPCR Reagent Industry Revenue (Million) Forecast, by Application 2019 & 2032
- Table 72: Rest of South America qPCR Reagent Industry Revenue (Million) Forecast, by Application 2019 & 2032
Frequently Asked Questions
1. What is the projected Compound Annual Growth Rate (CAGR) of the qPCR Reagent Industry?
The projected CAGR is approximately 7.90%.
2. Which companies are prominent players in the qPCR Reagent Industry?
Key companies in the market include Promega Corporation, Bio-Rad Laboratories Inc, Takara Bio Inc, Quanta Biosciences Inc, Thermo Fisher Scientific, Sigma-Aldrich Corporation (Merck KGaA), Agilent Technologies Inc, F Hoffman-La Roche Ltd, Kaneka Eurogentec S A.
3. What are the main segments of the qPCR Reagent Industry?
The market segments include Detection Method, Packaging Type, End-User.
4. Can you provide details about the market size?
The market size is estimated to be USD XX Million as of 2022.
5. What are some drivers contributing to market growth?
Rising Incidence of Infectious Diseases and Genetic Disorders; Growing Geriatric Population; Increasing Focus on Human Genome Projects.
6. What are the notable trends driving market growth?
Dye-Based qPCR Reagents are Expected to Dominate the Market.
7. Are there any restraints impacting market growth?
High Cost of Reagents and qPCR Equipment; Lack of Technical Expertise to Operate the qPCR instrument.
8. Can you provide examples of recent developments in the market?
November 2022: PCR Biosystems launched a new family of qPCR reagent mixes: Clara Probe Mix, Clara Probe 1-Step Mix, and Clara HRM Mix. The cutting-edge Clara family of mixes relies on a novel composition to push the boundaries of performance to meet the challenges of laboratories.
9. What pricing options are available for accessing the report?
Pricing options include single-user, multi-user, and enterprise licenses priced at USD 4750, USD 5250, and USD 8750 respectively.
10. Is the market size provided in terms of value or volume?
The market size is provided in terms of value, measured in Million.
11. Are there any specific market keywords associated with the report?
Yes, the market keyword associated with the report is "qPCR Reagent Industry," which aids in identifying and referencing the specific market segment covered.
12. How do I determine which pricing option suits my needs best?
The pricing options vary based on user requirements and access needs. Individual users may opt for single-user licenses, while businesses requiring broader access may choose multi-user or enterprise licenses for cost-effective access to the report.
13. Are there any additional resources or data provided in the qPCR Reagent Industry report?
While the report offers comprehensive insights, it's advisable to review the specific contents or supplementary materials provided to ascertain if additional resources or data are available.
14. How can I stay updated on further developments or reports in the qPCR Reagent Industry?
To stay informed about further developments, trends, and reports in the qPCR Reagent Industry, consider subscribing to industry newsletters, following relevant companies and organizations, or regularly checking reputable industry news sources and publications.
Methodology
Step 1 - Identification of Relevant Samples Size from Population Database


Step 2 - Approaches for Defining Global Market Size (Value, Volume* & Price*)

Note*: In applicable scenarios
Step 3 - Data Sources
Primary Research
- Web Analytics
- Survey Reports
- Research Institute
- Latest Research Reports
- Opinion Leaders
Secondary Research
- Annual Reports
- White Paper
- Latest Press Release
- Industry Association
- Paid Database
- Investor Presentations

Step 4 - Data Triangulation
Involves using different sources of information in order to increase the validity of a study
These sources are likely to be stakeholders in a program - participants, other researchers, program staff, other community members, and so on.
Then we put all data in single framework & apply various statistical tools to find out the dynamic on the market.
During the analysis stage, feedback from the stakeholder groups would be compared to determine areas of agreement as well as areas of divergence
