

Key Insights
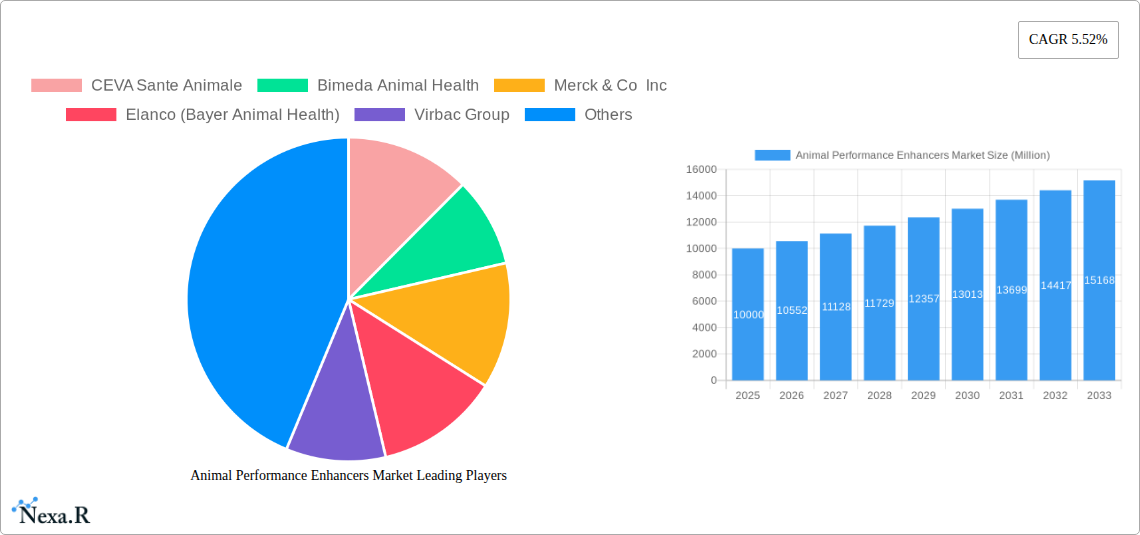
The global animal performance enhancers market is experiencing robust growth, driven by the increasing demand for high-quality animal protein and the rising adoption of intensive farming practices. A 5.52% CAGR indicates a significant expansion, projecting substantial market value increases over the forecast period (2025-2033). This growth is fueled by several factors. Firstly, the growing global population necessitates increased animal protein production, leading to a greater reliance on performance enhancers to optimize animal health and productivity. Secondly, advancements in animal health technologies and the development of innovative, more effective enhancers contribute to market expansion. The segment focusing on livestock is expected to dominate, owing to its larger scale and the significant economic impact of improving livestock yields. However, the companion animal segment is also experiencing notable growth, reflecting increased pet ownership and rising concerns about pet health and well-being. While regulatory hurdles and potential concerns regarding the long-term effects of certain enhancers represent restraints, the overall market outlook remains positive, with considerable investment in research and development expected to further fuel innovation and market expansion.
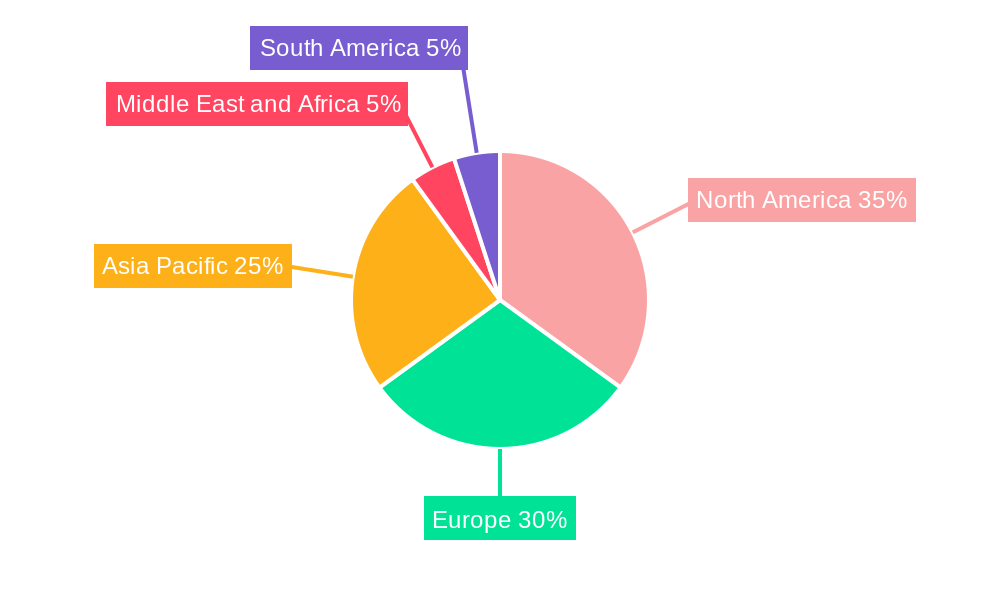
Regional variations in market growth are anticipated, with North America and Europe maintaining strong positions due to established animal health infrastructure and high per capita animal ownership. However, the Asia-Pacific region is projected to exhibit the fastest growth rate, driven by the expanding livestock industry and increasing demand for animal-sourced food in rapidly developing economies such as China and India. The competitive landscape is characterized by the presence of both multinational pharmaceutical giants and specialized animal health companies, fostering intense competition and continuous innovation. Key players are focused on developing novel products, expanding their geographical reach, and strategic acquisitions to strengthen their market position. The market's future trajectory will likely be influenced by evolving consumer preferences for sustainably produced animal products, increasing regulatory scrutiny, and the development of more environmentally friendly performance enhancers.
Animal Performance Enhancers Market: A Comprehensive Report (2019-2033)
This comprehensive report provides a detailed analysis of the Animal Performance Enhancers market, encompassing market dynamics, growth trends, regional performance, product landscape, key players, and future outlook. The study covers the period from 2019 to 2033, with 2025 serving as the base and estimated year. This report is essential for industry professionals, investors, and strategic decision-makers seeking to understand and capitalize on opportunities within this dynamic sector. The parent market is the animal health market, and this report specifically focuses on the child market of performance enhancing products for animals. The total market value is predicted to reach xx Million by 2033.
Animal Performance Enhancers Market Market Dynamics & Structure
The Animal Performance Enhancers market is characterized by moderate concentration, with several multinational corporations holding significant market share. Technological innovation, primarily focused on improving efficacy and reducing side effects, is a key driver. Stringent regulatory frameworks governing the use of performance enhancers vary across regions, influencing market growth. Competitive pressures from substitute products and the emergence of natural alternatives are notable factors. The market is segmented by application (growth promotors, performance enhancers, other applications) and animal type (companion animals, livestock). M&A activity is relatively frequent, reflecting consolidation within the industry.
- Market Concentration: Moderately concentrated, with top 5 players holding approximately xx% market share in 2024.
- Technological Innovation: Focus on improved efficacy, reduced side effects, and targeted delivery systems.
- Regulatory Landscape: Stringent regulations vary across geographies, posing challenges for market expansion.
- Competitive Substitutes: Natural alternatives and other performance-enhancing strategies present competitive pressure.
- End-User Demographics: Increasing demand from livestock farming and growing companion animal ownership drives market growth.
- M&A Trends: Moderate level of M&A activity, with xx major deals observed during the historical period (2019-2024).
Animal Performance Enhancers Market Growth Trends & Insights
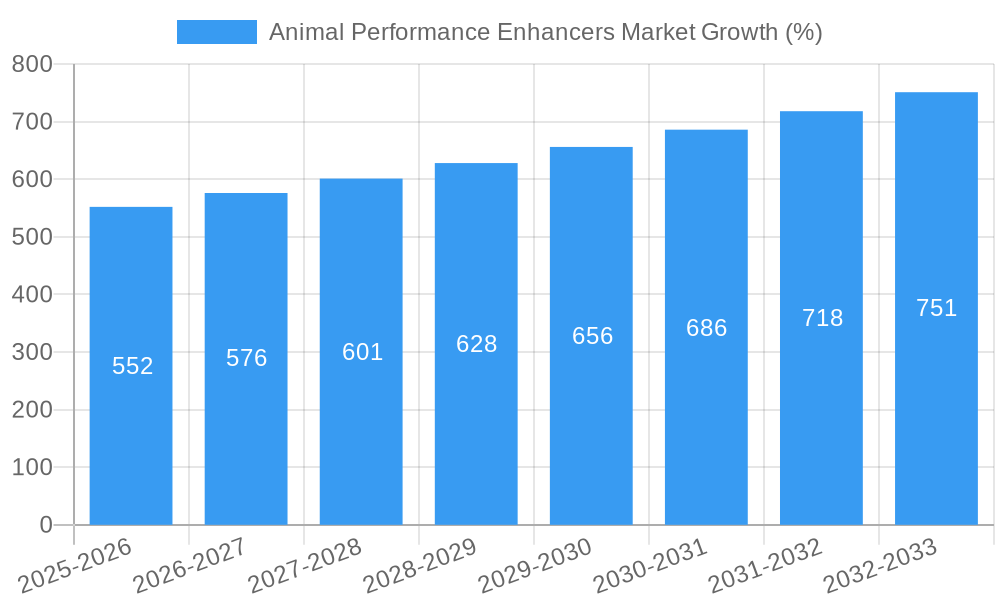
The Animal Performance Enhancers market experienced steady growth during the historical period (2019-2024), driven by increased demand for livestock products and rising pet ownership. The market size was valued at xx Million in 2024, and is projected to witness a Compound Annual Growth Rate (CAGR) of xx% during the forecast period (2025-2033), reaching xx Million by 2033. This growth is attributed to several factors, including advancements in product formulations, rising awareness of animal health and welfare, and increasing adoption of performance enhancement strategies in both livestock and companion animal sectors. Technological disruptions, such as the development of novel delivery systems and precision animal nutrition, are further propelling market expansion. Consumer behavior is shifting towards preference for safe, effective, and ethically sourced products, creating opportunities for innovative solutions. Market penetration is highest in developed regions, with significant growth potential in developing economies. The adoption rate of performance enhancers is expected to increase steadily, driven by technological improvements and supportive government policies in certain regions.
Dominant Regions, Countries, or Segments in Animal Performance Enhancers Market
North America currently holds the largest market share in the Animal Performance Enhancers market, followed by Europe. The dominance of these regions is attributable to factors such as established animal health infrastructure, stringent regulatory frameworks, high per capita animal ownership, and significant investments in animal health research and development. However, Asia-Pacific is projected to exhibit the highest growth rate during the forecast period driven by increasing livestock production and rising pet ownership in emerging economies.
By Application: The growth promotors segment currently dominates the market due to widespread usage in livestock farming.
By Animal Type: Livestock represents a larger market segment compared to companion animals, owing to the greater scale of production and economic implications of improving livestock performance.
- Key Drivers (North America & Europe): Strong regulatory frameworks, high awareness of animal welfare, and advanced technological infrastructure.
- Key Drivers (Asia-Pacific): Rapidly growing livestock industry, increasing disposable incomes, and rising pet ownership.
- Market Share: North America (xx%), Europe (xx%), Asia-Pacific (xx%), Rest of World (xx%) in 2024.
Animal Performance Enhancers Market Product Landscape
The Animal Performance Enhancers market offers a diverse range of products, including feed additives, injectables, and topical applications. Innovation focuses on developing products with enhanced efficacy, improved bioavailability, reduced side effects, and targeted delivery systems. Products are tailored to meet specific animal needs and production goals, with a growing emphasis on natural and sustainable options. Unique selling propositions often include improved animal performance metrics, such as increased weight gain, enhanced reproductive efficiency, and improved overall health. Technological advancements in areas like targeted drug delivery and precision nutrition are shaping the future of the product landscape.
Key Drivers, Barriers & Challenges in Animal Performance Enhancers Market
Key Drivers:
- Rising demand for animal protein globally
- Increasing awareness of animal health and welfare
- Technological advancements in product development and delivery systems
- Government support and incentives for improving livestock productivity
Challenges & Restraints:
- Stringent regulatory approvals and compliance requirements
- Concerns regarding potential health risks and environmental impact
- Fluctuations in raw material prices and supply chain disruptions
- Competition from alternative performance enhancing solutions (estimated to impact market growth by xx% by 2033).
Emerging Opportunities in Animal Performance Enhancers Market
- Growing demand for sustainable and ethically sourced products
- Expansion into developing markets with high growth potential
- Development of novel delivery systems and formulations
- Focus on improving animal health and welfare through targeted interventions.
Growth Accelerators in the Animal Performance Enhancers Market Industry
Long-term growth will be driven by continuous innovation in product development, strategic partnerships between animal health companies and technology providers, and expansion into new geographical markets. Technological breakthroughs in areas such as personalized medicine and precision nutrition will further enhance the market's growth trajectory. Strategic acquisitions and collaborations will play a significant role in expanding market reach and product portfolios. The increasing focus on improving animal health and welfare will present opportunities for innovative solutions that address specific needs and challenges across different animal species.
Key Players Shaping the Animal Performance Enhancers Market Market
- CEVA Sante Animale
- Bimeda Animal Health
- Merck & Co Inc
- Elanco (Bayer Animal Health)
- Virbac Group
- Soparfin SCA (Vetiquinol)
- Jurox Pty Ltd
- Syntex SA
- HIPRA Animal Health
- Boehringer Ingelheim
- Huvepharma
- Zoetis Inc
Notable Milestones in Animal Performance Enhancers Market Sector
- July 2021: ADM launched a customized antibiotic reduction program, promoting holistic approaches to animal health.
- March 2022: A project launched in Tamil Nadu focused on reducing the calving interval of Kangayam cows, showcasing interest in improving livestock productivity.
- September 2022: Merck Animal Health's acquisition of Vence signaled consolidation within the animal health sector.
In-Depth Animal Performance Enhancers Market Market Outlook
The Animal Performance Enhancers market presents significant long-term growth potential, fueled by a confluence of factors including rising global demand for animal products, advancements in animal health technologies, and a growing awareness of animal welfare. Strategic partnerships, innovative product development, and expansion into emerging markets offer lucrative opportunities for market players. Companies focusing on sustainable and ethically sourced solutions are poised to gain a competitive edge. The continued adoption of data-driven approaches to animal management will further drive market growth in the years to come.
Animal Performance Enhancers Market Segmentation
-
1. Application
- 1.1. Growth Promotors
- 1.2. Performance Enhancers
- 1.3. Other Applications
-
2. Animals
- 2.1. Companion Animals
- 2.2. Livestock
Animal Performance Enhancers Market Segmentation By Geography
-
1. North America
- 1.1. United States
- 1.2. Canada
- 1.3. Mexico
-
2. Europe
- 2.1. Germany
- 2.2. United Kingdom
- 2.3. France
- 2.4. Italy
- 2.5. Spain
- 2.6. Rest of Europe
-
3. Asia Pacific
- 3.1. China
- 3.2. Japan
- 3.3. India
- 3.4. Australia
- 3.5. South Korea
- 3.6. Rest of Asia Pacific
-
4. Middle East and Africa
- 4.1. GCC
- 4.2. South Africa
- 4.3. Rest of Middle East and Africa
-
5. South America
- 5.1. Brazil
- 5.2. Argentina
- 5.3. Rest of South America
Animal Performance Enhancers Market REPORT HIGHLIGHTS
| Aspects | Details |
|---|---|
| Study Period | 2019-2033 |
| Base Year | 2024 |
| Estimated Year | 2025 |
| Forecast Period | 2025-2033 |
| Historical Period | 2019-2024 |
| Growth Rate | CAGR of 5.52% from 2019-2033 |
| Segmentation |
|
Table of Contents
- 1. Introduction
- 1.1. Research Scope
- 1.2. Market Segmentation
- 1.3. Research Methodology
- 1.4. Definitions and Assumptions
- 2. Executive Summary
- 2.1. Introduction
- 3. Market Dynamics
- 3.1. Introduction
- 3.2. Market Drivers
- 3.2.1. Growing Burden of Hormonal Deficiency Diseases in Animals; Rising Demand For Meat; Increase in Animal Husbandry
- 3.3. Market Restrains
- 3.3.1. Side Effects Associated With Use of Animal Hormones; Stringent Government Regulations Associated With Animal Hormones
- 3.4. Market Trends
- 3.4.1. Livestock Animal Segment is Expected to Witness Growth Over the Forecast Period
- 4. Market Factor Analysis
- 4.1. Porters Five Forces
- 4.2. Supply/Value Chain
- 4.3. PESTEL analysis
- 4.4. Market Entropy
- 4.5. Patent/Trademark Analysis
- 5. Global Animal Performance Enhancers Market Analysis, Insights and Forecast, 2019-2031
- 5.1. Market Analysis, Insights and Forecast - by Application
- 5.1.1. Growth Promotors
- 5.1.2. Performance Enhancers
- 5.1.3. Other Applications
- 5.2. Market Analysis, Insights and Forecast - by Animals
- 5.2.1. Companion Animals
- 5.2.2. Livestock
- 5.3. Market Analysis, Insights and Forecast - by Region
- 5.3.1. North America
- 5.3.2. Europe
- 5.3.3. Asia Pacific
- 5.3.4. Middle East and Africa
- 5.3.5. South America
- 5.1. Market Analysis, Insights and Forecast - by Application
- 6. North America Animal Performance Enhancers Market Analysis, Insights and Forecast, 2019-2031
- 6.1. Market Analysis, Insights and Forecast - by Application
- 6.1.1. Growth Promotors
- 6.1.2. Performance Enhancers
- 6.1.3. Other Applications
- 6.2. Market Analysis, Insights and Forecast - by Animals
- 6.2.1. Companion Animals
- 6.2.2. Livestock
- 6.1. Market Analysis, Insights and Forecast - by Application
- 7. Europe Animal Performance Enhancers Market Analysis, Insights and Forecast, 2019-2031
- 7.1. Market Analysis, Insights and Forecast - by Application
- 7.1.1. Growth Promotors
- 7.1.2. Performance Enhancers
- 7.1.3. Other Applications
- 7.2. Market Analysis, Insights and Forecast - by Animals
- 7.2.1. Companion Animals
- 7.2.2. Livestock
- 7.1. Market Analysis, Insights and Forecast - by Application
- 8. Asia Pacific Animal Performance Enhancers Market Analysis, Insights and Forecast, 2019-2031
- 8.1. Market Analysis, Insights and Forecast - by Application
- 8.1.1. Growth Promotors
- 8.1.2. Performance Enhancers
- 8.1.3. Other Applications
- 8.2. Market Analysis, Insights and Forecast - by Animals
- 8.2.1. Companion Animals
- 8.2.2. Livestock
- 8.1. Market Analysis, Insights and Forecast - by Application
- 9. Middle East and Africa Animal Performance Enhancers Market Analysis, Insights and Forecast, 2019-2031
- 9.1. Market Analysis, Insights and Forecast - by Application
- 9.1.1. Growth Promotors
- 9.1.2. Performance Enhancers
- 9.1.3. Other Applications
- 9.2. Market Analysis, Insights and Forecast - by Animals
- 9.2.1. Companion Animals
- 9.2.2. Livestock
- 9.1. Market Analysis, Insights and Forecast - by Application
- 10. South America Animal Performance Enhancers Market Analysis, Insights and Forecast, 2019-2031
- 10.1. Market Analysis, Insights and Forecast - by Application
- 10.1.1. Growth Promotors
- 10.1.2. Performance Enhancers
- 10.1.3. Other Applications
- 10.2. Market Analysis, Insights and Forecast - by Animals
- 10.2.1. Companion Animals
- 10.2.2. Livestock
- 10.1. Market Analysis, Insights and Forecast - by Application
- 11. North America Animal Performance Enhancers Market Analysis, Insights and Forecast, 2019-2031
- 11.1. Market Analysis, Insights and Forecast - By Country/Sub-region
- 11.1.1 United States
- 11.1.2 Canada
- 11.1.3 Mexico
- 12. Europe Animal Performance Enhancers Market Analysis, Insights and Forecast, 2019-2031
- 12.1. Market Analysis, Insights and Forecast - By Country/Sub-region
- 12.1.1 Germany
- 12.1.2 United Kingdom
- 12.1.3 France
- 12.1.4 Italy
- 12.1.5 Spain
- 12.1.6 Rest of Europe
- 13. Asia Pacific Animal Performance Enhancers Market Analysis, Insights and Forecast, 2019-2031
- 13.1. Market Analysis, Insights and Forecast - By Country/Sub-region
- 13.1.1 China
- 13.1.2 Japan
- 13.1.3 India
- 13.1.4 Australia
- 13.1.5 South Korea
- 13.1.6 Rest of Asia Pacific
- 14. Middle East and Africa Animal Performance Enhancers Market Analysis, Insights and Forecast, 2019-2031
- 14.1. Market Analysis, Insights and Forecast - By Country/Sub-region
- 14.1.1 GCC
- 14.1.2 South Africa
- 14.1.3 Rest of Middle East and Africa
- 15. South America Animal Performance Enhancers Market Analysis, Insights and Forecast, 2019-2031
- 15.1. Market Analysis, Insights and Forecast - By Country/Sub-region
- 15.1.1 Brazil
- 15.1.2 Argentina
- 15.1.3 Rest of South America
- 16. Competitive Analysis
- 16.1. Global Market Share Analysis 2024
- 16.2. Company Profiles
- 16.2.1 CEVA Sante Animale
- 16.2.1.1. Overview
- 16.2.1.2. Products
- 16.2.1.3. SWOT Analysis
- 16.2.1.4. Recent Developments
- 16.2.1.5. Financials (Based on Availability)
- 16.2.2 Bimeda Animal Health
- 16.2.2.1. Overview
- 16.2.2.2. Products
- 16.2.2.3. SWOT Analysis
- 16.2.2.4. Recent Developments
- 16.2.2.5. Financials (Based on Availability)
- 16.2.3 Merck & Co Inc
- 16.2.3.1. Overview
- 16.2.3.2. Products
- 16.2.3.3. SWOT Analysis
- 16.2.3.4. Recent Developments
- 16.2.3.5. Financials (Based on Availability)
- 16.2.4 Elanco (Bayer Animal Health)
- 16.2.4.1. Overview
- 16.2.4.2. Products
- 16.2.4.3. SWOT Analysis
- 16.2.4.4. Recent Developments
- 16.2.4.5. Financials (Based on Availability)
- 16.2.5 Virbac Group
- 16.2.5.1. Overview
- 16.2.5.2. Products
- 16.2.5.3. SWOT Analysis
- 16.2.5.4. Recent Developments
- 16.2.5.5. Financials (Based on Availability)
- 16.2.6 Soparfin SCA (Vetiquinol)
- 16.2.6.1. Overview
- 16.2.6.2. Products
- 16.2.6.3. SWOT Analysis
- 16.2.6.4. Recent Developments
- 16.2.6.5. Financials (Based on Availability)
- 16.2.7 Jurox Pty Ltd
- 16.2.7.1. Overview
- 16.2.7.2. Products
- 16.2.7.3. SWOT Analysis
- 16.2.7.4. Recent Developments
- 16.2.7.5. Financials (Based on Availability)
- 16.2.8 Syntex SA
- 16.2.8.1. Overview
- 16.2.8.2. Products
- 16.2.8.3. SWOT Analysis
- 16.2.8.4. Recent Developments
- 16.2.8.5. Financials (Based on Availability)
- 16.2.9 HIPRA Animal Health
- 16.2.9.1. Overview
- 16.2.9.2. Products
- 16.2.9.3. SWOT Analysis
- 16.2.9.4. Recent Developments
- 16.2.9.5. Financials (Based on Availability)
- 16.2.10 Boehringer Ingelheim
- 16.2.10.1. Overview
- 16.2.10.2. Products
- 16.2.10.3. SWOT Analysis
- 16.2.10.4. Recent Developments
- 16.2.10.5. Financials (Based on Availability)
- 16.2.11 Huvepharma
- 16.2.11.1. Overview
- 16.2.11.2. Products
- 16.2.11.3. SWOT Analysis
- 16.2.11.4. Recent Developments
- 16.2.11.5. Financials (Based on Availability)
- 16.2.12 Zoetis Inc
- 16.2.12.1. Overview
- 16.2.12.2. Products
- 16.2.12.3. SWOT Analysis
- 16.2.12.4. Recent Developments
- 16.2.12.5. Financials (Based on Availability)
- 16.2.1 CEVA Sante Animale
List of Figures
- Figure 1: Global Animal Performance Enhancers Market Revenue Breakdown (Million, %) by Region 2024 & 2032
- Figure 2: Global Animal Performance Enhancers Market Volume Breakdown (K Unit, %) by Region 2024 & 2032
- Figure 3: North America Animal Performance Enhancers Market Revenue (Million), by Country 2024 & 2032
- Figure 4: North America Animal Performance Enhancers Market Volume (K Unit), by Country 2024 & 2032
- Figure 5: North America Animal Performance Enhancers Market Revenue Share (%), by Country 2024 & 2032
- Figure 6: North America Animal Performance Enhancers Market Volume Share (%), by Country 2024 & 2032
- Figure 7: Europe Animal Performance Enhancers Market Revenue (Million), by Country 2024 & 2032
- Figure 8: Europe Animal Performance Enhancers Market Volume (K Unit), by Country 2024 & 2032
- Figure 9: Europe Animal Performance Enhancers Market Revenue Share (%), by Country 2024 & 2032
- Figure 10: Europe Animal Performance Enhancers Market Volume Share (%), by Country 2024 & 2032
- Figure 11: Asia Pacific Animal Performance Enhancers Market Revenue (Million), by Country 2024 & 2032
- Figure 12: Asia Pacific Animal Performance Enhancers Market Volume (K Unit), by Country 2024 & 2032
- Figure 13: Asia Pacific Animal Performance Enhancers Market Revenue Share (%), by Country 2024 & 2032
- Figure 14: Asia Pacific Animal Performance Enhancers Market Volume Share (%), by Country 2024 & 2032
- Figure 15: Middle East and Africa Animal Performance Enhancers Market Revenue (Million), by Country 2024 & 2032
- Figure 16: Middle East and Africa Animal Performance Enhancers Market Volume (K Unit), by Country 2024 & 2032
- Figure 17: Middle East and Africa Animal Performance Enhancers Market Revenue Share (%), by Country 2024 & 2032
- Figure 18: Middle East and Africa Animal Performance Enhancers Market Volume Share (%), by Country 2024 & 2032
- Figure 19: South America Animal Performance Enhancers Market Revenue (Million), by Country 2024 & 2032
- Figure 20: South America Animal Performance Enhancers Market Volume (K Unit), by Country 2024 & 2032
- Figure 21: South America Animal Performance Enhancers Market Revenue Share (%), by Country 2024 & 2032
- Figure 22: South America Animal Performance Enhancers Market Volume Share (%), by Country 2024 & 2032
- Figure 23: North America Animal Performance Enhancers Market Revenue (Million), by Application 2024 & 2032
- Figure 24: North America Animal Performance Enhancers Market Volume (K Unit), by Application 2024 & 2032
- Figure 25: North America Animal Performance Enhancers Market Revenue Share (%), by Application 2024 & 2032
- Figure 26: North America Animal Performance Enhancers Market Volume Share (%), by Application 2024 & 2032
- Figure 27: North America Animal Performance Enhancers Market Revenue (Million), by Animals 2024 & 2032
- Figure 28: North America Animal Performance Enhancers Market Volume (K Unit), by Animals 2024 & 2032
- Figure 29: North America Animal Performance Enhancers Market Revenue Share (%), by Animals 2024 & 2032
- Figure 30: North America Animal Performance Enhancers Market Volume Share (%), by Animals 2024 & 2032
- Figure 31: North America Animal Performance Enhancers Market Revenue (Million), by Country 2024 & 2032
- Figure 32: North America Animal Performance Enhancers Market Volume (K Unit), by Country 2024 & 2032
- Figure 33: North America Animal Performance Enhancers Market Revenue Share (%), by Country 2024 & 2032
- Figure 34: North America Animal Performance Enhancers Market Volume Share (%), by Country 2024 & 2032
- Figure 35: Europe Animal Performance Enhancers Market Revenue (Million), by Application 2024 & 2032
- Figure 36: Europe Animal Performance Enhancers Market Volume (K Unit), by Application 2024 & 2032
- Figure 37: Europe Animal Performance Enhancers Market Revenue Share (%), by Application 2024 & 2032
- Figure 38: Europe Animal Performance Enhancers Market Volume Share (%), by Application 2024 & 2032
- Figure 39: Europe Animal Performance Enhancers Market Revenue (Million), by Animals 2024 & 2032
- Figure 40: Europe Animal Performance Enhancers Market Volume (K Unit), by Animals 2024 & 2032
- Figure 41: Europe Animal Performance Enhancers Market Revenue Share (%), by Animals 2024 & 2032
- Figure 42: Europe Animal Performance Enhancers Market Volume Share (%), by Animals 2024 & 2032
- Figure 43: Europe Animal Performance Enhancers Market Revenue (Million), by Country 2024 & 2032
- Figure 44: Europe Animal Performance Enhancers Market Volume (K Unit), by Country 2024 & 2032
- Figure 45: Europe Animal Performance Enhancers Market Revenue Share (%), by Country 2024 & 2032
- Figure 46: Europe Animal Performance Enhancers Market Volume Share (%), by Country 2024 & 2032
- Figure 47: Asia Pacific Animal Performance Enhancers Market Revenue (Million), by Application 2024 & 2032
- Figure 48: Asia Pacific Animal Performance Enhancers Market Volume (K Unit), by Application 2024 & 2032
- Figure 49: Asia Pacific Animal Performance Enhancers Market Revenue Share (%), by Application 2024 & 2032
- Figure 50: Asia Pacific Animal Performance Enhancers Market Volume Share (%), by Application 2024 & 2032
- Figure 51: Asia Pacific Animal Performance Enhancers Market Revenue (Million), by Animals 2024 & 2032
- Figure 52: Asia Pacific Animal Performance Enhancers Market Volume (K Unit), by Animals 2024 & 2032
- Figure 53: Asia Pacific Animal Performance Enhancers Market Revenue Share (%), by Animals 2024 & 2032
- Figure 54: Asia Pacific Animal Performance Enhancers Market Volume Share (%), by Animals 2024 & 2032
- Figure 55: Asia Pacific Animal Performance Enhancers Market Revenue (Million), by Country 2024 & 2032
- Figure 56: Asia Pacific Animal Performance Enhancers Market Volume (K Unit), by Country 2024 & 2032
- Figure 57: Asia Pacific Animal Performance Enhancers Market Revenue Share (%), by Country 2024 & 2032
- Figure 58: Asia Pacific Animal Performance Enhancers Market Volume Share (%), by Country 2024 & 2032
- Figure 59: Middle East and Africa Animal Performance Enhancers Market Revenue (Million), by Application 2024 & 2032
- Figure 60: Middle East and Africa Animal Performance Enhancers Market Volume (K Unit), by Application 2024 & 2032
- Figure 61: Middle East and Africa Animal Performance Enhancers Market Revenue Share (%), by Application 2024 & 2032
- Figure 62: Middle East and Africa Animal Performance Enhancers Market Volume Share (%), by Application 2024 & 2032
- Figure 63: Middle East and Africa Animal Performance Enhancers Market Revenue (Million), by Animals 2024 & 2032
- Figure 64: Middle East and Africa Animal Performance Enhancers Market Volume (K Unit), by Animals 2024 & 2032
- Figure 65: Middle East and Africa Animal Performance Enhancers Market Revenue Share (%), by Animals 2024 & 2032
- Figure 66: Middle East and Africa Animal Performance Enhancers Market Volume Share (%), by Animals 2024 & 2032
- Figure 67: Middle East and Africa Animal Performance Enhancers Market Revenue (Million), by Country 2024 & 2032
- Figure 68: Middle East and Africa Animal Performance Enhancers Market Volume (K Unit), by Country 2024 & 2032
- Figure 69: Middle East and Africa Animal Performance Enhancers Market Revenue Share (%), by Country 2024 & 2032
- Figure 70: Middle East and Africa Animal Performance Enhancers Market Volume Share (%), by Country 2024 & 2032
- Figure 71: South America Animal Performance Enhancers Market Revenue (Million), by Application 2024 & 2032
- Figure 72: South America Animal Performance Enhancers Market Volume (K Unit), by Application 2024 & 2032
- Figure 73: South America Animal Performance Enhancers Market Revenue Share (%), by Application 2024 & 2032
- Figure 74: South America Animal Performance Enhancers Market Volume Share (%), by Application 2024 & 2032
- Figure 75: South America Animal Performance Enhancers Market Revenue (Million), by Animals 2024 & 2032
- Figure 76: South America Animal Performance Enhancers Market Volume (K Unit), by Animals 2024 & 2032
- Figure 77: South America Animal Performance Enhancers Market Revenue Share (%), by Animals 2024 & 2032
- Figure 78: South America Animal Performance Enhancers Market Volume Share (%), by Animals 2024 & 2032
- Figure 79: South America Animal Performance Enhancers Market Revenue (Million), by Country 2024 & 2032
- Figure 80: South America Animal Performance Enhancers Market Volume (K Unit), by Country 2024 & 2032
- Figure 81: South America Animal Performance Enhancers Market Revenue Share (%), by Country 2024 & 2032
- Figure 82: South America Animal Performance Enhancers Market Volume Share (%), by Country 2024 & 2032
List of Tables
- Table 1: Global Animal Performance Enhancers Market Revenue Million Forecast, by Region 2019 & 2032
- Table 2: Global Animal Performance Enhancers Market Volume K Unit Forecast, by Region 2019 & 2032
- Table 3: Global Animal Performance Enhancers Market Revenue Million Forecast, by Application 2019 & 2032
- Table 4: Global Animal Performance Enhancers Market Volume K Unit Forecast, by Application 2019 & 2032
- Table 5: Global Animal Performance Enhancers Market Revenue Million Forecast, by Animals 2019 & 2032
- Table 6: Global Animal Performance Enhancers Market Volume K Unit Forecast, by Animals 2019 & 2032
- Table 7: Global Animal Performance Enhancers Market Revenue Million Forecast, by Region 2019 & 2032
- Table 8: Global Animal Performance Enhancers Market Volume K Unit Forecast, by Region 2019 & 2032
- Table 9: Global Animal Performance Enhancers Market Revenue Million Forecast, by Country 2019 & 2032
- Table 10: Global Animal Performance Enhancers Market Volume K Unit Forecast, by Country 2019 & 2032
- Table 11: United States Animal Performance Enhancers Market Revenue (Million) Forecast, by Application 2019 & 2032
- Table 12: United States Animal Performance Enhancers Market Volume (K Unit) Forecast, by Application 2019 & 2032
- Table 13: Canada Animal Performance Enhancers Market Revenue (Million) Forecast, by Application 2019 & 2032
- Table 14: Canada Animal Performance Enhancers Market Volume (K Unit) Forecast, by Application 2019 & 2032
- Table 15: Mexico Animal Performance Enhancers Market Revenue (Million) Forecast, by Application 2019 & 2032
- Table 16: Mexico Animal Performance Enhancers Market Volume (K Unit) Forecast, by Application 2019 & 2032
- Table 17: Global Animal Performance Enhancers Market Revenue Million Forecast, by Country 2019 & 2032
- Table 18: Global Animal Performance Enhancers Market Volume K Unit Forecast, by Country 2019 & 2032
- Table 19: Germany Animal Performance Enhancers Market Revenue (Million) Forecast, by Application 2019 & 2032
- Table 20: Germany Animal Performance Enhancers Market Volume (K Unit) Forecast, by Application 2019 & 2032
- Table 21: United Kingdom Animal Performance Enhancers Market Revenue (Million) Forecast, by Application 2019 & 2032
- Table 22: United Kingdom Animal Performance Enhancers Market Volume (K Unit) Forecast, by Application 2019 & 2032
- Table 23: France Animal Performance Enhancers Market Revenue (Million) Forecast, by Application 2019 & 2032
- Table 24: France Animal Performance Enhancers Market Volume (K Unit) Forecast, by Application 2019 & 2032
- Table 25: Italy Animal Performance Enhancers Market Revenue (Million) Forecast, by Application 2019 & 2032
- Table 26: Italy Animal Performance Enhancers Market Volume (K Unit) Forecast, by Application 2019 & 2032
- Table 27: Spain Animal Performance Enhancers Market Revenue (Million) Forecast, by Application 2019 & 2032
- Table 28: Spain Animal Performance Enhancers Market Volume (K Unit) Forecast, by Application 2019 & 2032
- Table 29: Rest of Europe Animal Performance Enhancers Market Revenue (Million) Forecast, by Application 2019 & 2032
- Table 30: Rest of Europe Animal Performance Enhancers Market Volume (K Unit) Forecast, by Application 2019 & 2032
- Table 31: Global Animal Performance Enhancers Market Revenue Million Forecast, by Country 2019 & 2032
- Table 32: Global Animal Performance Enhancers Market Volume K Unit Forecast, by Country 2019 & 2032
- Table 33: China Animal Performance Enhancers Market Revenue (Million) Forecast, by Application 2019 & 2032
- Table 34: China Animal Performance Enhancers Market Volume (K Unit) Forecast, by Application 2019 & 2032
- Table 35: Japan Animal Performance Enhancers Market Revenue (Million) Forecast, by Application 2019 & 2032
- Table 36: Japan Animal Performance Enhancers Market Volume (K Unit) Forecast, by Application 2019 & 2032
- Table 37: India Animal Performance Enhancers Market Revenue (Million) Forecast, by Application 2019 & 2032
- Table 38: India Animal Performance Enhancers Market Volume (K Unit) Forecast, by Application 2019 & 2032
- Table 39: Australia Animal Performance Enhancers Market Revenue (Million) Forecast, by Application 2019 & 2032
- Table 40: Australia Animal Performance Enhancers Market Volume (K Unit) Forecast, by Application 2019 & 2032
- Table 41: South Korea Animal Performance Enhancers Market Revenue (Million) Forecast, by Application 2019 & 2032
- Table 42: South Korea Animal Performance Enhancers Market Volume (K Unit) Forecast, by Application 2019 & 2032
- Table 43: Rest of Asia Pacific Animal Performance Enhancers Market Revenue (Million) Forecast, by Application 2019 & 2032
- Table 44: Rest of Asia Pacific Animal Performance Enhancers Market Volume (K Unit) Forecast, by Application 2019 & 2032
- Table 45: Global Animal Performance Enhancers Market Revenue Million Forecast, by Country 2019 & 2032
- Table 46: Global Animal Performance Enhancers Market Volume K Unit Forecast, by Country 2019 & 2032
- Table 47: GCC Animal Performance Enhancers Market Revenue (Million) Forecast, by Application 2019 & 2032
- Table 48: GCC Animal Performance Enhancers Market Volume (K Unit) Forecast, by Application 2019 & 2032
- Table 49: South Africa Animal Performance Enhancers Market Revenue (Million) Forecast, by Application 2019 & 2032
- Table 50: South Africa Animal Performance Enhancers Market Volume (K Unit) Forecast, by Application 2019 & 2032
- Table 51: Rest of Middle East and Africa Animal Performance Enhancers Market Revenue (Million) Forecast, by Application 2019 & 2032
- Table 52: Rest of Middle East and Africa Animal Performance Enhancers Market Volume (K Unit) Forecast, by Application 2019 & 2032
- Table 53: Global Animal Performance Enhancers Market Revenue Million Forecast, by Country 2019 & 2032
- Table 54: Global Animal Performance Enhancers Market Volume K Unit Forecast, by Country 2019 & 2032
- Table 55: Brazil Animal Performance Enhancers Market Revenue (Million) Forecast, by Application 2019 & 2032
- Table 56: Brazil Animal Performance Enhancers Market Volume (K Unit) Forecast, by Application 2019 & 2032
- Table 57: Argentina Animal Performance Enhancers Market Revenue (Million) Forecast, by Application 2019 & 2032
- Table 58: Argentina Animal Performance Enhancers Market Volume (K Unit) Forecast, by Application 2019 & 2032
- Table 59: Rest of South America Animal Performance Enhancers Market Revenue (Million) Forecast, by Application 2019 & 2032
- Table 60: Rest of South America Animal Performance Enhancers Market Volume (K Unit) Forecast, by Application 2019 & 2032
- Table 61: Global Animal Performance Enhancers Market Revenue Million Forecast, by Application 2019 & 2032
- Table 62: Global Animal Performance Enhancers Market Volume K Unit Forecast, by Application 2019 & 2032
- Table 63: Global Animal Performance Enhancers Market Revenue Million Forecast, by Animals 2019 & 2032
- Table 64: Global Animal Performance Enhancers Market Volume K Unit Forecast, by Animals 2019 & 2032
- Table 65: Global Animal Performance Enhancers Market Revenue Million Forecast, by Country 2019 & 2032
- Table 66: Global Animal Performance Enhancers Market Volume K Unit Forecast, by Country 2019 & 2032
- Table 67: United States Animal Performance Enhancers Market Revenue (Million) Forecast, by Application 2019 & 2032
- Table 68: United States Animal Performance Enhancers Market Volume (K Unit) Forecast, by Application 2019 & 2032
- Table 69: Canada Animal Performance Enhancers Market Revenue (Million) Forecast, by Application 2019 & 2032
- Table 70: Canada Animal Performance Enhancers Market Volume (K Unit) Forecast, by Application 2019 & 2032
- Table 71: Mexico Animal Performance Enhancers Market Revenue (Million) Forecast, by Application 2019 & 2032
- Table 72: Mexico Animal Performance Enhancers Market Volume (K Unit) Forecast, by Application 2019 & 2032
- Table 73: Global Animal Performance Enhancers Market Revenue Million Forecast, by Application 2019 & 2032
- Table 74: Global Animal Performance Enhancers Market Volume K Unit Forecast, by Application 2019 & 2032
- Table 75: Global Animal Performance Enhancers Market Revenue Million Forecast, by Animals 2019 & 2032
- Table 76: Global Animal Performance Enhancers Market Volume K Unit Forecast, by Animals 2019 & 2032
- Table 77: Global Animal Performance Enhancers Market Revenue Million Forecast, by Country 2019 & 2032
- Table 78: Global Animal Performance Enhancers Market Volume K Unit Forecast, by Country 2019 & 2032
- Table 79: Germany Animal Performance Enhancers Market Revenue (Million) Forecast, by Application 2019 & 2032
- Table 80: Germany Animal Performance Enhancers Market Volume (K Unit) Forecast, by Application 2019 & 2032
- Table 81: United Kingdom Animal Performance Enhancers Market Revenue (Million) Forecast, by Application 2019 & 2032
- Table 82: United Kingdom Animal Performance Enhancers Market Volume (K Unit) Forecast, by Application 2019 & 2032
- Table 83: France Animal Performance Enhancers Market Revenue (Million) Forecast, by Application 2019 & 2032
- Table 84: France Animal Performance Enhancers Market Volume (K Unit) Forecast, by Application 2019 & 2032
- Table 85: Italy Animal Performance Enhancers Market Revenue (Million) Forecast, by Application 2019 & 2032
- Table 86: Italy Animal Performance Enhancers Market Volume (K Unit) Forecast, by Application 2019 & 2032
- Table 87: Spain Animal Performance Enhancers Market Revenue (Million) Forecast, by Application 2019 & 2032
- Table 88: Spain Animal Performance Enhancers Market Volume (K Unit) Forecast, by Application 2019 & 2032
- Table 89: Rest of Europe Animal Performance Enhancers Market Revenue (Million) Forecast, by Application 2019 & 2032
- Table 90: Rest of Europe Animal Performance Enhancers Market Volume (K Unit) Forecast, by Application 2019 & 2032
- Table 91: Global Animal Performance Enhancers Market Revenue Million Forecast, by Application 2019 & 2032
- Table 92: Global Animal Performance Enhancers Market Volume K Unit Forecast, by Application 2019 & 2032
- Table 93: Global Animal Performance Enhancers Market Revenue Million Forecast, by Animals 2019 & 2032
- Table 94: Global Animal Performance Enhancers Market Volume K Unit Forecast, by Animals 2019 & 2032
- Table 95: Global Animal Performance Enhancers Market Revenue Million Forecast, by Country 2019 & 2032
- Table 96: Global Animal Performance Enhancers Market Volume K Unit Forecast, by Country 2019 & 2032
- Table 97: China Animal Performance Enhancers Market Revenue (Million) Forecast, by Application 2019 & 2032
- Table 98: China Animal Performance Enhancers Market Volume (K Unit) Forecast, by Application 2019 & 2032
- Table 99: Japan Animal Performance Enhancers Market Revenue (Million) Forecast, by Application 2019 & 2032
- Table 100: Japan Animal Performance Enhancers Market Volume (K Unit) Forecast, by Application 2019 & 2032
- Table 101: India Animal Performance Enhancers Market Revenue (Million) Forecast, by Application 2019 & 2032
- Table 102: India Animal Performance Enhancers Market Volume (K Unit) Forecast, by Application 2019 & 2032
- Table 103: Australia Animal Performance Enhancers Market Revenue (Million) Forecast, by Application 2019 & 2032
- Table 104: Australia Animal Performance Enhancers Market Volume (K Unit) Forecast, by Application 2019 & 2032
- Table 105: South Korea Animal Performance Enhancers Market Revenue (Million) Forecast, by Application 2019 & 2032
- Table 106: South Korea Animal Performance Enhancers Market Volume (K Unit) Forecast, by Application 2019 & 2032
- Table 107: Rest of Asia Pacific Animal Performance Enhancers Market Revenue (Million) Forecast, by Application 2019 & 2032
- Table 108: Rest of Asia Pacific Animal Performance Enhancers Market Volume (K Unit) Forecast, by Application 2019 & 2032
- Table 109: Global Animal Performance Enhancers Market Revenue Million Forecast, by Application 2019 & 2032
- Table 110: Global Animal Performance Enhancers Market Volume K Unit Forecast, by Application 2019 & 2032
- Table 111: Global Animal Performance Enhancers Market Revenue Million Forecast, by Animals 2019 & 2032
- Table 112: Global Animal Performance Enhancers Market Volume K Unit Forecast, by Animals 2019 & 2032
- Table 113: Global Animal Performance Enhancers Market Revenue Million Forecast, by Country 2019 & 2032
- Table 114: Global Animal Performance Enhancers Market Volume K Unit Forecast, by Country 2019 & 2032
- Table 115: GCC Animal Performance Enhancers Market Revenue (Million) Forecast, by Application 2019 & 2032
- Table 116: GCC Animal Performance Enhancers Market Volume (K Unit) Forecast, by Application 2019 & 2032
- Table 117: South Africa Animal Performance Enhancers Market Revenue (Million) Forecast, by Application 2019 & 2032
- Table 118: South Africa Animal Performance Enhancers Market Volume (K Unit) Forecast, by Application 2019 & 2032
- Table 119: Rest of Middle East and Africa Animal Performance Enhancers Market Revenue (Million) Forecast, by Application 2019 & 2032
- Table 120: Rest of Middle East and Africa Animal Performance Enhancers Market Volume (K Unit) Forecast, by Application 2019 & 2032
- Table 121: Global Animal Performance Enhancers Market Revenue Million Forecast, by Application 2019 & 2032
- Table 122: Global Animal Performance Enhancers Market Volume K Unit Forecast, by Application 2019 & 2032
- Table 123: Global Animal Performance Enhancers Market Revenue Million Forecast, by Animals 2019 & 2032
- Table 124: Global Animal Performance Enhancers Market Volume K Unit Forecast, by Animals 2019 & 2032
- Table 125: Global Animal Performance Enhancers Market Revenue Million Forecast, by Country 2019 & 2032
- Table 126: Global Animal Performance Enhancers Market Volume K Unit Forecast, by Country 2019 & 2032
- Table 127: Brazil Animal Performance Enhancers Market Revenue (Million) Forecast, by Application 2019 & 2032
- Table 128: Brazil Animal Performance Enhancers Market Volume (K Unit) Forecast, by Application 2019 & 2032
- Table 129: Argentina Animal Performance Enhancers Market Revenue (Million) Forecast, by Application 2019 & 2032
- Table 130: Argentina Animal Performance Enhancers Market Volume (K Unit) Forecast, by Application 2019 & 2032
- Table 131: Rest of South America Animal Performance Enhancers Market Revenue (Million) Forecast, by Application 2019 & 2032
- Table 132: Rest of South America Animal Performance Enhancers Market Volume (K Unit) Forecast, by Application 2019 & 2032
Frequently Asked Questions
1. What is the projected Compound Annual Growth Rate (CAGR) of the Animal Performance Enhancers Market?
The projected CAGR is approximately 5.52%.
2. Which companies are prominent players in the Animal Performance Enhancers Market?
Key companies in the market include CEVA Sante Animale, Bimeda Animal Health, Merck & Co Inc, Elanco (Bayer Animal Health), Virbac Group, Soparfin SCA (Vetiquinol), Jurox Pty Ltd, Syntex SA, HIPRA Animal Health, Boehringer Ingelheim, Huvepharma, Zoetis Inc.
3. What are the main segments of the Animal Performance Enhancers Market?
The market segments include Application, Animals.
4. Can you provide details about the market size?
The market size is estimated to be USD XX Million as of 2022.
5. What are some drivers contributing to market growth?
Growing Burden of Hormonal Deficiency Diseases in Animals; Rising Demand For Meat; Increase in Animal Husbandry.
6. What are the notable trends driving market growth?
Livestock Animal Segment is Expected to Witness Growth Over the Forecast Period.
7. Are there any restraints impacting market growth?
Side Effects Associated With Use of Animal Hormones; Stringent Government Regulations Associated With Animal Hormones.
8. Can you provide examples of recent developments in the market?
September 2022: Merck Animal Health, known as MSD Animal Health, announced it had signed a definitive agreement to acquire Vence.
9. What pricing options are available for accessing the report?
Pricing options include single-user, multi-user, and enterprise licenses priced at USD 4750, USD 5250, and USD 8750 respectively.
10. Is the market size provided in terms of value or volume?
The market size is provided in terms of value, measured in Million and volume, measured in K Unit.
11. Are there any specific market keywords associated with the report?
Yes, the market keyword associated with the report is "Animal Performance Enhancers Market," which aids in identifying and referencing the specific market segment covered.
12. How do I determine which pricing option suits my needs best?
The pricing options vary based on user requirements and access needs. Individual users may opt for single-user licenses, while businesses requiring broader access may choose multi-user or enterprise licenses for cost-effective access to the report.
13. Are there any additional resources or data provided in the Animal Performance Enhancers Market report?
While the report offers comprehensive insights, it's advisable to review the specific contents or supplementary materials provided to ascertain if additional resources or data are available.
14. How can I stay updated on further developments or reports in the Animal Performance Enhancers Market?
To stay informed about further developments, trends, and reports in the Animal Performance Enhancers Market, consider subscribing to industry newsletters, following relevant companies and organizations, or regularly checking reputable industry news sources and publications.
Methodology
Step 1 - Identification of Relevant Samples Size from Population Database


Step 2 - Approaches for Defining Global Market Size (Value, Volume* & Price*)

Note*: In applicable scenarios
Step 3 - Data Sources
Primary Research
- Web Analytics
- Survey Reports
- Research Institute
- Latest Research Reports
- Opinion Leaders
Secondary Research
- Annual Reports
- White Paper
- Latest Press Release
- Industry Association
- Paid Database
- Investor Presentations

Step 4 - Data Triangulation
Involves using different sources of information in order to increase the validity of a study
These sources are likely to be stakeholders in a program - participants, other researchers, program staff, other community members, and so on.
Then we put all data in single framework & apply various statistical tools to find out the dynamic on the market.
During the analysis stage, feedback from the stakeholder groups would be compared to determine areas of agreement as well as areas of divergence
