

Key Insights
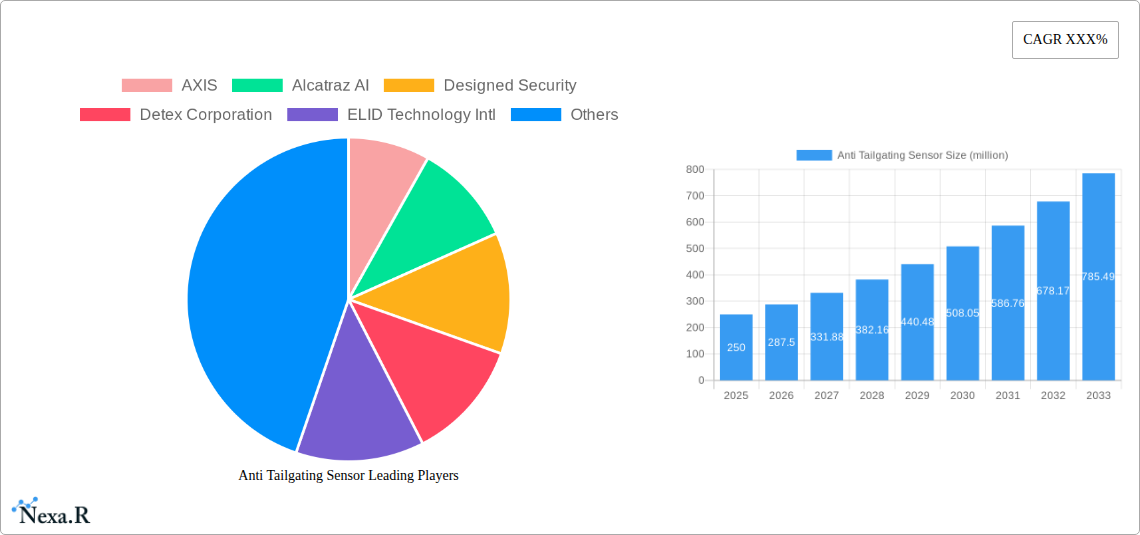
The anti-tailgating sensor market is experiencing robust growth, driven by increasing security concerns across various sectors. The market, estimated at $250 million in 2025, is projected to expand at a Compound Annual Growth Rate (CAGR) of 15% from 2025 to 2033, reaching approximately $800 million by 2033. This growth is fueled by the rising adoption of advanced security systems in commercial buildings, industrial facilities, and government infrastructure. The increasing prevalence of sophisticated threats and the need for enhanced physical access control are key drivers. Furthermore, technological advancements in sensor technology, such as improved accuracy and integration with other security systems (like video surveillance and access control systems), are contributing to market expansion. Key trends include the miniaturization of sensors, the rise of IoT-connected devices, and the increasing demand for cloud-based solutions for remote monitoring and management. While initial investment costs might act as a restraint for some organizations, the long-term benefits in terms of security and cost savings from reduced losses due to unauthorized access outweigh the initial expense.
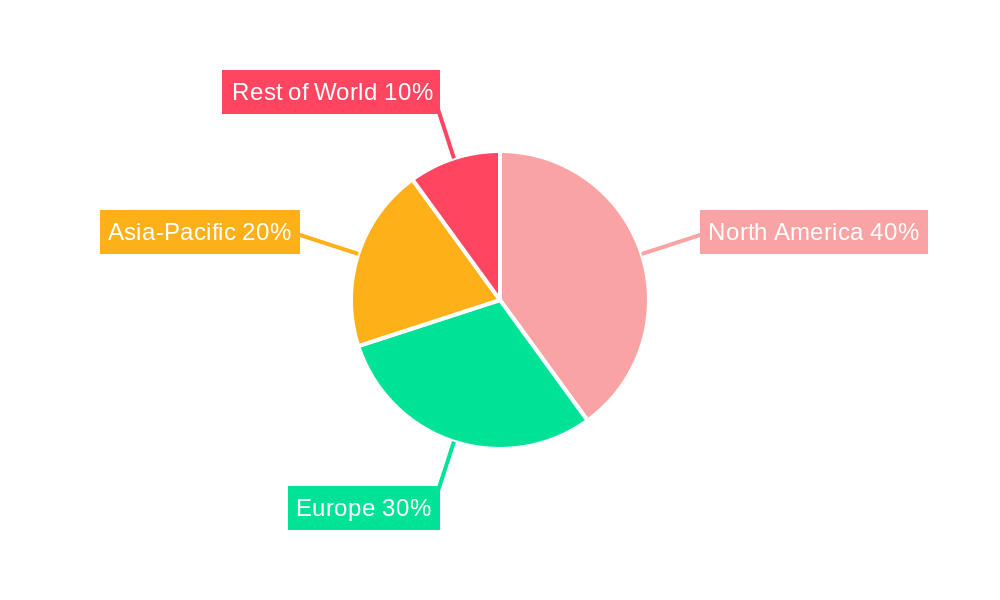
The market is segmented based on technology type (e.g., infrared, radar, video analytics), application (e.g., commercial buildings, industrial facilities, government), and region. Companies such as AXIS, Alcatraz AI, and Openpath are key players, competing on the basis of technology differentiation, features, pricing, and integration capabilities. North America currently holds a significant market share, followed by Europe and Asia-Pacific. However, Asia-Pacific is expected to show the highest growth rate during the forecast period, driven by increasing infrastructure development and rising security awareness in rapidly developing economies. The competitive landscape is dynamic, with companies focusing on strategic partnerships, product innovation, and expanding their geographic reach to maintain a competitive edge. Future growth will depend on the successful integration of anti-tailgating sensors into broader security ecosystems and the continued development of cost-effective and user-friendly solutions.
Anti Tailgating Sensor Market Report: 2019-2033
This comprehensive report provides a detailed analysis of the global Anti Tailgating Sensor market, offering invaluable insights for industry professionals, investors, and strategic decision-makers. The study period covers 2019-2033, with a base year of 2025 and a forecast period of 2025-2033. The report leverages extensive market research and data analysis to deliver a clear and actionable understanding of this rapidly evolving sector. The global market size is estimated at xx million units in 2025, projected to reach xx million units by 2033.
Anti Tailgating Sensor Market Dynamics & Structure
The Anti Tailgating Sensor market is characterized by moderate concentration, with key players vying for market share. Technological innovation, driven by advancements in sensor technology and AI-powered analytics, is a major growth driver. Stringent security regulations across various industries (parent market: Security Systems; child market: Access Control Systems) are further boosting demand. Competitive substitutes include traditional access control methods, but the superior security and efficiency of anti-tailgating sensors are steadily increasing adoption. End-user demographics span diverse sectors, including commercial buildings, industrial facilities, government institutions, and transportation hubs. M&A activity remains relatively low (xx deals in the last 5 years), indicating a focus on organic growth and product development.
- Market Concentration: Moderately concentrated, with top 5 players holding approximately xx% market share in 2025.
- Technological Innovation: Significant advancements in sensor technology (e.g., radar, infrared, and video analytics) are driving product differentiation.
- Regulatory Frameworks: Increasingly stringent security regulations are mandating the use of anti-tailgating solutions in sensitive environments.
- Competitive Substitutes: Traditional access control methods (e.g., card readers, keypads) pose a competitive threat, but with limited effectiveness against tailgating.
- End-User Demographics: Diverse sectors including commercial real estate (xx million units), industrial facilities (xx million units), and government institutions (xx million units) are driving demand.
- M&A Trends: Low M&A activity (xx deals annually), suggesting a focus on internal growth and innovation.
Anti Tailgating Sensor Growth Trends & Insights
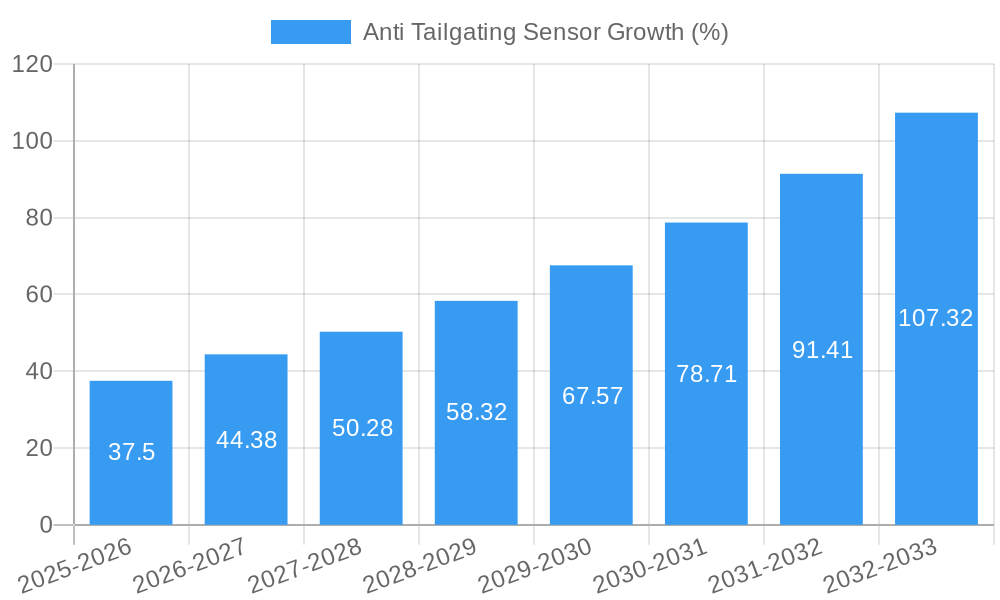
The Anti Tailgating Sensor market has experienced robust growth over the historical period (2019-2024), driven by increasing security concerns and technological advancements. The market is projected to maintain a significant CAGR of xx% during the forecast period (2025-2033), reflecting continued adoption across various sectors. Technological disruptions, such as the integration of AI and IoT capabilities, are enhancing sensor performance and creating new market opportunities. Consumer behavior shifts towards enhanced security measures, particularly in high-traffic areas, further fuel market expansion. Market penetration is currently at xx% and is expected to increase to xx% by 2033, indicating substantial untapped potential.
Dominant Regions, Countries, or Segments in Anti Tailgating Sensor
North America currently dominates the Anti Tailgating Sensor market, driven by strong security regulations, a large commercial building sector, and high technological adoption rates. This region holds an estimated xx% market share in 2025, with the U.S. leading the way. Europe and Asia-Pacific are also experiencing significant growth, propelled by rising security concerns and infrastructure development.
- Key Drivers in North America: Stringent security standards, high disposable income, advanced technological infrastructure, and significant investment in commercial real estate development.
- Key Drivers in Europe: Increasing adoption of smart building technologies, supportive government policies for security enhancements, and a focus on improving workplace security.
- Key Drivers in Asia-Pacific: Rapid urbanization, industrialization, and a rising demand for security solutions in emerging economies.
Anti Tailgating Sensor Product Landscape
Anti-tailgating sensors encompass various technologies, including radar, infrared, and video analytics systems. These sensors offer advanced features like real-time alerts, integrated access control systems, and data analytics capabilities. Key innovations include enhanced accuracy, improved reliability, and the integration of AI-powered analytics for more effective tailgating prevention. Unique selling propositions focus on ease of installation, seamless integration with existing security systems, and cost-effectiveness.
Key Drivers, Barriers & Challenges in Anti Tailgating Sensor
Key Drivers: Increasing security concerns, stringent regulations, technological advancements (AI, IoT integration), and rising demand for sophisticated access control systems across various sectors.
Challenges: High initial investment costs, integration complexities with existing systems, potential for false alarms, and the need for specialized technical expertise for installation and maintenance. Supply chain disruptions and the availability of skilled labor can also impact market growth.
Emerging Opportunities in Anti Tailgating Sensor
Emerging opportunities lie in the integration of anti-tailgating sensors with other security technologies (e.g., facial recognition, biometric authentication) to create holistic security solutions. Untapped markets include smaller businesses and residential settings. The growing adoption of smart city initiatives also presents significant potential for market expansion.
Growth Accelerators in the Anti Tailgating Sensor Industry
Technological breakthroughs, strategic partnerships, and market expansion into new sectors (e.g., healthcare, transportation) are crucial growth catalysts. The development of cost-effective solutions and the simplification of installation procedures can further fuel market penetration.
Key Players Shaping the Anti Tailgating Sensor Market
- AXIS
- Alcatraz AI
- Designed Security
- Detex Corporation
- ELID Technology Intl
- Hayward Turnstiles
- IEE Smart Sensing Solution
- Infrared Integrated Systems
- Integrated Design Limited (IDL)
- Kouba Systems
- Meesons Safe Secure Access
- Newton Security
- Openpath
- Optex
- Passport Technologies Inc.
Notable Milestones in Anti Tailgating Sensor Sector
- 2020: Launch of AI-powered anti-tailgating sensor by [Company Name] significantly improves accuracy and reduces false alarms.
- 2022: Partnership between [Company A] and [Company B] to integrate anti-tailgating sensors with facial recognition technology.
- 2023: New regulations in [Region] mandate the use of anti-tailgating sensors in high-security environments.
In-Depth Anti Tailgating Sensor Market Outlook
The future of the Anti Tailgating Sensor market appears bright, with continued growth driven by technological advancements, increasing security awareness, and expanding applications across diverse sectors. Strategic partnerships, focus on innovation, and development of cost-effective solutions will be key success factors for market players. The market is poised for substantial expansion, presenting significant opportunities for both established players and new entrants.
Anti Tailgating Sensor Segmentation
-
1. Application
- 1.1. Residential
- 1.2. Commercial
- 1.3. Others
-
2. Type
- 2.1. 2D
- 2.2. 3D
Anti Tailgating Sensor Segmentation By Geography
-
1. North America
- 1.1. United States
- 1.2. Canada
- 1.3. Mexico
-
2. South America
- 2.1. Brazil
- 2.2. Argentina
- 2.3. Rest of South America
-
3. Europe
- 3.1. United Kingdom
- 3.2. Germany
- 3.3. France
- 3.4. Italy
- 3.5. Spain
- 3.6. Russia
- 3.7. Benelux
- 3.8. Nordics
- 3.9. Rest of Europe
-
4. Middle East & Africa
- 4.1. Turkey
- 4.2. Israel
- 4.3. GCC
- 4.4. North Africa
- 4.5. South Africa
- 4.6. Rest of Middle East & Africa
-
5. Asia Pacific
- 5.1. China
- 5.2. India
- 5.3. Japan
- 5.4. South Korea
- 5.5. ASEAN
- 5.6. Oceania
- 5.7. Rest of Asia Pacific
Anti Tailgating Sensor REPORT HIGHLIGHTS
| Aspects | Details |
|---|---|
| Study Period | 2019-2033 |
| Base Year | 2024 |
| Estimated Year | 2025 |
| Forecast Period | 2025-2033 |
| Historical Period | 2019-2024 |
| Growth Rate | CAGR of XXX% from 2019-2033 |
| Segmentation |
|
Table of Contents
- 1. Introduction
- 1.1. Research Scope
- 1.2. Market Segmentation
- 1.3. Research Methodology
- 1.4. Definitions and Assumptions
- 2. Executive Summary
- 2.1. Introduction
- 3. Market Dynamics
- 3.1. Introduction
- 3.2. Market Drivers
- 3.3. Market Restrains
- 3.4. Market Trends
- 4. Market Factor Analysis
- 4.1. Porters Five Forces
- 4.2. Supply/Value Chain
- 4.3. PESTEL analysis
- 4.4. Market Entropy
- 4.5. Patent/Trademark Analysis
- 5. Global Anti Tailgating Sensor Analysis, Insights and Forecast, 2019-2031
- 5.1. Market Analysis, Insights and Forecast - by Application
- 5.1.1. Residential
- 5.1.2. Commercial
- 5.1.3. Others
- 5.2. Market Analysis, Insights and Forecast - by Type
- 5.2.1. 2D
- 5.2.2. 3D
- 5.3. Market Analysis, Insights and Forecast - by Region
- 5.3.1. North America
- 5.3.2. South America
- 5.3.3. Europe
- 5.3.4. Middle East & Africa
- 5.3.5. Asia Pacific
- 5.1. Market Analysis, Insights and Forecast - by Application
- 6. North America Anti Tailgating Sensor Analysis, Insights and Forecast, 2019-2031
- 6.1. Market Analysis, Insights and Forecast - by Application
- 6.1.1. Residential
- 6.1.2. Commercial
- 6.1.3. Others
- 6.2. Market Analysis, Insights and Forecast - by Type
- 6.2.1. 2D
- 6.2.2. 3D
- 6.1. Market Analysis, Insights and Forecast - by Application
- 7. South America Anti Tailgating Sensor Analysis, Insights and Forecast, 2019-2031
- 7.1. Market Analysis, Insights and Forecast - by Application
- 7.1.1. Residential
- 7.1.2. Commercial
- 7.1.3. Others
- 7.2. Market Analysis, Insights and Forecast - by Type
- 7.2.1. 2D
- 7.2.2. 3D
- 7.1. Market Analysis, Insights and Forecast - by Application
- 8. Europe Anti Tailgating Sensor Analysis, Insights and Forecast, 2019-2031
- 8.1. Market Analysis, Insights and Forecast - by Application
- 8.1.1. Residential
- 8.1.2. Commercial
- 8.1.3. Others
- 8.2. Market Analysis, Insights and Forecast - by Type
- 8.2.1. 2D
- 8.2.2. 3D
- 8.1. Market Analysis, Insights and Forecast - by Application
- 9. Middle East & Africa Anti Tailgating Sensor Analysis, Insights and Forecast, 2019-2031
- 9.1. Market Analysis, Insights and Forecast - by Application
- 9.1.1. Residential
- 9.1.2. Commercial
- 9.1.3. Others
- 9.2. Market Analysis, Insights and Forecast - by Type
- 9.2.1. 2D
- 9.2.2. 3D
- 9.1. Market Analysis, Insights and Forecast - by Application
- 10. Asia Pacific Anti Tailgating Sensor Analysis, Insights and Forecast, 2019-2031
- 10.1. Market Analysis, Insights and Forecast - by Application
- 10.1.1. Residential
- 10.1.2. Commercial
- 10.1.3. Others
- 10.2. Market Analysis, Insights and Forecast - by Type
- 10.2.1. 2D
- 10.2.2. 3D
- 10.1. Market Analysis, Insights and Forecast - by Application
- 11. Competitive Analysis
- 11.1. Global Market Share Analysis 2024
- 11.2. Company Profiles
- 11.2.1 AXIS
- 11.2.1.1. Overview
- 11.2.1.2. Products
- 11.2.1.3. SWOT Analysis
- 11.2.1.4. Recent Developments
- 11.2.1.5. Financials (Based on Availability)
- 11.2.2 Alcatraz AI
- 11.2.2.1. Overview
- 11.2.2.2. Products
- 11.2.2.3. SWOT Analysis
- 11.2.2.4. Recent Developments
- 11.2.2.5. Financials (Based on Availability)
- 11.2.3 Designed Security
- 11.2.3.1. Overview
- 11.2.3.2. Products
- 11.2.3.3. SWOT Analysis
- 11.2.3.4. Recent Developments
- 11.2.3.5. Financials (Based on Availability)
- 11.2.4 Detex Corporation
- 11.2.4.1. Overview
- 11.2.4.2. Products
- 11.2.4.3. SWOT Analysis
- 11.2.4.4. Recent Developments
- 11.2.4.5. Financials (Based on Availability)
- 11.2.5 ELID Technology Intl
- 11.2.5.1. Overview
- 11.2.5.2. Products
- 11.2.5.3. SWOT Analysis
- 11.2.5.4. Recent Developments
- 11.2.5.5. Financials (Based on Availability)
- 11.2.6 Hayward Turnstiles
- 11.2.6.1. Overview
- 11.2.6.2. Products
- 11.2.6.3. SWOT Analysis
- 11.2.6.4. Recent Developments
- 11.2.6.5. Financials (Based on Availability)
- 11.2.7 IEE Smart Sensing Solution
- 11.2.7.1. Overview
- 11.2.7.2. Products
- 11.2.7.3. SWOT Analysis
- 11.2.7.4. Recent Developments
- 11.2.7.5. Financials (Based on Availability)
- 11.2.8 Infrared Integrated Systems
- 11.2.8.1. Overview
- 11.2.8.2. Products
- 11.2.8.3. SWOT Analysis
- 11.2.8.4. Recent Developments
- 11.2.8.5. Financials (Based on Availability)
- 11.2.9 Integrated Design Limited (IDL)
- 11.2.9.1. Overview
- 11.2.9.2. Products
- 11.2.9.3. SWOT Analysis
- 11.2.9.4. Recent Developments
- 11.2.9.5. Financials (Based on Availability)
- 11.2.10 Kouba Systems
- 11.2.10.1. Overview
- 11.2.10.2. Products
- 11.2.10.3. SWOT Analysis
- 11.2.10.4. Recent Developments
- 11.2.10.5. Financials (Based on Availability)
- 11.2.11 Meesons Safe Secure Access
- 11.2.11.1. Overview
- 11.2.11.2. Products
- 11.2.11.3. SWOT Analysis
- 11.2.11.4. Recent Developments
- 11.2.11.5. Financials (Based on Availability)
- 11.2.12 Newton Security
- 11.2.12.1. Overview
- 11.2.12.2. Products
- 11.2.12.3. SWOT Analysis
- 11.2.12.4. Recent Developments
- 11.2.12.5. Financials (Based on Availability)
- 11.2.13 Openpath
- 11.2.13.1. Overview
- 11.2.13.2. Products
- 11.2.13.3. SWOT Analysis
- 11.2.13.4. Recent Developments
- 11.2.13.5. Financials (Based on Availability)
- 11.2.14 Optex
- 11.2.14.1. Overview
- 11.2.14.2. Products
- 11.2.14.3. SWOT Analysis
- 11.2.14.4. Recent Developments
- 11.2.14.5. Financials (Based on Availability)
- 11.2.15 Passport Technologies Inc.
- 11.2.15.1. Overview
- 11.2.15.2. Products
- 11.2.15.3. SWOT Analysis
- 11.2.15.4. Recent Developments
- 11.2.15.5. Financials (Based on Availability)
- 11.2.1 AXIS
List of Figures
- Figure 1: Global Anti Tailgating Sensor Revenue Breakdown (million, %) by Region 2024 & 2032
- Figure 2: North America Anti Tailgating Sensor Revenue (million), by Application 2024 & 2032
- Figure 3: North America Anti Tailgating Sensor Revenue Share (%), by Application 2024 & 2032
- Figure 4: North America Anti Tailgating Sensor Revenue (million), by Type 2024 & 2032
- Figure 5: North America Anti Tailgating Sensor Revenue Share (%), by Type 2024 & 2032
- Figure 6: North America Anti Tailgating Sensor Revenue (million), by Country 2024 & 2032
- Figure 7: North America Anti Tailgating Sensor Revenue Share (%), by Country 2024 & 2032
- Figure 8: South America Anti Tailgating Sensor Revenue (million), by Application 2024 & 2032
- Figure 9: South America Anti Tailgating Sensor Revenue Share (%), by Application 2024 & 2032
- Figure 10: South America Anti Tailgating Sensor Revenue (million), by Type 2024 & 2032
- Figure 11: South America Anti Tailgating Sensor Revenue Share (%), by Type 2024 & 2032
- Figure 12: South America Anti Tailgating Sensor Revenue (million), by Country 2024 & 2032
- Figure 13: South America Anti Tailgating Sensor Revenue Share (%), by Country 2024 & 2032
- Figure 14: Europe Anti Tailgating Sensor Revenue (million), by Application 2024 & 2032
- Figure 15: Europe Anti Tailgating Sensor Revenue Share (%), by Application 2024 & 2032
- Figure 16: Europe Anti Tailgating Sensor Revenue (million), by Type 2024 & 2032
- Figure 17: Europe Anti Tailgating Sensor Revenue Share (%), by Type 2024 & 2032
- Figure 18: Europe Anti Tailgating Sensor Revenue (million), by Country 2024 & 2032
- Figure 19: Europe Anti Tailgating Sensor Revenue Share (%), by Country 2024 & 2032
- Figure 20: Middle East & Africa Anti Tailgating Sensor Revenue (million), by Application 2024 & 2032
- Figure 21: Middle East & Africa Anti Tailgating Sensor Revenue Share (%), by Application 2024 & 2032
- Figure 22: Middle East & Africa Anti Tailgating Sensor Revenue (million), by Type 2024 & 2032
- Figure 23: Middle East & Africa Anti Tailgating Sensor Revenue Share (%), by Type 2024 & 2032
- Figure 24: Middle East & Africa Anti Tailgating Sensor Revenue (million), by Country 2024 & 2032
- Figure 25: Middle East & Africa Anti Tailgating Sensor Revenue Share (%), by Country 2024 & 2032
- Figure 26: Asia Pacific Anti Tailgating Sensor Revenue (million), by Application 2024 & 2032
- Figure 27: Asia Pacific Anti Tailgating Sensor Revenue Share (%), by Application 2024 & 2032
- Figure 28: Asia Pacific Anti Tailgating Sensor Revenue (million), by Type 2024 & 2032
- Figure 29: Asia Pacific Anti Tailgating Sensor Revenue Share (%), by Type 2024 & 2032
- Figure 30: Asia Pacific Anti Tailgating Sensor Revenue (million), by Country 2024 & 2032
- Figure 31: Asia Pacific Anti Tailgating Sensor Revenue Share (%), by Country 2024 & 2032
List of Tables
- Table 1: Global Anti Tailgating Sensor Revenue million Forecast, by Region 2019 & 2032
- Table 2: Global Anti Tailgating Sensor Revenue million Forecast, by Application 2019 & 2032
- Table 3: Global Anti Tailgating Sensor Revenue million Forecast, by Type 2019 & 2032
- Table 4: Global Anti Tailgating Sensor Revenue million Forecast, by Region 2019 & 2032
- Table 5: Global Anti Tailgating Sensor Revenue million Forecast, by Application 2019 & 2032
- Table 6: Global Anti Tailgating Sensor Revenue million Forecast, by Type 2019 & 2032
- Table 7: Global Anti Tailgating Sensor Revenue million Forecast, by Country 2019 & 2032
- Table 8: United States Anti Tailgating Sensor Revenue (million) Forecast, by Application 2019 & 2032
- Table 9: Canada Anti Tailgating Sensor Revenue (million) Forecast, by Application 2019 & 2032
- Table 10: Mexico Anti Tailgating Sensor Revenue (million) Forecast, by Application 2019 & 2032
- Table 11: Global Anti Tailgating Sensor Revenue million Forecast, by Application 2019 & 2032
- Table 12: Global Anti Tailgating Sensor Revenue million Forecast, by Type 2019 & 2032
- Table 13: Global Anti Tailgating Sensor Revenue million Forecast, by Country 2019 & 2032
- Table 14: Brazil Anti Tailgating Sensor Revenue (million) Forecast, by Application 2019 & 2032
- Table 15: Argentina Anti Tailgating Sensor Revenue (million) Forecast, by Application 2019 & 2032
- Table 16: Rest of South America Anti Tailgating Sensor Revenue (million) Forecast, by Application 2019 & 2032
- Table 17: Global Anti Tailgating Sensor Revenue million Forecast, by Application 2019 & 2032
- Table 18: Global Anti Tailgating Sensor Revenue million Forecast, by Type 2019 & 2032
- Table 19: Global Anti Tailgating Sensor Revenue million Forecast, by Country 2019 & 2032
- Table 20: United Kingdom Anti Tailgating Sensor Revenue (million) Forecast, by Application 2019 & 2032
- Table 21: Germany Anti Tailgating Sensor Revenue (million) Forecast, by Application 2019 & 2032
- Table 22: France Anti Tailgating Sensor Revenue (million) Forecast, by Application 2019 & 2032
- Table 23: Italy Anti Tailgating Sensor Revenue (million) Forecast, by Application 2019 & 2032
- Table 24: Spain Anti Tailgating Sensor Revenue (million) Forecast, by Application 2019 & 2032
- Table 25: Russia Anti Tailgating Sensor Revenue (million) Forecast, by Application 2019 & 2032
- Table 26: Benelux Anti Tailgating Sensor Revenue (million) Forecast, by Application 2019 & 2032
- Table 27: Nordics Anti Tailgating Sensor Revenue (million) Forecast, by Application 2019 & 2032
- Table 28: Rest of Europe Anti Tailgating Sensor Revenue (million) Forecast, by Application 2019 & 2032
- Table 29: Global Anti Tailgating Sensor Revenue million Forecast, by Application 2019 & 2032
- Table 30: Global Anti Tailgating Sensor Revenue million Forecast, by Type 2019 & 2032
- Table 31: Global Anti Tailgating Sensor Revenue million Forecast, by Country 2019 & 2032
- Table 32: Turkey Anti Tailgating Sensor Revenue (million) Forecast, by Application 2019 & 2032
- Table 33: Israel Anti Tailgating Sensor Revenue (million) Forecast, by Application 2019 & 2032
- Table 34: GCC Anti Tailgating Sensor Revenue (million) Forecast, by Application 2019 & 2032
- Table 35: North Africa Anti Tailgating Sensor Revenue (million) Forecast, by Application 2019 & 2032
- Table 36: South Africa Anti Tailgating Sensor Revenue (million) Forecast, by Application 2019 & 2032
- Table 37: Rest of Middle East & Africa Anti Tailgating Sensor Revenue (million) Forecast, by Application 2019 & 2032
- Table 38: Global Anti Tailgating Sensor Revenue million Forecast, by Application 2019 & 2032
- Table 39: Global Anti Tailgating Sensor Revenue million Forecast, by Type 2019 & 2032
- Table 40: Global Anti Tailgating Sensor Revenue million Forecast, by Country 2019 & 2032
- Table 41: China Anti Tailgating Sensor Revenue (million) Forecast, by Application 2019 & 2032
- Table 42: India Anti Tailgating Sensor Revenue (million) Forecast, by Application 2019 & 2032
- Table 43: Japan Anti Tailgating Sensor Revenue (million) Forecast, by Application 2019 & 2032
- Table 44: South Korea Anti Tailgating Sensor Revenue (million) Forecast, by Application 2019 & 2032
- Table 45: ASEAN Anti Tailgating Sensor Revenue (million) Forecast, by Application 2019 & 2032
- Table 46: Oceania Anti Tailgating Sensor Revenue (million) Forecast, by Application 2019 & 2032
- Table 47: Rest of Asia Pacific Anti Tailgating Sensor Revenue (million) Forecast, by Application 2019 & 2032
Frequently Asked Questions
1. What is the projected Compound Annual Growth Rate (CAGR) of the Anti Tailgating Sensor?
The projected CAGR is approximately XXX%.
2. Which companies are prominent players in the Anti Tailgating Sensor?
Key companies in the market include AXIS, Alcatraz AI, Designed Security, Detex Corporation, ELID Technology Intl, Hayward Turnstiles, IEE Smart Sensing Solution, Infrared Integrated Systems, Integrated Design Limited (IDL), Kouba Systems, Meesons Safe Secure Access, Newton Security, Openpath, Optex, Passport Technologies Inc..
3. What are the main segments of the Anti Tailgating Sensor?
The market segments include Application, Type.
4. Can you provide details about the market size?
The market size is estimated to be USD XXX million as of 2022.
5. What are some drivers contributing to market growth?
N/A
6. What are the notable trends driving market growth?
N/A
7. Are there any restraints impacting market growth?
N/A
8. Can you provide examples of recent developments in the market?
N/A
9. What pricing options are available for accessing the report?
Pricing options include single-user, multi-user, and enterprise licenses priced at USD 4250.00, USD 6375.00, and USD 8500.00 respectively.
10. Is the market size provided in terms of value or volume?
The market size is provided in terms of value, measured in million.
11. Are there any specific market keywords associated with the report?
Yes, the market keyword associated with the report is "Anti Tailgating Sensor," which aids in identifying and referencing the specific market segment covered.
12. How do I determine which pricing option suits my needs best?
The pricing options vary based on user requirements and access needs. Individual users may opt for single-user licenses, while businesses requiring broader access may choose multi-user or enterprise licenses for cost-effective access to the report.
13. Are there any additional resources or data provided in the Anti Tailgating Sensor report?
While the report offers comprehensive insights, it's advisable to review the specific contents or supplementary materials provided to ascertain if additional resources or data are available.
14. How can I stay updated on further developments or reports in the Anti Tailgating Sensor?
To stay informed about further developments, trends, and reports in the Anti Tailgating Sensor, consider subscribing to industry newsletters, following relevant companies and organizations, or regularly checking reputable industry news sources and publications.
Methodology
Step 1 - Identification of Relevant Samples Size from Population Database


Step 2 - Approaches for Defining Global Market Size (Value, Volume* & Price*)

Note*: In applicable scenarios
Step 3 - Data Sources
Primary Research
- Web Analytics
- Survey Reports
- Research Institute
- Latest Research Reports
- Opinion Leaders
Secondary Research
- Annual Reports
- White Paper
- Latest Press Release
- Industry Association
- Paid Database
- Investor Presentations

Step 4 - Data Triangulation
Involves using different sources of information in order to increase the validity of a study
These sources are likely to be stakeholders in a program - participants, other researchers, program staff, other community members, and so on.
Then we put all data in single framework & apply various statistical tools to find out the dynamic on the market.
During the analysis stage, feedback from the stakeholder groups would be compared to determine areas of agreement as well as areas of divergence
