

Key Insights
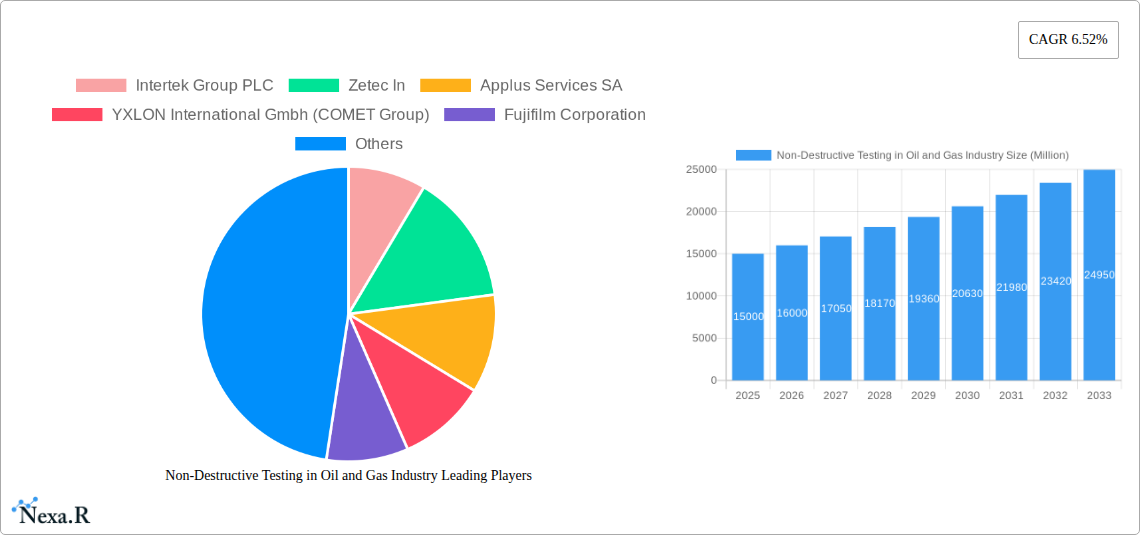
The Non-Destructive Testing (NDT) market within the oil and gas industry is experiencing robust growth, driven by increasing demand for enhanced safety and asset integrity management. A CAGR of 6.52% from 2019 to 2024 indicates a significant expansion, projected to continue through 2033. This growth is fueled by stricter regulatory compliance requirements, the need to extend the lifespan of aging oil and gas infrastructure, and the increasing complexity of offshore operations. Key growth segments include ultrasonic and radiography techniques, vital for detecting flaws in pipelines, pressure vessels, and other critical equipment. The services segment, encompassing inspection and consulting services, is also exhibiting strong growth, driven by the outsourcing trend among oil and gas companies seeking specialized expertise. While the market faces restraints such as high initial investment costs for advanced NDT equipment and a skilled labor shortage, the long-term outlook remains positive, fueled by sustained investment in exploration and production activities globally.
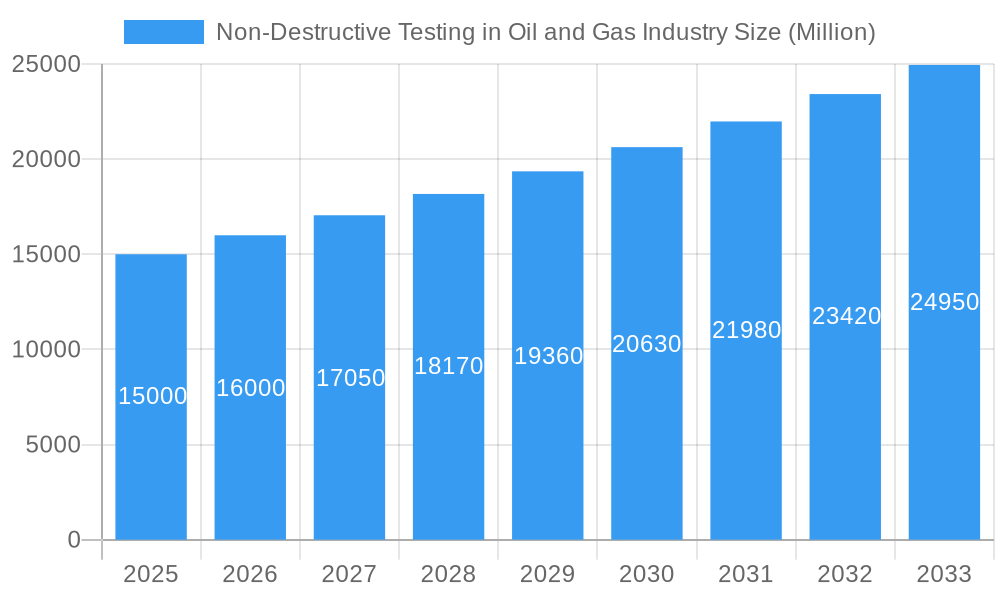
Non-Destructive Testing in Oil and Gas Industry Market Size (In Billion)
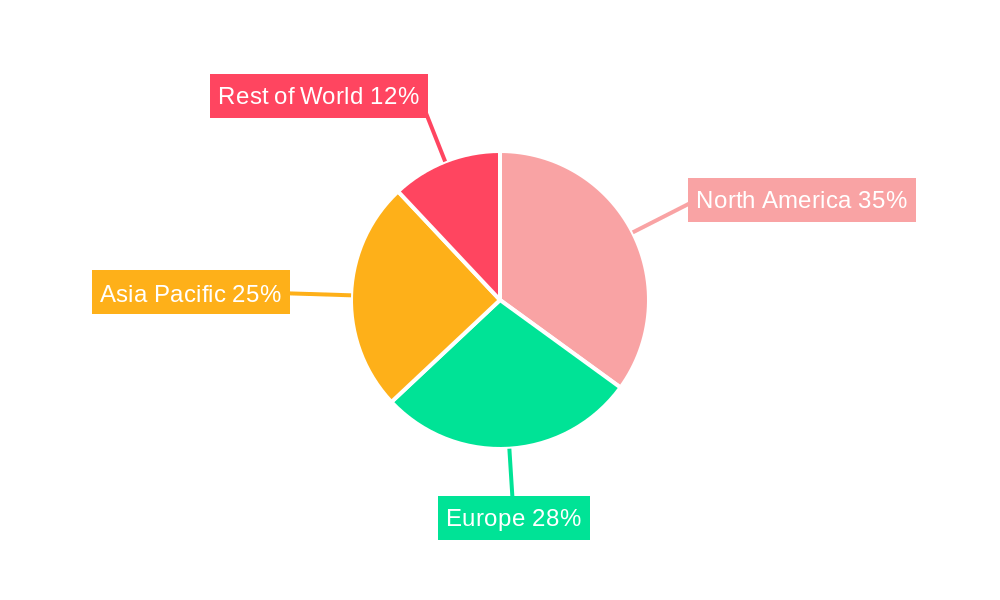
The geographical distribution of the NDT market mirrors the global distribution of oil and gas activities. North America and Europe currently hold significant market shares, driven by established infrastructure and stringent regulatory frameworks. However, the Asia-Pacific region is poised for substantial growth, fueled by rapid industrialization and increasing investment in oil and gas exploration and production. Major players in this market, including Intertek, Applus, and Fujifilm, are continually investing in R&D to develop advanced NDT technologies and expand their service offerings. The competitive landscape is characterized by both large multinational corporations and specialized NDT service providers, creating a dynamic market with diverse solutions and pricing strategies. The industry's focus on digitalization and automation is further accelerating market growth, improving efficiency, and facilitating remote inspections and data analysis. This integration of advanced technologies promises improved accuracy, reduced inspection times, and overall cost savings for oil and gas operators.
Non-Destructive Testing in Oil and Gas Industry Company Market Share
Non-Destructive Testing (NDT) in the Oil & Gas Industry: Market Report 2019-2033
This comprehensive report provides an in-depth analysis of the Non-Destructive Testing (NDT) market within the Oil & Gas industry, covering the period 2019-2033. It offers invaluable insights for industry professionals, investors, and strategic decision-makers seeking to understand market dynamics, growth trends, and future opportunities. The report leverages extensive data analysis to project a market size of xx Million by 2033, representing a significant CAGR of xx% during the forecast period (2025-2033).
Non-Destructive Testing in Oil and Gas Industry Market Dynamics & Structure
This section analyzes the market's competitive landscape, technological advancements, regulatory influences, and key market trends. The global NDT market in the Oil & Gas sector is characterized by a moderately concentrated structure, with key players holding significant market share. The market size in 2025 is estimated at xx Million.
- Market Concentration: The top 10 players, including Intertek Group PLC, Zetec Inc., Applus Services SA, YXLON International GmbH (COMET Group), Fujifilm Corporation, GE Measurement and Control (Baker Hughes), Karl Storz Ndtec GmbH, Bureau Veritas SA, Olympus Corporation, Magnaflux Corp, and Magnetic Analysis Corporation, collectively hold an estimated xx% market share.
- Technological Innovation: Continuous innovation in NDT techniques, such as advanced ultrasonic testing, phased array technology, and digital radiography, is driving market growth. However, high initial investment costs and the need for specialized expertise present barriers to wider adoption.
- Regulatory Framework: Stringent safety regulations and environmental concerns are driving demand for robust NDT solutions to ensure the integrity of oil and gas infrastructure. Compliance requirements are a key factor influencing market expansion.
- Competitive Substitutes: While limited, alternative inspection methods exist; however, NDT techniques offer superior precision and reliability, making them the preferred choice for critical applications.
- M&A Trends: The past five years have witnessed xx M&A deals in the NDT sector within the Oil & Gas industry, indicating a trend towards consolidation and expansion of service offerings.
- End-User Demographics: The primary end-users are upstream, midstream, and downstream oil and gas companies, with upstream operations (exploration and production) representing the largest segment due to the high-risk nature of these operations.
Non-Destructive Testing in Oil and Gas Industry Growth Trends & Insights
The NDT market in the Oil & Gas industry has experienced substantial growth driven by factors such as increasing demand for enhanced oil recovery techniques, stricter regulatory compliance, and the growing need to ensure the safety and integrity of aging oil and gas infrastructure. The market size grew from xx Million in 2019 to xx Million in 2024, exhibiting a CAGR of xx% during this period. The adoption rate of advanced NDT technologies, particularly in the upstream sector, is increasing, leading to improved efficiency and reduced downtime.
Technological disruptions, such as the introduction of automated and robotic NDT systems, are further enhancing market growth. Shifts in consumer behavior (Oil & Gas companies) towards prioritizing safety and efficiency are driving the adoption of sophisticated NDT solutions. The forecast period (2025-2033) anticipates continued growth, primarily driven by the exploration of new oil and gas reserves, infrastructure development in emerging economies, and a greater focus on asset integrity management. Market penetration is expected to increase from xx% in 2025 to xx% by 2033.
Dominant Regions, Countries, or Segments in Non-Destructive Testing in Oil and Gas Industry
North America and the Middle East currently dominate the NDT market in the Oil & Gas sector, driven by significant oil and gas production activities and stringent regulatory standards.
By Type:
- Services: The services segment holds the largest market share (xx%), owing to the higher demand for specialized NDT expertise compared to equipment purchases.
- Equipment: This segment is expected to show strong growth (xx% CAGR) driven by technological advancements and the introduction of advanced, automated NDT equipment.
- Upstream: This segment dominates the market, accounting for xx% of the total revenue, fueled by the critical need for NDT in exploration and production activities.
- Midstream: This segment contributes xx% and is anticipated to experience moderate growth due to increased investment in pipeline infrastructure.
- Downstream: This segment holds a smaller market share (xx%) compared to upstream and midstream but is expected to see steady growth owing to the need for refined product quality control.
By Technique:
- Ultrasonic Testing: This technique holds the largest market share (xx%), owing to its versatility, reliability, and cost-effectiveness.
- Radiography: This remains a significant technique, particularly for detecting internal flaws, with an xx% market share.
- Visual Inspection: This fundamental technique maintains a substantial market share (xx%), complemented by advanced visual tools.
- Liquid Penetrant: A widely used method with an xx% market share, especially for surface flaw detection.
- Others (Magnetic Particle & Eddy Current): These techniques collectively represent xx% and are crucial for detecting subsurface flaws in metallic components.
Non-Destructive Testing in Oil and Gas Industry Product Landscape
The NDT product landscape is dynamic, characterized by continuous innovation in equipment design, software capabilities, and data analysis tools. New products emphasize portability, ease of use, enhanced image quality, and improved data processing capabilities. Key selling propositions include automated data interpretation, real-time results, and integration with other asset management systems. Technological advancements include the development of high-resolution sensors, advanced signal processing algorithms, and cloud-based data management platforms.
Key Drivers, Barriers & Challenges in Non-Destructive Testing in Oil and Gas Industry
Key Drivers:
- Stringent safety and environmental regulations.
- Increasing demand for enhanced oil recovery techniques.
- Growing need for efficient asset integrity management.
- Technological advancements leading to improved accuracy and speed of testing.
Challenges & Restraints:
- High initial investment costs associated with advanced NDT equipment.
- Need for skilled and certified personnel to operate and interpret NDT results.
- Potential supply chain disruptions affecting the availability of NDT equipment and consumables.
- Regulatory compliance challenges and varying standards across different regions. This creates xx Million in lost revenue annually.
Emerging Opportunities in Non-Destructive Testing in Oil and Gas Industry
- Adoption of advanced automation and robotics in NDT.
- Growth of data analytics and AI in NDT data interpretation.
- Increasing demand for NDT services in emerging oil and gas markets.
- Development of new NDT techniques for composite materials and other non-metallic components.
Growth Accelerators in the Non-Destructive Testing in Oil and Gas Industry Industry
Technological breakthroughs in areas like AI-driven data analysis and the development of more robust and portable equipment are key catalysts driving long-term growth. Strategic partnerships between NDT providers and oil & gas companies are fostering innovation and accelerating the adoption of advanced technologies. Furthermore, expansion into emerging oil and gas markets presents significant growth opportunities.
Key Players Shaping the Non-Destructive Testing in Oil and Gas Industry Market
- Intertek Group PLC
- Zetec Inc.
- Applus Services SA
- YXLON International GmbH (COMET Group)
- Fujifilm Corporation
- GE Measurement and Control (Baker Hughes)
- Karl Storz Ndtec GmbH
- Bureau Veritas SA
- Olympus Corporation
- Magnaflux Corp
- Magnetic Analysis Corporation
Notable Milestones in Non-Destructive Testing in Oil and Gas Industry Sector
- September 2022: Waygate Technologies introduced the Ruby|plate 240 calibration phantom for industrial computed tomography (CT), enhancing accuracy and efficiency in CT scanning.
- October 2022: Videray Technologies Inc. launched PX Ultra, a handheld backscatter X-ray imager, expanding the accessibility and application of X-ray inspection.
In-Depth Non-Destructive Testing in Oil and Gas Industry Market Outlook
The future of the NDT market in the Oil & Gas industry is promising, driven by ongoing technological advancements, increasing regulatory scrutiny, and a growing focus on asset integrity management. The market is poised for substantial growth, particularly in emerging economies and with the adoption of innovative NDT techniques. Strategic partnerships, technological breakthroughs, and expansion into new applications will continue to shape the market landscape, creating numerous opportunities for both established players and new entrants.
Non-Destructive Testing in Oil and Gas Industry Segmentation
-
1. Type
- 1.1. Equipment
- 1.2. Services
-
2. Type
- 2.1. Upstream
- 2.2. Midstream
- 2.3. Downstream
-
3. Technique
- 3.1. Ultrasonic
- 3.2. Radiography
- 3.3. Visual Inspection
- 3.4. Liquid Penetrant
- 3.5. Others (Magnetic Particle & Eddy Current)
Non-Destructive Testing in Oil and Gas Industry Segmentation By Geography
- 1. North America
- 2. Europe
- 3. Asia Pacific
- 4. Rest of the World
Non-Destructive Testing in Oil and Gas Industry Regional Market Share
Geographic Coverage of Non-Destructive Testing in Oil and Gas Industry
Non-Destructive Testing in Oil and Gas Industry REPORT HIGHLIGHTS
| Aspects | Details |
|---|---|
| Study Period | 2020-2034 |
| Base Year | 2025 |
| Estimated Year | 2026 |
| Forecast Period | 2026-2034 |
| Historical Period | 2020-2025 |
| Growth Rate | CAGR of 8.8% from 2020-2034 |
| Segmentation |
|
Table of Contents
- 1. Introduction
- 1.1. Research Scope
- 1.2. Market Segmentation
- 1.3. Research Objective
- 1.4. Definitions and Assumptions
- 2. Executive Summary
- 2.1. Market Snapshot
- 3. Market Dynamics
- 3.1. Market Drivers
- 3.2. Market Restrains
- 3.3. Market Trends
- 3.4. Market Opportunities
- 4. Market Factor Analysis
- 4.1. Porters Five Forces
- 4.1.1. Bargaining Power of Suppliers
- 4.1.2. Bargaining Power of Buyers
- 4.1.3. Threat of New Entrants
- 4.1.4. Threat of Substitutes
- 4.1.5. Competitive Rivalry
- 4.2. PESTEL analysis
- 4.3. BCG Analysis
- 4.3.1. Stars (High Growth, High Market Share)
- 4.3.2. Cash Cows (Low Growth, High Market Share)
- 4.3.3. Question Mark (High Growth, Low Market Share)
- 4.3.4. Dogs (Low Growth, Low Market Share)
- 4.4. Ansoff Matrix Analysis
- 4.5. Supply Chain Analysis
- 4.6. Regulatory Landscape
- 4.7. Current Market Potential and Opportunity Assessment (TAM–SAM–SOM Framework)
- 4.8. NRP Analyst Note
- 4.1. Porters Five Forces
- 5. Market Analysis, Insights and Forecast 2021-2033
- 5.1. Market Analysis, Insights and Forecast - by Type
- 5.1.1. Equipment
- 5.1.2. Services
- 5.2. Market Analysis, Insights and Forecast - by Type
- 5.2.1. Upstream
- 5.2.2. Midstream
- 5.2.3. Downstream
- 5.3. Market Analysis, Insights and Forecast - by Technique
- 5.3.1. Ultrasonic
- 5.3.2. Radiography
- 5.3.3. Visual Inspection
- 5.3.4. Liquid Penetrant
- 5.3.5. Others (Magnetic Particle & Eddy Current)
- 5.4. Market Analysis, Insights and Forecast - by Region
- 5.4.1. North America
- 5.4.2. Europe
- 5.4.3. Asia Pacific
- 5.4.4. Rest of the World
- 5.1. Market Analysis, Insights and Forecast - by Type
- 6. Global Non-Destructive Testing in Oil and Gas Industry Analysis, Insights and Forecast, 2021-2033
- 6.1. Market Analysis, Insights and Forecast - by Type
- 6.1.1. Equipment
- 6.1.2. Services
- 6.2. Market Analysis, Insights and Forecast - by Type
- 6.2.1. Upstream
- 6.2.2. Midstream
- 6.2.3. Downstream
- 6.3. Market Analysis, Insights and Forecast - by Technique
- 6.3.1. Ultrasonic
- 6.3.2. Radiography
- 6.3.3. Visual Inspection
- 6.3.4. Liquid Penetrant
- 6.3.5. Others (Magnetic Particle & Eddy Current)
- 6.1. Market Analysis, Insights and Forecast - by Type
- 7. North America Non-Destructive Testing in Oil and Gas Industry Analysis, Insights and Forecast, 2020-2032
- 7.1. Market Analysis, Insights and Forecast - by Type
- 7.1.1. Equipment
- 7.1.2. Services
- 7.2. Market Analysis, Insights and Forecast - by Type
- 7.2.1. Upstream
- 7.2.2. Midstream
- 7.2.3. Downstream
- 7.3. Market Analysis, Insights and Forecast - by Technique
- 7.3.1. Ultrasonic
- 7.3.2. Radiography
- 7.3.3. Visual Inspection
- 7.3.4. Liquid Penetrant
- 7.3.5. Others (Magnetic Particle & Eddy Current)
- 7.1. Market Analysis, Insights and Forecast - by Type
- 8. Europe Non-Destructive Testing in Oil and Gas Industry Analysis, Insights and Forecast, 2020-2032
- 8.1. Market Analysis, Insights and Forecast - by Type
- 8.1.1. Equipment
- 8.1.2. Services
- 8.2. Market Analysis, Insights and Forecast - by Type
- 8.2.1. Upstream
- 8.2.2. Midstream
- 8.2.3. Downstream
- 8.3. Market Analysis, Insights and Forecast - by Technique
- 8.3.1. Ultrasonic
- 8.3.2. Radiography
- 8.3.3. Visual Inspection
- 8.3.4. Liquid Penetrant
- 8.3.5. Others (Magnetic Particle & Eddy Current)
- 8.1. Market Analysis, Insights and Forecast - by Type
- 9. Asia Pacific Non-Destructive Testing in Oil and Gas Industry Analysis, Insights and Forecast, 2020-2032
- 9.1. Market Analysis, Insights and Forecast - by Type
- 9.1.1. Equipment
- 9.1.2. Services
- 9.2. Market Analysis, Insights and Forecast - by Type
- 9.2.1. Upstream
- 9.2.2. Midstream
- 9.2.3. Downstream
- 9.3. Market Analysis, Insights and Forecast - by Technique
- 9.3.1. Ultrasonic
- 9.3.2. Radiography
- 9.3.3. Visual Inspection
- 9.3.4. Liquid Penetrant
- 9.3.5. Others (Magnetic Particle & Eddy Current)
- 9.1. Market Analysis, Insights and Forecast - by Type
- 10. Rest of the World Non-Destructive Testing in Oil and Gas Industry Analysis, Insights and Forecast, 2020-2032
- 10.1. Market Analysis, Insights and Forecast - by Type
- 10.1.1. Equipment
- 10.1.2. Services
- 10.2. Market Analysis, Insights and Forecast - by Type
- 10.2.1. Upstream
- 10.2.2. Midstream
- 10.2.3. Downstream
- 10.3. Market Analysis, Insights and Forecast - by Technique
- 10.3.1. Ultrasonic
- 10.3.2. Radiography
- 10.3.3. Visual Inspection
- 10.3.4. Liquid Penetrant
- 10.3.5. Others (Magnetic Particle & Eddy Current)
- 10.1. Market Analysis, Insights and Forecast - by Type
- 11. Competitive Analysis
- 11.1. Company Profiles
- 11.1.1 Intertek Group PLC
- 11.1.1.1. Company Overview
- 11.1.1.2. Products
- 11.1.1.3. Company Financials
- 11.1.1.4. SWOT Analysis
- 11.1.2 Zetec In
- 11.1.2.1. Company Overview
- 11.1.2.2. Products
- 11.1.2.3. Company Financials
- 11.1.2.4. SWOT Analysis
- 11.1.3 Applus Services SA
- 11.1.3.1. Company Overview
- 11.1.3.2. Products
- 11.1.3.3. Company Financials
- 11.1.3.4. SWOT Analysis
- 11.1.4 YXLON International Gmbh (COMET Group)
- 11.1.4.1. Company Overview
- 11.1.4.2. Products
- 11.1.4.3. Company Financials
- 11.1.4.4. SWOT Analysis
- 11.1.5 Fujifilm Corporation
- 11.1.5.1. Company Overview
- 11.1.5.2. Products
- 11.1.5.3. Company Financials
- 11.1.5.4. SWOT Analysis
- 11.1.6 GE Measurement and Control (Baker Hughes)
- 11.1.6.1. Company Overview
- 11.1.6.2. Products
- 11.1.6.3. Company Financials
- 11.1.6.4. SWOT Analysis
- 11.1.7 Karl Storz Ndtec Gmbh
- 11.1.7.1. Company Overview
- 11.1.7.2. Products
- 11.1.7.3. Company Financials
- 11.1.7.4. SWOT Analysis
- 11.1.8 Bureau Veritas SA
- 11.1.8.1. Company Overview
- 11.1.8.2. Products
- 11.1.8.3. Company Financials
- 11.1.8.4. SWOT Analysis
- 11.1.9 Olympus Corporation
- 11.1.9.1. Company Overview
- 11.1.9.2. Products
- 11.1.9.3. Company Financials
- 11.1.9.4. SWOT Analysis
- 11.1.10 Magnaflux Corp
- 11.1.10.1. Company Overview
- 11.1.10.2. Products
- 11.1.10.3. Company Financials
- 11.1.10.4. SWOT Analysis
- 11.1.11 Magnetic Analysis Corporation
- 11.1.11.1. Company Overview
- 11.1.11.2. Products
- 11.1.11.3. Company Financials
- 11.1.11.4. SWOT Analysis
- 11.1.1 Intertek Group PLC
- 11.2. Market Entropy
- 11.2.1 Company's Key Areas Served
- 11.2.2 Recent Developments
- 11.3. Company Market Share Analysis 2025
- 11.3.1 Top 5 Companies Market Share Analysis
- 11.3.2 Top 3 Companies Market Share Analysis
- 11.4. List of Potential Customers
- 12. Research Methodology
List of Figures
- Figure 1: Global Non-Destructive Testing in Oil and Gas Industry Revenue Breakdown (billion, %) by Region 2025 & 2033
- Figure 2: North America Non-Destructive Testing in Oil and Gas Industry Revenue (billion), by Type 2025 & 2033
- Figure 3: North America Non-Destructive Testing in Oil and Gas Industry Revenue Share (%), by Type 2025 & 2033
- Figure 4: North America Non-Destructive Testing in Oil and Gas Industry Revenue (billion), by Type 2025 & 2033
- Figure 5: North America Non-Destructive Testing in Oil and Gas Industry Revenue Share (%), by Type 2025 & 2033
- Figure 6: North America Non-Destructive Testing in Oil and Gas Industry Revenue (billion), by Technique 2025 & 2033
- Figure 7: North America Non-Destructive Testing in Oil and Gas Industry Revenue Share (%), by Technique 2025 & 2033
- Figure 8: North America Non-Destructive Testing in Oil and Gas Industry Revenue (billion), by Country 2025 & 2033
- Figure 9: North America Non-Destructive Testing in Oil and Gas Industry Revenue Share (%), by Country 2025 & 2033
- Figure 10: Europe Non-Destructive Testing in Oil and Gas Industry Revenue (billion), by Type 2025 & 2033
- Figure 11: Europe Non-Destructive Testing in Oil and Gas Industry Revenue Share (%), by Type 2025 & 2033
- Figure 12: Europe Non-Destructive Testing in Oil and Gas Industry Revenue (billion), by Type 2025 & 2033
- Figure 13: Europe Non-Destructive Testing in Oil and Gas Industry Revenue Share (%), by Type 2025 & 2033
- Figure 14: Europe Non-Destructive Testing in Oil and Gas Industry Revenue (billion), by Technique 2025 & 2033
- Figure 15: Europe Non-Destructive Testing in Oil and Gas Industry Revenue Share (%), by Technique 2025 & 2033
- Figure 16: Europe Non-Destructive Testing in Oil and Gas Industry Revenue (billion), by Country 2025 & 2033
- Figure 17: Europe Non-Destructive Testing in Oil and Gas Industry Revenue Share (%), by Country 2025 & 2033
- Figure 18: Asia Pacific Non-Destructive Testing in Oil and Gas Industry Revenue (billion), by Type 2025 & 2033
- Figure 19: Asia Pacific Non-Destructive Testing in Oil and Gas Industry Revenue Share (%), by Type 2025 & 2033
- Figure 20: Asia Pacific Non-Destructive Testing in Oil and Gas Industry Revenue (billion), by Type 2025 & 2033
- Figure 21: Asia Pacific Non-Destructive Testing in Oil and Gas Industry Revenue Share (%), by Type 2025 & 2033
- Figure 22: Asia Pacific Non-Destructive Testing in Oil and Gas Industry Revenue (billion), by Technique 2025 & 2033
- Figure 23: Asia Pacific Non-Destructive Testing in Oil and Gas Industry Revenue Share (%), by Technique 2025 & 2033
- Figure 24: Asia Pacific Non-Destructive Testing in Oil and Gas Industry Revenue (billion), by Country 2025 & 2033
- Figure 25: Asia Pacific Non-Destructive Testing in Oil and Gas Industry Revenue Share (%), by Country 2025 & 2033
- Figure 26: Rest of the World Non-Destructive Testing in Oil and Gas Industry Revenue (billion), by Type 2025 & 2033
- Figure 27: Rest of the World Non-Destructive Testing in Oil and Gas Industry Revenue Share (%), by Type 2025 & 2033
- Figure 28: Rest of the World Non-Destructive Testing in Oil and Gas Industry Revenue (billion), by Type 2025 & 2033
- Figure 29: Rest of the World Non-Destructive Testing in Oil and Gas Industry Revenue Share (%), by Type 2025 & 2033
- Figure 30: Rest of the World Non-Destructive Testing in Oil and Gas Industry Revenue (billion), by Technique 2025 & 2033
- Figure 31: Rest of the World Non-Destructive Testing in Oil and Gas Industry Revenue Share (%), by Technique 2025 & 2033
- Figure 32: Rest of the World Non-Destructive Testing in Oil and Gas Industry Revenue (billion), by Country 2025 & 2033
- Figure 33: Rest of the World Non-Destructive Testing in Oil and Gas Industry Revenue Share (%), by Country 2025 & 2033
List of Tables
- Table 1: Global Non-Destructive Testing in Oil and Gas Industry Revenue billion Forecast, by Type 2020 & 2033
- Table 2: Global Non-Destructive Testing in Oil and Gas Industry Revenue billion Forecast, by Type 2020 & 2033
- Table 3: Global Non-Destructive Testing in Oil and Gas Industry Revenue billion Forecast, by Technique 2020 & 2033
- Table 4: Global Non-Destructive Testing in Oil and Gas Industry Revenue billion Forecast, by Region 2020 & 2033
- Table 5: Global Non-Destructive Testing in Oil and Gas Industry Revenue billion Forecast, by Type 2020 & 2033
- Table 6: Global Non-Destructive Testing in Oil and Gas Industry Revenue billion Forecast, by Type 2020 & 2033
- Table 7: Global Non-Destructive Testing in Oil and Gas Industry Revenue billion Forecast, by Technique 2020 & 2033
- Table 8: Global Non-Destructive Testing in Oil and Gas Industry Revenue billion Forecast, by Country 2020 & 2033
- Table 9: Global Non-Destructive Testing in Oil and Gas Industry Revenue billion Forecast, by Type 2020 & 2033
- Table 10: Global Non-Destructive Testing in Oil and Gas Industry Revenue billion Forecast, by Type 2020 & 2033
- Table 11: Global Non-Destructive Testing in Oil and Gas Industry Revenue billion Forecast, by Technique 2020 & 2033
- Table 12: Global Non-Destructive Testing in Oil and Gas Industry Revenue billion Forecast, by Country 2020 & 2033
- Table 13: Global Non-Destructive Testing in Oil and Gas Industry Revenue billion Forecast, by Type 2020 & 2033
- Table 14: Global Non-Destructive Testing in Oil and Gas Industry Revenue billion Forecast, by Type 2020 & 2033
- Table 15: Global Non-Destructive Testing in Oil and Gas Industry Revenue billion Forecast, by Technique 2020 & 2033
- Table 16: Global Non-Destructive Testing in Oil and Gas Industry Revenue billion Forecast, by Country 2020 & 2033
- Table 17: Global Non-Destructive Testing in Oil and Gas Industry Revenue billion Forecast, by Type 2020 & 2033
- Table 18: Global Non-Destructive Testing in Oil and Gas Industry Revenue billion Forecast, by Type 2020 & 2033
- Table 19: Global Non-Destructive Testing in Oil and Gas Industry Revenue billion Forecast, by Technique 2020 & 2033
- Table 20: Global Non-Destructive Testing in Oil and Gas Industry Revenue billion Forecast, by Country 2020 & 2033
Frequently Asked Questions
1. What is the projected Compound Annual Growth Rate (CAGR) of the Non-Destructive Testing in Oil and Gas Industry?
The projected CAGR is approximately 8.8%.
2. Which companies are prominent players in the Non-Destructive Testing in Oil and Gas Industry?
Key companies in the market include Intertek Group PLC, Zetec In, Applus Services SA, YXLON International Gmbh (COMET Group), Fujifilm Corporation, GE Measurement and Control (Baker Hughes), Karl Storz Ndtec Gmbh, Bureau Veritas SA, Olympus Corporation, Magnaflux Corp, Magnetic Analysis Corporation.
3. What are the main segments of the Non-Destructive Testing in Oil and Gas Industry?
The market segments include Type, Type, Technique.
4. Can you provide details about the market size?
The market size is estimated to be USD 4.06 billion as of 2022.
5. What are some drivers contributing to market growth?
Rising need to run refinery assets at full cap; Upstream sector expected to gain momentum in key markets.
6. What are the notable trends driving market growth?
The Rising Usage of Drones in the Market.
7. Are there any restraints impacting market growth?
; High Initial Cost During First Time Setup is Challenging the Market Growth.
8. Can you provide examples of recent developments in the market?
September 2022 : Waygate Technologies introduced the Ruby|plate 240 calibration phantom for industrial computed tomography (CT). Features high-resolution insights and captures extremely accurate and effective calibration bodies to determine the exact voxel size and allows operators to detect any deviation quickly and non-destructively in geometry.
9. What pricing options are available for accessing the report?
Pricing options include single-user, multi-user, and enterprise licenses priced at USD 4750, USD 5250, and USD 8750 respectively.
10. Is the market size provided in terms of value or volume?
The market size is provided in terms of value, measured in billion.
11. Are there any specific market keywords associated with the report?
Yes, the market keyword associated with the report is "Non-Destructive Testing in Oil and Gas Industry," which aids in identifying and referencing the specific market segment covered.
12. How do I determine which pricing option suits my needs best?
The pricing options vary based on user requirements and access needs. Individual users may opt for single-user licenses, while businesses requiring broader access may choose multi-user or enterprise licenses for cost-effective access to the report.
13. Are there any additional resources or data provided in the Non-Destructive Testing in Oil and Gas Industry report?
While the report offers comprehensive insights, it's advisable to review the specific contents or supplementary materials provided to ascertain if additional resources or data are available.
14. How can I stay updated on further developments or reports in the Non-Destructive Testing in Oil and Gas Industry?
To stay informed about further developments, trends, and reports in the Non-Destructive Testing in Oil and Gas Industry, consider subscribing to industry newsletters, following relevant companies and organizations, or regularly checking reputable industry news sources and publications.
Methodology
Step 1 - Identification of Relevant Samples Size from Population Database


Step 2 - Approaches for Defining Global Market Size (Value, Volume* & Price*)

Note*: In applicable scenarios
Step 3 - Data Sources
Primary Research
- Web Analytics
- Survey Reports
- Research Institute
- Latest Research Reports
- Opinion Leaders
Secondary Research
- Annual Reports
- White Paper
- Latest Press Release
- Industry Association
- Paid Database
- Investor Presentations

Step 4 - Data Triangulation
Involves using different sources of information in order to increase the validity of a study
These sources are likely to be stakeholders in a program - participants, other researchers, program staff, other community members, and so on.
Then we put all data in single framework & apply various statistical tools to find out the dynamic on the market.
During the analysis stage, feedback from the stakeholder groups would be compared to determine areas of agreement as well as areas of divergence