

Key Insights
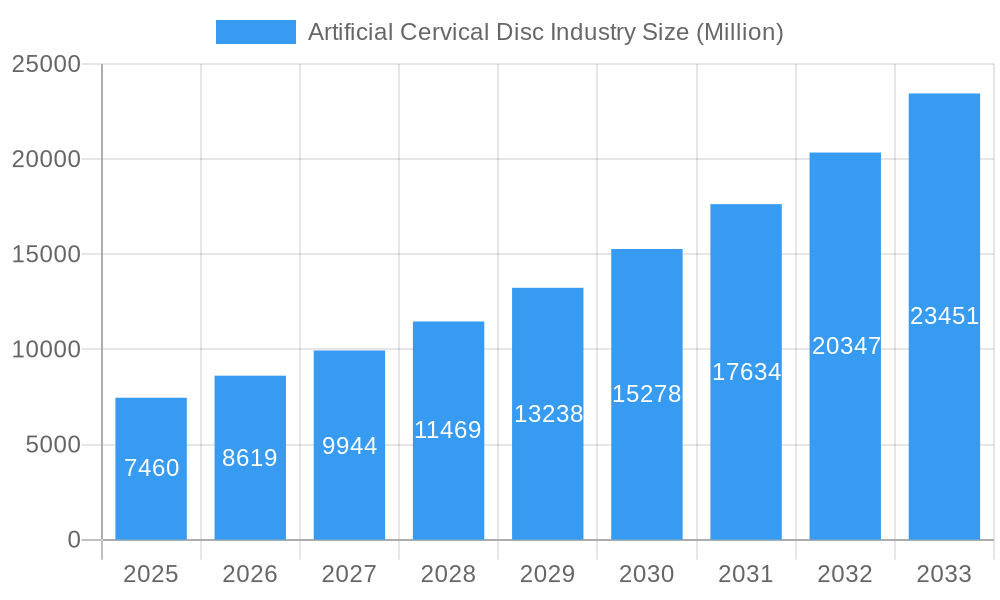
The global Artificial Cervical Disc market is poised for significant expansion, with a projected market size of $7.46 billion in 2025 and a robust Compound Annual Growth Rate (CAGR) of 15.15% over the forecast period of 2025-2033. This impressive growth is primarily fueled by the increasing prevalence of degenerative cervical disc diseases, such as herniated discs and cervical spondylosis, driven by an aging global population and sedentary lifestyles. Furthermore, advancements in biomaterials and surgical techniques are enhancing the efficacy and safety of artificial cervical disc replacements, leading to greater patient adoption and physician preference over traditional fusion procedures. The rising awareness regarding the benefits of motion-preserving technologies, including reduced adjacent segment degeneration and improved patient recovery, is a critical driver. Geographically, North America currently dominates the market due to high healthcare expenditure, advanced technological adoption, and a strong presence of key market players. However, the Asia Pacific region is expected to witness the fastest growth, propelled by a large patient pool, improving healthcare infrastructure, and increasing access to advanced medical treatments.
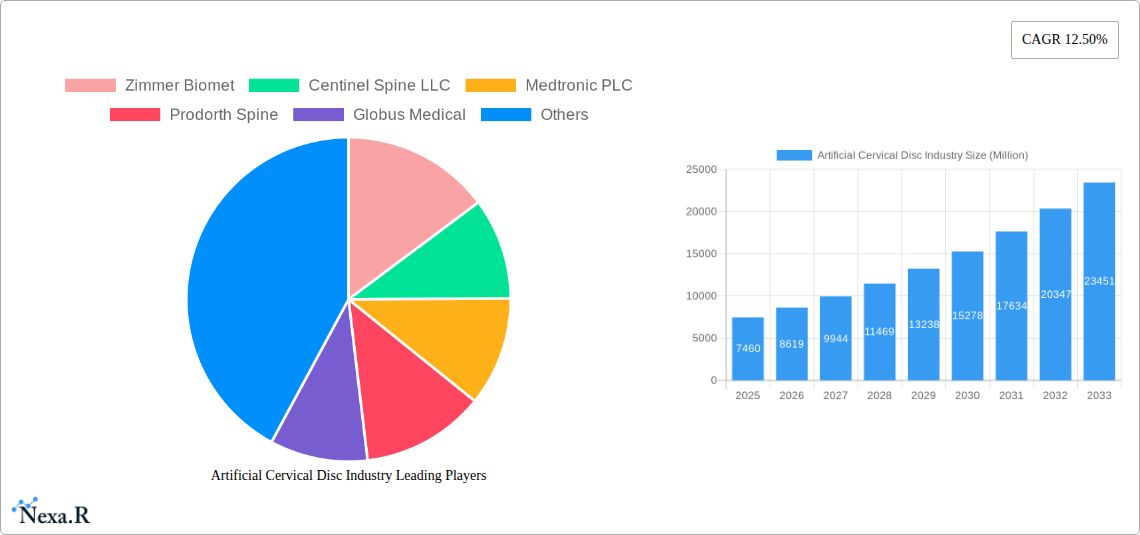
Artificial Cervical Disc Industry Market Size (In Billion)
The market is segmented by disc type, with Artificial Cervical Discs holding a substantial share, reflecting the growing demand for specialized treatments addressing cervical spine conditions. Within materials, Metal-on-Polymer designs are gaining traction due to their favorable wear characteristics and biocompatibility, offering a compelling alternative to Metal-on-Metal implants. Despite the strong growth trajectory, certain restraints exist, including the high cost of these implants and procedures, limited reimbursement policies in some regions, and the need for specialized surgical training. However, continuous innovation in implant design, a focus on cost-effectiveness, and expanding clinical evidence supporting the long-term benefits of artificial cervical disc replacement are expected to mitigate these challenges. Key industry players are actively investing in research and development, strategic collaborations, and market expansion to capitalize on this burgeoning market. The competitive landscape is characterized by a mix of established giants and emerging innovators, all vying to capture a significant share of this expanding segment within the broader spine surgery market.
Artificial Cervical Disc Industry Company Market Share
Artificial Cervical Disc Industry: Comprehensive Market Analysis and Forecast (2019-2033)
This report offers an in-depth analysis of the global Artificial Cervical Disc market, encompassing its historical performance, current dynamics, and future trajectory. We delve into market segmentation, key growth drivers, emerging opportunities, competitive landscape, and pivotal industry developments. This comprehensive study is essential for stakeholders seeking to understand market concentration, technological advancements, regulatory landscapes, and the competitive product substitutes shaping the cervical artificial disc industry. The report covers a study period of 2019–2033, with 2025 as the base and estimated year, and a forecast period from 2025–2033, drawing upon historical data from 2019–2024. All values are presented in billion units for clarity and impact.
Artificial Cervical Disc Industry Market Dynamics & Structure
The Artificial Cervical Disc market exhibits a moderately concentrated structure, characterized by the presence of several key players alongside a growing number of niche manufacturers. Technological innovation is a primary driver, with continuous advancements in biomaterials, implant design, and surgical techniques enhancing patient outcomes and expanding the addressable market. Regulatory frameworks, overseen by bodies like the FDA and EMA, play a crucial role in ensuring product safety and efficacy, influencing market entry and product development timelines. Competitive product substitutes, including spinal fusion devices, pose a significant challenge, necessitating ongoing innovation and demonstration of superior clinical benefits for artificial discs. End-user demographics are shifting towards an aging global population and increasing prevalence of degenerative spinal conditions, fueling demand. Mergers & Acquisitions (M&A) are a notable trend, with companies consolidating to enhance market share, expand product portfolios, and leverage R&D capabilities.
- Market Concentration: Dominated by a few large players but with increasing competition from specialized firms.
- Technological Innovation Drivers: Minimally invasive surgery, enhanced biocompatibility, improved range of motion, and patient-specific designs.
- Regulatory Frameworks: Stringent approval processes that ensure patient safety and drive innovation towards evidence-based solutions.
- Competitive Product Substitutes: Spinal fusion techniques remain a significant competitor, emphasizing the need for superior long-term outcomes from artificial discs.
- End-User Demographics: Growing elderly population and increasing diagnosis of cervical spondylosis and disc herniation.
- M&A Trends: Strategic consolidations to gain market access, technological synergies, and expand product offerings. For instance, the merger between Orthofix and SeaSpine in October 2022 signifies a consolidation trend.
Artificial Cervical Disc Industry Growth Trends & Insights
The global artificial cervical disc market is experiencing robust growth, driven by increasing adoption rates of less invasive surgical procedures and a growing awareness of the benefits of motion-preserving technologies. The market size evolution is a testament to the escalating prevalence of degenerative cervical spine conditions, including cervical spondylosis and disc herniation, particularly in aging populations worldwide. Technological disruptions, such as the development of advanced biomaterials like PEEK and cobalt-chromium alloys, coupled with sophisticated implant designs that mimic natural spinal articulation, are significantly enhancing treatment efficacy and patient recovery. Consumer behavior shifts are also playing a crucial role, with patients increasingly seeking alternatives to traditional spinal fusion that offer quicker recovery times and preserve spinal mobility, thereby improving quality of life. The market penetration of cervical artificial discs is projected to increase steadily as clinical evidence supporting their long-term safety and effectiveness continues to accumulate. The Compound Annual Growth Rate (CAGR) is anticipated to remain strong throughout the forecast period, reflecting sustained demand and ongoing innovation.
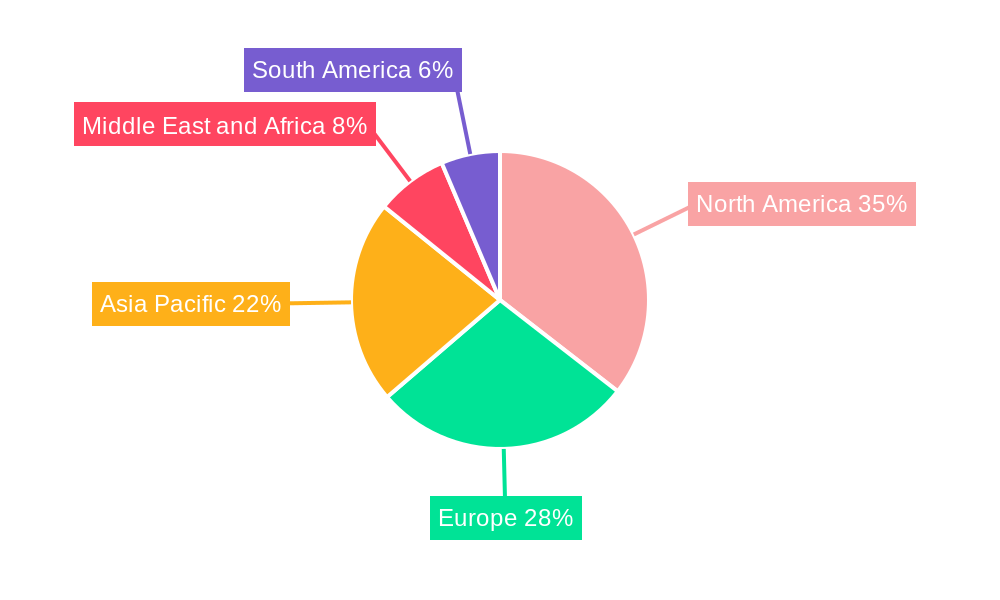
Dominant Regions, Countries, or Segments in Artificial Cervical Disc Industry
The Cervical Artificial Disc segment within the broader artificial disc market is a primary driver of growth, outperforming its lumbar counterpart due to the higher prevalence of degenerative conditions in the cervical spine and the critical role of neck mobility in daily activities. Within this segment, North America, particularly the United States, currently dominates the market share, accounting for approximately 45% of global revenue. This dominance is attributed to several factors: advanced healthcare infrastructure, high disposable incomes, a large aging population susceptible to cervical disc disorders, and proactive adoption of innovative medical technologies. Furthermore, robust research and development initiatives, coupled with favorable reimbursement policies for advanced spinal procedures, contribute significantly to this leadership. The region also benefits from the presence of major industry players like Zimmer Biomet, Centinel Spine LLC, Medtronic PLC, and NuVasive Inc., who are at the forefront of product development and clinical trials.
- Dominant Segment: Cervical Artificial Disc.
- Key Drivers: Higher incidence of degenerative cervical conditions, critical importance of cervical spine mobility, and greater acceptance of motion-preserving technologies.
- Market Share: Expected to hold over 60% of the total artificial disc market by 2028.
- Dominant Region: North America (primarily the United States).
- Key Drivers:
- Economic Policies: Favorable reimbursement landscapes and strong healthcare expenditure.
- Infrastructure: State-of-the-art healthcare facilities and a high density of spinal surgeons.
- Demographics: Aging population and increasing prevalence of cervical degenerative diseases.
- Technological Adoption: Early and widespread adoption of advanced medical devices and surgical techniques.
- Market Share: Approximately 45% of the global artificial disc market.
- Growth Potential: Continued growth driven by an aging population and increasing awareness of motion-preserving alternatives.
- Key Drivers:
- Leading Material Type: Metal on Polymer, specifically PEEK (Polyetheretherketone) combined with a metal alloy, is preferred due to its excellent biocompatibility, wear resistance, and ability to provide a natural feel and articulation.
- Market Share: Expected to capture over 70% of the cervical artificial disc market by 2028.
- Growth Factors: Superior biomechanical properties, long-term durability, and lower risk of wear debris compared to metal-on-metal implants.
Artificial Cervical Disc Industry Product Landscape
The artificial cervical disc product landscape is characterized by continuous innovation focused on improving patient outcomes and surgical efficiency. Leading products, such as those developed by Centinel Spine, LLC, and Medtronic PLC, offer advanced designs that closely mimic the natural biomechanics of the cervical spine, promoting motion preservation and reducing adjacent segment degeneration. Innovations include the use of biocompatible materials like PEEK and advanced metal alloys, along with sophisticated implant geometries that facilitate precise placement and integration. These advancements translate to enhanced performance metrics, including improved range of motion, reduced pain, and faster recovery times for patients undergoing procedures for degenerative cervical disc disease.
Key Drivers, Barriers & Challenges in Artificial Cervical Disc Industry
Key Drivers:
- Growing prevalence of degenerative cervical spine conditions: Aging demographics and sedentary lifestyles are increasing the incidence of conditions like cervical spondylosis and disc herniation.
- Technological advancements: Development of more biocompatible materials, improved implant designs, and less invasive surgical techniques are enhancing efficacy and patient acceptance.
- Demand for motion-preserving surgery: Patients and surgeons are increasingly favoring alternatives to spinal fusion that preserve natural spinal movement and reduce the risk of adjacent segment degeneration.
- Favorable reimbursement policies: Expanding coverage for artificial disc replacement procedures in key markets supports market growth.
Barriers & Challenges:
- High cost of artificial discs: These devices are significantly more expensive than traditional fusion implants, posing a barrier to wider adoption, particularly in cost-sensitive markets.
- Surgeon training and expertise: The implantation of artificial discs requires specialized training and surgical skill, limiting the number of surgeons who can perform the procedure.
- Long-term efficacy data: While promising, extensive long-term clinical data compared to fusion is still being gathered, which can influence surgeon and payer confidence.
- Competition from spinal fusion: Spinal fusion remains a well-established and often reimbursed treatment option, presenting ongoing competition.
- Regulatory hurdles: Stringent approval processes for new devices can be time-consuming and costly, impacting the pace of innovation and market entry.
- Supply chain disruptions: Geopolitical factors and material sourcing complexities can impact the availability and cost of critical components. The global supply chain for specialized biomaterials is a key concern.
Emerging Opportunities in Artificial Cervical Disc Industry
Emerging opportunities in the artificial cervical disc industry lie in the development of next-generation implants featuring enhanced biomimicry and intelligent functionalities, such as integrated sensors for real-time patient monitoring. Untapped markets in developing economies with rapidly expanding healthcare sectors present significant growth potential as awareness and access to advanced treatments increase. Innovative applications, including the use of artificial discs in conjunction with regenerative medicine approaches, are also on the horizon, promising more comprehensive solutions for spinal degeneration. Evolving consumer preferences for personalized medicine and minimally invasive procedures will continue to fuel demand for customized and advanced artificial disc designs, creating a fertile ground for specialized product development and niche market penetration.
Growth Accelerators in the Artificial Cervical Disc Industry Industry
Technological breakthroughs in biomaterials science, leading to more durable and biocompatible implant materials with enhanced wear resistance, are significant growth accelerators. Strategic partnerships between implant manufacturers and leading research institutions are fostering faster development cycles and clinical validation of novel designs. Furthermore, expansion into emerging markets in Asia-Pacific and Latin America, driven by improving healthcare infrastructure and increasing disposable incomes, represents a substantial growth avenue. The continuous refinement of surgical techniques to make artificial disc implantation more accessible and less invasive will also accelerate adoption rates, further propelling the industry's growth trajectory.
Key Players Shaping the Artificial Cervical Disc Industry Market
- Zimmer Biomet
- Centinel Spine LLC
- Medtronic PLC
- Prodorth Spine
- Globus Medical
- Orthofix Medical Inc
- B Braun Melsungen
- Synergy Spine Solutions Inc
- Spineart SA
- NuVasive Inc
- AxioMed LLC
Notable Milestones in Artificial Cervical Disc Industry Sector
- November 2022: Centinel Spine, LLC announced the first implantation of its prodisc C SK, a cervical artificial disc, marking a significant product advancement and expanding the company's cervical portfolio.
- October 2022: Orthofix and SeaSpine announced that they have entered into a definitive merger agreement to create a leading spine and orthopedics company, signaling consolidation and strategic alignment within the broader spine market.
In-Depth Artificial Cervical Disc Industry Market Outlook
The artificial cervical disc industry is poised for sustained and robust growth, driven by a confluence of escalating demand from aging populations and the persistent need for effective treatments for degenerative cervical conditions. Advancements in materials science and implant design will continue to fuel innovation, offering improved patient outcomes and enhanced spinal function. Strategic initiatives by key players, including product line expansions and market penetration into developing regions, will act as significant growth accelerators. The industry's outlook is characterized by increasing adoption of motion-preserving technologies, a trend that is expected to gain further momentum as clinical evidence solidifies and surgical expertise becomes more widespread. This presents a compelling landscape of opportunity for stakeholders committed to advancing spinal care.
Artificial Cervical Disc Industry Segmentation
-
1. Disc Type
- 1.1. Cervical Artificial Disc
- 1.2. Lumbar Artificial Disc
-
2. Material Type
- 2.1. Metal on Metal
- 2.2. Metal on Polymer
Artificial Cervical Disc Industry Segmentation By Geography
-
1. North America
- 1.1. United States
- 1.2. Canada
- 1.3. Mexico
-
2. Europe
- 2.1. Germany
- 2.2. United Kingdom
- 2.3. France
- 2.4. Italy
- 2.5. Spain
- 2.6. Rest of Europe
-
3. Asia Pacific
- 3.1. China
- 3.2. Japan
- 3.3. India
- 3.4. Australia
- 3.5. South Korea
- 3.6. Rest of Asia Pacific
-
4. Middle East and Africa
- 4.1. GCC
- 4.2. South Africa
- 4.3. Rest of Middle East and Africa
-
5. South America
- 5.1. Brazil
- 5.2. Argentina
- 5.3. Rest of South America
Artificial Cervical Disc Industry Regional Market Share
Geographic Coverage of Artificial Cervical Disc Industry
Artificial Cervical Disc Industry REPORT HIGHLIGHTS
| Aspects | Details |
|---|---|
| Study Period | 2020-2034 |
| Base Year | 2025 |
| Estimated Year | 2026 |
| Forecast Period | 2026-2034 |
| Historical Period | 2020-2025 |
| Growth Rate | CAGR of 12.4% from 2020-2034 |
| Segmentation |
|
Table of Contents
- 1. Introduction
- 1.1. Research Scope
- 1.2. Market Segmentation
- 1.3. Research Objective
- 1.4. Definitions and Assumptions
- 2. Executive Summary
- 2.1. Market Snapshot
- 3. Market Dynamics
- 3.1. Market Drivers
- 3.2. Market Restrains
- 3.3. Market Trends
- 3.4. Market Opportunities
- 4. Market Factor Analysis
- 4.1. Porters Five Forces
- 4.1.1. Bargaining Power of Suppliers
- 4.1.2. Bargaining Power of Buyers
- 4.1.3. Threat of New Entrants
- 4.1.4. Threat of Substitutes
- 4.1.5. Competitive Rivalry
- 4.2. PESTEL analysis
- 4.3. BCG Analysis
- 4.3.1. Stars (High Growth, High Market Share)
- 4.3.2. Cash Cows (Low Growth, High Market Share)
- 4.3.3. Question Mark (High Growth, Low Market Share)
- 4.3.4. Dogs (Low Growth, Low Market Share)
- 4.4. Ansoff Matrix Analysis
- 4.5. Supply Chain Analysis
- 4.6. Regulatory Landscape
- 4.7. Current Market Potential and Opportunity Assessment (TAM–SAM–SOM Framework)
- 4.8. NRP Analyst Note
- 4.1. Porters Five Forces
- 5. Market Analysis, Insights and Forecast 2021-2033
- 5.1. Market Analysis, Insights and Forecast - by Disc Type
- 5.1.1. Cervical Artificial Disc
- 5.1.2. Lumbar Artificial Disc
- 5.2. Market Analysis, Insights and Forecast - by Material Type
- 5.2.1. Metal on Metal
- 5.2.2. Metal on Polymer
- 5.3. Market Analysis, Insights and Forecast - by Region
- 5.3.1. North America
- 5.3.2. Europe
- 5.3.3. Asia Pacific
- 5.3.4. Middle East and Africa
- 5.3.5. South America
- 5.1. Market Analysis, Insights and Forecast - by Disc Type
- 6. Global Artificial Cervical Disc Industry Analysis, Insights and Forecast, 2021-2033
- 6.1. Market Analysis, Insights and Forecast - by Disc Type
- 6.1.1. Cervical Artificial Disc
- 6.1.2. Lumbar Artificial Disc
- 6.2. Market Analysis, Insights and Forecast - by Material Type
- 6.2.1. Metal on Metal
- 6.2.2. Metal on Polymer
- 6.1. Market Analysis, Insights and Forecast - by Disc Type
- 7. North America Artificial Cervical Disc Industry Analysis, Insights and Forecast, 2020-2032
- 7.1. Market Analysis, Insights and Forecast - by Disc Type
- 7.1.1. Cervical Artificial Disc
- 7.1.2. Lumbar Artificial Disc
- 7.2. Market Analysis, Insights and Forecast - by Material Type
- 7.2.1. Metal on Metal
- 7.2.2. Metal on Polymer
- 7.1. Market Analysis, Insights and Forecast - by Disc Type
- 8. Europe Artificial Cervical Disc Industry Analysis, Insights and Forecast, 2020-2032
- 8.1. Market Analysis, Insights and Forecast - by Disc Type
- 8.1.1. Cervical Artificial Disc
- 8.1.2. Lumbar Artificial Disc
- 8.2. Market Analysis, Insights and Forecast - by Material Type
- 8.2.1. Metal on Metal
- 8.2.2. Metal on Polymer
- 8.1. Market Analysis, Insights and Forecast - by Disc Type
- 9. Asia Pacific Artificial Cervical Disc Industry Analysis, Insights and Forecast, 2020-2032
- 9.1. Market Analysis, Insights and Forecast - by Disc Type
- 9.1.1. Cervical Artificial Disc
- 9.1.2. Lumbar Artificial Disc
- 9.2. Market Analysis, Insights and Forecast - by Material Type
- 9.2.1. Metal on Metal
- 9.2.2. Metal on Polymer
- 9.1. Market Analysis, Insights and Forecast - by Disc Type
- 10. Middle East and Africa Artificial Cervical Disc Industry Analysis, Insights and Forecast, 2020-2032
- 10.1. Market Analysis, Insights and Forecast - by Disc Type
- 10.1.1. Cervical Artificial Disc
- 10.1.2. Lumbar Artificial Disc
- 10.2. Market Analysis, Insights and Forecast - by Material Type
- 10.2.1. Metal on Metal
- 10.2.2. Metal on Polymer
- 10.1. Market Analysis, Insights and Forecast - by Disc Type
- 11. South America Artificial Cervical Disc Industry Analysis, Insights and Forecast, 2020-2032
- 11.1. Market Analysis, Insights and Forecast - by Disc Type
- 11.1.1. Cervical Artificial Disc
- 11.1.2. Lumbar Artificial Disc
- 11.2. Market Analysis, Insights and Forecast - by Material Type
- 11.2.1. Metal on Metal
- 11.2.2. Metal on Polymer
- 11.1. Market Analysis, Insights and Forecast - by Disc Type
- 12. Competitive Analysis
- 12.1. Company Profiles
- 12.1.1 Zimmer Biomet
- 12.1.1.1. Company Overview
- 12.1.1.2. Products
- 12.1.1.3. Company Financials
- 12.1.1.4. SWOT Analysis
- 12.1.2 Centinel Spine LLC
- 12.1.2.1. Company Overview
- 12.1.2.2. Products
- 12.1.2.3. Company Financials
- 12.1.2.4. SWOT Analysis
- 12.1.3 Medtronic PLC
- 12.1.3.1. Company Overview
- 12.1.3.2. Products
- 12.1.3.3. Company Financials
- 12.1.3.4. SWOT Analysis
- 12.1.4 Prodorth Spine
- 12.1.4.1. Company Overview
- 12.1.4.2. Products
- 12.1.4.3. Company Financials
- 12.1.4.4. SWOT Analysis
- 12.1.5 Globus Medical
- 12.1.5.1. Company Overview
- 12.1.5.2. Products
- 12.1.5.3. Company Financials
- 12.1.5.4. SWOT Analysis
- 12.1.6 Orthofix Medical Inc
- 12.1.6.1. Company Overview
- 12.1.6.2. Products
- 12.1.6.3. Company Financials
- 12.1.6.4. SWOT Analysis
- 12.1.7 B Braun Melsungen
- 12.1.7.1. Company Overview
- 12.1.7.2. Products
- 12.1.7.3. Company Financials
- 12.1.7.4. SWOT Analysis
- 12.1.8 Synergy Spine Solutions Inc
- 12.1.8.1. Company Overview
- 12.1.8.2. Products
- 12.1.8.3. Company Financials
- 12.1.8.4. SWOT Analysis
- 12.1.9 Spineart SA
- 12.1.9.1. Company Overview
- 12.1.9.2. Products
- 12.1.9.3. Company Financials
- 12.1.9.4. SWOT Analysis
- 12.1.10 NuVasive Inc
- 12.1.10.1. Company Overview
- 12.1.10.2. Products
- 12.1.10.3. Company Financials
- 12.1.10.4. SWOT Analysis
- 12.1.11 AxioMed LLC
- 12.1.11.1. Company Overview
- 12.1.11.2. Products
- 12.1.11.3. Company Financials
- 12.1.11.4. SWOT Analysis
- 12.1.1 Zimmer Biomet
- 12.2. Market Entropy
- 12.2.1 Company's Key Areas Served
- 12.2.2 Recent Developments
- 12.3. Company Market Share Analysis 2025
- 12.3.1 Top 5 Companies Market Share Analysis
- 12.3.2 Top 3 Companies Market Share Analysis
- 12.4. List of Potential Customers
- 13. Research Methodology
List of Figures
- Figure 1: Global Artificial Cervical Disc Industry Revenue Breakdown (million, %) by Region 2025 & 2033
- Figure 2: Global Artificial Cervical Disc Industry Volume Breakdown (K Unit, %) by Region 2025 & 2033
- Figure 3: North America Artificial Cervical Disc Industry Revenue (million), by Disc Type 2025 & 2033
- Figure 4: North America Artificial Cervical Disc Industry Volume (K Unit), by Disc Type 2025 & 2033
- Figure 5: North America Artificial Cervical Disc Industry Revenue Share (%), by Disc Type 2025 & 2033
- Figure 6: North America Artificial Cervical Disc Industry Volume Share (%), by Disc Type 2025 & 2033
- Figure 7: North America Artificial Cervical Disc Industry Revenue (million), by Material Type 2025 & 2033
- Figure 8: North America Artificial Cervical Disc Industry Volume (K Unit), by Material Type 2025 & 2033
- Figure 9: North America Artificial Cervical Disc Industry Revenue Share (%), by Material Type 2025 & 2033
- Figure 10: North America Artificial Cervical Disc Industry Volume Share (%), by Material Type 2025 & 2033
- Figure 11: North America Artificial Cervical Disc Industry Revenue (million), by Country 2025 & 2033
- Figure 12: North America Artificial Cervical Disc Industry Volume (K Unit), by Country 2025 & 2033
- Figure 13: North America Artificial Cervical Disc Industry Revenue Share (%), by Country 2025 & 2033
- Figure 14: North America Artificial Cervical Disc Industry Volume Share (%), by Country 2025 & 2033
- Figure 15: Europe Artificial Cervical Disc Industry Revenue (million), by Disc Type 2025 & 2033
- Figure 16: Europe Artificial Cervical Disc Industry Volume (K Unit), by Disc Type 2025 & 2033
- Figure 17: Europe Artificial Cervical Disc Industry Revenue Share (%), by Disc Type 2025 & 2033
- Figure 18: Europe Artificial Cervical Disc Industry Volume Share (%), by Disc Type 2025 & 2033
- Figure 19: Europe Artificial Cervical Disc Industry Revenue (million), by Material Type 2025 & 2033
- Figure 20: Europe Artificial Cervical Disc Industry Volume (K Unit), by Material Type 2025 & 2033
- Figure 21: Europe Artificial Cervical Disc Industry Revenue Share (%), by Material Type 2025 & 2033
- Figure 22: Europe Artificial Cervical Disc Industry Volume Share (%), by Material Type 2025 & 2033
- Figure 23: Europe Artificial Cervical Disc Industry Revenue (million), by Country 2025 & 2033
- Figure 24: Europe Artificial Cervical Disc Industry Volume (K Unit), by Country 2025 & 2033
- Figure 25: Europe Artificial Cervical Disc Industry Revenue Share (%), by Country 2025 & 2033
- Figure 26: Europe Artificial Cervical Disc Industry Volume Share (%), by Country 2025 & 2033
- Figure 27: Asia Pacific Artificial Cervical Disc Industry Revenue (million), by Disc Type 2025 & 2033
- Figure 28: Asia Pacific Artificial Cervical Disc Industry Volume (K Unit), by Disc Type 2025 & 2033
- Figure 29: Asia Pacific Artificial Cervical Disc Industry Revenue Share (%), by Disc Type 2025 & 2033
- Figure 30: Asia Pacific Artificial Cervical Disc Industry Volume Share (%), by Disc Type 2025 & 2033
- Figure 31: Asia Pacific Artificial Cervical Disc Industry Revenue (million), by Material Type 2025 & 2033
- Figure 32: Asia Pacific Artificial Cervical Disc Industry Volume (K Unit), by Material Type 2025 & 2033
- Figure 33: Asia Pacific Artificial Cervical Disc Industry Revenue Share (%), by Material Type 2025 & 2033
- Figure 34: Asia Pacific Artificial Cervical Disc Industry Volume Share (%), by Material Type 2025 & 2033
- Figure 35: Asia Pacific Artificial Cervical Disc Industry Revenue (million), by Country 2025 & 2033
- Figure 36: Asia Pacific Artificial Cervical Disc Industry Volume (K Unit), by Country 2025 & 2033
- Figure 37: Asia Pacific Artificial Cervical Disc Industry Revenue Share (%), by Country 2025 & 2033
- Figure 38: Asia Pacific Artificial Cervical Disc Industry Volume Share (%), by Country 2025 & 2033
- Figure 39: Middle East and Africa Artificial Cervical Disc Industry Revenue (million), by Disc Type 2025 & 2033
- Figure 40: Middle East and Africa Artificial Cervical Disc Industry Volume (K Unit), by Disc Type 2025 & 2033
- Figure 41: Middle East and Africa Artificial Cervical Disc Industry Revenue Share (%), by Disc Type 2025 & 2033
- Figure 42: Middle East and Africa Artificial Cervical Disc Industry Volume Share (%), by Disc Type 2025 & 2033
- Figure 43: Middle East and Africa Artificial Cervical Disc Industry Revenue (million), by Material Type 2025 & 2033
- Figure 44: Middle East and Africa Artificial Cervical Disc Industry Volume (K Unit), by Material Type 2025 & 2033
- Figure 45: Middle East and Africa Artificial Cervical Disc Industry Revenue Share (%), by Material Type 2025 & 2033
- Figure 46: Middle East and Africa Artificial Cervical Disc Industry Volume Share (%), by Material Type 2025 & 2033
- Figure 47: Middle East and Africa Artificial Cervical Disc Industry Revenue (million), by Country 2025 & 2033
- Figure 48: Middle East and Africa Artificial Cervical Disc Industry Volume (K Unit), by Country 2025 & 2033
- Figure 49: Middle East and Africa Artificial Cervical Disc Industry Revenue Share (%), by Country 2025 & 2033
- Figure 50: Middle East and Africa Artificial Cervical Disc Industry Volume Share (%), by Country 2025 & 2033
- Figure 51: South America Artificial Cervical Disc Industry Revenue (million), by Disc Type 2025 & 2033
- Figure 52: South America Artificial Cervical Disc Industry Volume (K Unit), by Disc Type 2025 & 2033
- Figure 53: South America Artificial Cervical Disc Industry Revenue Share (%), by Disc Type 2025 & 2033
- Figure 54: South America Artificial Cervical Disc Industry Volume Share (%), by Disc Type 2025 & 2033
- Figure 55: South America Artificial Cervical Disc Industry Revenue (million), by Material Type 2025 & 2033
- Figure 56: South America Artificial Cervical Disc Industry Volume (K Unit), by Material Type 2025 & 2033
- Figure 57: South America Artificial Cervical Disc Industry Revenue Share (%), by Material Type 2025 & 2033
- Figure 58: South America Artificial Cervical Disc Industry Volume Share (%), by Material Type 2025 & 2033
- Figure 59: South America Artificial Cervical Disc Industry Revenue (million), by Country 2025 & 2033
- Figure 60: South America Artificial Cervical Disc Industry Volume (K Unit), by Country 2025 & 2033
- Figure 61: South America Artificial Cervical Disc Industry Revenue Share (%), by Country 2025 & 2033
- Figure 62: South America Artificial Cervical Disc Industry Volume Share (%), by Country 2025 & 2033
List of Tables
- Table 1: Global Artificial Cervical Disc Industry Revenue million Forecast, by Disc Type 2020 & 2033
- Table 2: Global Artificial Cervical Disc Industry Volume K Unit Forecast, by Disc Type 2020 & 2033
- Table 3: Global Artificial Cervical Disc Industry Revenue million Forecast, by Material Type 2020 & 2033
- Table 4: Global Artificial Cervical Disc Industry Volume K Unit Forecast, by Material Type 2020 & 2033
- Table 5: Global Artificial Cervical Disc Industry Revenue million Forecast, by Region 2020 & 2033
- Table 6: Global Artificial Cervical Disc Industry Volume K Unit Forecast, by Region 2020 & 2033
- Table 7: Global Artificial Cervical Disc Industry Revenue million Forecast, by Disc Type 2020 & 2033
- Table 8: Global Artificial Cervical Disc Industry Volume K Unit Forecast, by Disc Type 2020 & 2033
- Table 9: Global Artificial Cervical Disc Industry Revenue million Forecast, by Material Type 2020 & 2033
- Table 10: Global Artificial Cervical Disc Industry Volume K Unit Forecast, by Material Type 2020 & 2033
- Table 11: Global Artificial Cervical Disc Industry Revenue million Forecast, by Country 2020 & 2033
- Table 12: Global Artificial Cervical Disc Industry Volume K Unit Forecast, by Country 2020 & 2033
- Table 13: United States Artificial Cervical Disc Industry Revenue (million) Forecast, by Application 2020 & 2033
- Table 14: United States Artificial Cervical Disc Industry Volume (K Unit) Forecast, by Application 2020 & 2033
- Table 15: Canada Artificial Cervical Disc Industry Revenue (million) Forecast, by Application 2020 & 2033
- Table 16: Canada Artificial Cervical Disc Industry Volume (K Unit) Forecast, by Application 2020 & 2033
- Table 17: Mexico Artificial Cervical Disc Industry Revenue (million) Forecast, by Application 2020 & 2033
- Table 18: Mexico Artificial Cervical Disc Industry Volume (K Unit) Forecast, by Application 2020 & 2033
- Table 19: Global Artificial Cervical Disc Industry Revenue million Forecast, by Disc Type 2020 & 2033
- Table 20: Global Artificial Cervical Disc Industry Volume K Unit Forecast, by Disc Type 2020 & 2033
- Table 21: Global Artificial Cervical Disc Industry Revenue million Forecast, by Material Type 2020 & 2033
- Table 22: Global Artificial Cervical Disc Industry Volume K Unit Forecast, by Material Type 2020 & 2033
- Table 23: Global Artificial Cervical Disc Industry Revenue million Forecast, by Country 2020 & 2033
- Table 24: Global Artificial Cervical Disc Industry Volume K Unit Forecast, by Country 2020 & 2033
- Table 25: Germany Artificial Cervical Disc Industry Revenue (million) Forecast, by Application 2020 & 2033
- Table 26: Germany Artificial Cervical Disc Industry Volume (K Unit) Forecast, by Application 2020 & 2033
- Table 27: United Kingdom Artificial Cervical Disc Industry Revenue (million) Forecast, by Application 2020 & 2033
- Table 28: United Kingdom Artificial Cervical Disc Industry Volume (K Unit) Forecast, by Application 2020 & 2033
- Table 29: France Artificial Cervical Disc Industry Revenue (million) Forecast, by Application 2020 & 2033
- Table 30: France Artificial Cervical Disc Industry Volume (K Unit) Forecast, by Application 2020 & 2033
- Table 31: Italy Artificial Cervical Disc Industry Revenue (million) Forecast, by Application 2020 & 2033
- Table 32: Italy Artificial Cervical Disc Industry Volume (K Unit) Forecast, by Application 2020 & 2033
- Table 33: Spain Artificial Cervical Disc Industry Revenue (million) Forecast, by Application 2020 & 2033
- Table 34: Spain Artificial Cervical Disc Industry Volume (K Unit) Forecast, by Application 2020 & 2033
- Table 35: Rest of Europe Artificial Cervical Disc Industry Revenue (million) Forecast, by Application 2020 & 2033
- Table 36: Rest of Europe Artificial Cervical Disc Industry Volume (K Unit) Forecast, by Application 2020 & 2033
- Table 37: Global Artificial Cervical Disc Industry Revenue million Forecast, by Disc Type 2020 & 2033
- Table 38: Global Artificial Cervical Disc Industry Volume K Unit Forecast, by Disc Type 2020 & 2033
- Table 39: Global Artificial Cervical Disc Industry Revenue million Forecast, by Material Type 2020 & 2033
- Table 40: Global Artificial Cervical Disc Industry Volume K Unit Forecast, by Material Type 2020 & 2033
- Table 41: Global Artificial Cervical Disc Industry Revenue million Forecast, by Country 2020 & 2033
- Table 42: Global Artificial Cervical Disc Industry Volume K Unit Forecast, by Country 2020 & 2033
- Table 43: China Artificial Cervical Disc Industry Revenue (million) Forecast, by Application 2020 & 2033
- Table 44: China Artificial Cervical Disc Industry Volume (K Unit) Forecast, by Application 2020 & 2033
- Table 45: Japan Artificial Cervical Disc Industry Revenue (million) Forecast, by Application 2020 & 2033
- Table 46: Japan Artificial Cervical Disc Industry Volume (K Unit) Forecast, by Application 2020 & 2033
- Table 47: India Artificial Cervical Disc Industry Revenue (million) Forecast, by Application 2020 & 2033
- Table 48: India Artificial Cervical Disc Industry Volume (K Unit) Forecast, by Application 2020 & 2033
- Table 49: Australia Artificial Cervical Disc Industry Revenue (million) Forecast, by Application 2020 & 2033
- Table 50: Australia Artificial Cervical Disc Industry Volume (K Unit) Forecast, by Application 2020 & 2033
- Table 51: South Korea Artificial Cervical Disc Industry Revenue (million) Forecast, by Application 2020 & 2033
- Table 52: South Korea Artificial Cervical Disc Industry Volume (K Unit) Forecast, by Application 2020 & 2033
- Table 53: Rest of Asia Pacific Artificial Cervical Disc Industry Revenue (million) Forecast, by Application 2020 & 2033
- Table 54: Rest of Asia Pacific Artificial Cervical Disc Industry Volume (K Unit) Forecast, by Application 2020 & 2033
- Table 55: Global Artificial Cervical Disc Industry Revenue million Forecast, by Disc Type 2020 & 2033
- Table 56: Global Artificial Cervical Disc Industry Volume K Unit Forecast, by Disc Type 2020 & 2033
- Table 57: Global Artificial Cervical Disc Industry Revenue million Forecast, by Material Type 2020 & 2033
- Table 58: Global Artificial Cervical Disc Industry Volume K Unit Forecast, by Material Type 2020 & 2033
- Table 59: Global Artificial Cervical Disc Industry Revenue million Forecast, by Country 2020 & 2033
- Table 60: Global Artificial Cervical Disc Industry Volume K Unit Forecast, by Country 2020 & 2033
- Table 61: GCC Artificial Cervical Disc Industry Revenue (million) Forecast, by Application 2020 & 2033
- Table 62: GCC Artificial Cervical Disc Industry Volume (K Unit) Forecast, by Application 2020 & 2033
- Table 63: South Africa Artificial Cervical Disc Industry Revenue (million) Forecast, by Application 2020 & 2033
- Table 64: South Africa Artificial Cervical Disc Industry Volume (K Unit) Forecast, by Application 2020 & 2033
- Table 65: Rest of Middle East and Africa Artificial Cervical Disc Industry Revenue (million) Forecast, by Application 2020 & 2033
- Table 66: Rest of Middle East and Africa Artificial Cervical Disc Industry Volume (K Unit) Forecast, by Application 2020 & 2033
- Table 67: Global Artificial Cervical Disc Industry Revenue million Forecast, by Disc Type 2020 & 2033
- Table 68: Global Artificial Cervical Disc Industry Volume K Unit Forecast, by Disc Type 2020 & 2033
- Table 69: Global Artificial Cervical Disc Industry Revenue million Forecast, by Material Type 2020 & 2033
- Table 70: Global Artificial Cervical Disc Industry Volume K Unit Forecast, by Material Type 2020 & 2033
- Table 71: Global Artificial Cervical Disc Industry Revenue million Forecast, by Country 2020 & 2033
- Table 72: Global Artificial Cervical Disc Industry Volume K Unit Forecast, by Country 2020 & 2033
- Table 73: Brazil Artificial Cervical Disc Industry Revenue (million) Forecast, by Application 2020 & 2033
- Table 74: Brazil Artificial Cervical Disc Industry Volume (K Unit) Forecast, by Application 2020 & 2033
- Table 75: Argentina Artificial Cervical Disc Industry Revenue (million) Forecast, by Application 2020 & 2033
- Table 76: Argentina Artificial Cervical Disc Industry Volume (K Unit) Forecast, by Application 2020 & 2033
- Table 77: Rest of South America Artificial Cervical Disc Industry Revenue (million) Forecast, by Application 2020 & 2033
- Table 78: Rest of South America Artificial Cervical Disc Industry Volume (K Unit) Forecast, by Application 2020 & 2033
Frequently Asked Questions
1. What is the projected Compound Annual Growth Rate (CAGR) of the Artificial Cervical Disc Industry?
The projected CAGR is approximately 12.4%.
2. Which companies are prominent players in the Artificial Cervical Disc Industry?
Key companies in the market include Zimmer Biomet, Centinel Spine LLC, Medtronic PLC, Prodorth Spine, Globus Medical, Orthofix Medical Inc, B Braun Melsungen, Synergy Spine Solutions Inc, Spineart SA, NuVasive Inc, AxioMed LLC.
3. What are the main segments of the Artificial Cervical Disc Industry?
The market segments include Disc Type, Material Type.
4. Can you provide details about the market size?
The market size is estimated to be USD 350.88 million as of 2022.
5. What are some drivers contributing to market growth?
Growing Burden of Spine Related Diseases; Increasing Research and Development Activities in Relation to Spine Technologies; Growing Geriatric Population and Increasing Preference for Minimally Invasive Surgeries.
6. What are the notable trends driving market growth?
Cervical Artificial Disc Segment is Expected to Hold a Significant Market Share Over the Forecast Period.
7. Are there any restraints impacting market growth?
Reimbursement Issues; High Cost of Procedures.
8. Can you provide examples of recent developments in the market?
In November 2022, Centinel Spine, LLC announced the first implantation of its prodisc C SK, a cervical artificial disc.
9. What pricing options are available for accessing the report?
Pricing options include single-user, multi-user, and enterprise licenses priced at USD 4750, USD 5250, and USD 8750 respectively.
10. Is the market size provided in terms of value or volume?
The market size is provided in terms of value, measured in million and volume, measured in K Unit.
11. Are there any specific market keywords associated with the report?
Yes, the market keyword associated with the report is "Artificial Cervical Disc Industry," which aids in identifying and referencing the specific market segment covered.
12. How do I determine which pricing option suits my needs best?
The pricing options vary based on user requirements and access needs. Individual users may opt for single-user licenses, while businesses requiring broader access may choose multi-user or enterprise licenses for cost-effective access to the report.
13. Are there any additional resources or data provided in the Artificial Cervical Disc Industry report?
While the report offers comprehensive insights, it's advisable to review the specific contents or supplementary materials provided to ascertain if additional resources or data are available.
14. How can I stay updated on further developments or reports in the Artificial Cervical Disc Industry?
To stay informed about further developments, trends, and reports in the Artificial Cervical Disc Industry, consider subscribing to industry newsletters, following relevant companies and organizations, or regularly checking reputable industry news sources and publications.
Methodology
Step 1 - Identification of Relevant Samples Size from Population Database


Step 2 - Approaches for Defining Global Market Size (Value, Volume* & Price*)

Note*: In applicable scenarios
Step 3 - Data Sources
Primary Research
- Web Analytics
- Survey Reports
- Research Institute
- Latest Research Reports
- Opinion Leaders
Secondary Research
- Annual Reports
- White Paper
- Latest Press Release
- Industry Association
- Paid Database
- Investor Presentations

Step 4 - Data Triangulation
Involves using different sources of information in order to increase the validity of a study
These sources are likely to be stakeholders in a program - participants, other researchers, program staff, other community members, and so on.
Then we put all data in single framework & apply various statistical tools to find out the dynamic on the market.
During the analysis stage, feedback from the stakeholder groups would be compared to determine areas of agreement as well as areas of divergence