

Key Insights
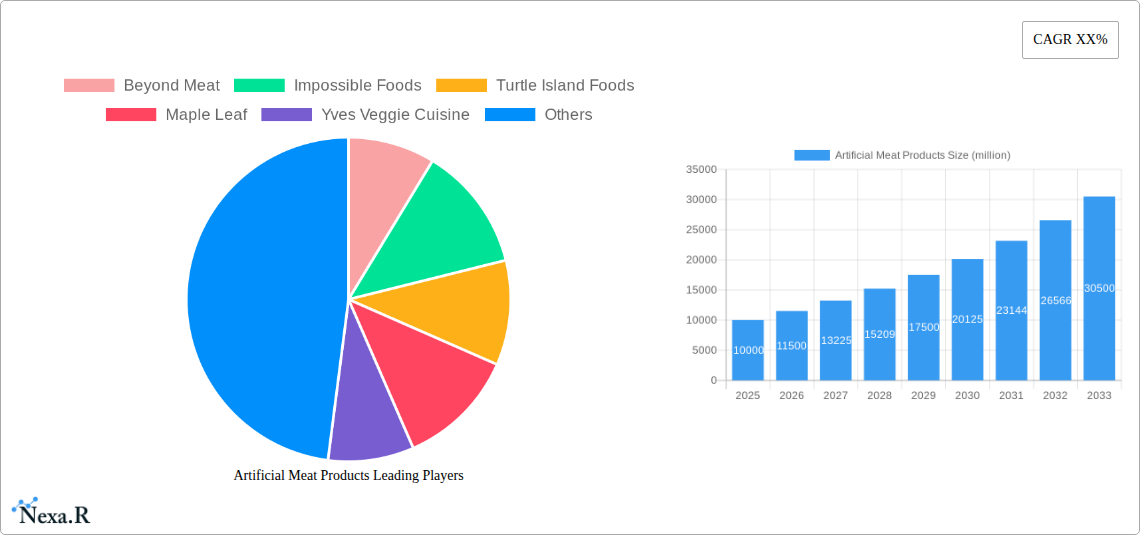
The global artificial meat market is experiencing significant growth, driven by increasing consumer awareness of health and environmental concerns related to traditional meat consumption. The market, estimated at $10 billion in 2025, is projected to exhibit a robust Compound Annual Growth Rate (CAGR) of 15% from 2025 to 2033, reaching an estimated market value of $35 billion by 2033. This growth is fueled by several key factors: a rising demand for sustainable and ethical food sources, advancements in the production technology leading to improved taste and texture of artificial meat products, and increasing investments from both established food companies and venture capitalists in the sector. Key market segments include plant-based meat alternatives (Beyond Meat, Impossible Foods) and cultivated meat (currently in early stages of commercialization), with plant-based dominating the current market share. Regional growth is expected to be robust in North America and Europe, driven by high consumer acceptance and regulatory support, while Asia-Pacific is projected to show significant growth potential in the coming years.
However, several restraints are hindering the broader adoption of artificial meat products. High production costs compared to conventional meat remain a significant obstacle, especially for cultivated meat. Consumer perceptions and concerns regarding taste, texture, and potential health effects also need to be addressed through continuous product improvement and effective marketing campaigns. Furthermore, regulatory frameworks and labeling standards are still evolving, posing challenges for manufacturers. Despite these challenges, the long-term outlook for the artificial meat market remains positive. Ongoing research and development will likely overcome many of these hurdles, driving further market expansion and creating new opportunities for established food giants and innovative start-ups alike. Companies like Beyond Meat, Impossible Foods, and Nestlé are leading the charge, but the market is expected to see further consolidation and the emergence of new players in the coming years.
Artificial Meat Products Market Report: 2019-2033
A comprehensive analysis of the rapidly expanding artificial meat market, encompassing market dynamics, growth trends, regional dominance, product landscape, challenges, opportunities, and key players. This report provides an in-depth examination of the artificial meat products market, covering the period from 2019 to 2033, with a focus on the forecast period of 2025-2033 and a base year of 2025. The report segments the market into various categories to provide a granular understanding of the industry and pinpoint lucrative opportunities for stakeholders. This report is invaluable for investors, industry professionals, and businesses seeking to understand and capitalize on the burgeoning artificial meat market. The market is valued at xx million units in 2025 and is projected to reach xx million units by 2033.
Artificial Meat Products Market Dynamics & Structure
This section analyzes the competitive landscape, technological advancements, regulatory environment, and market trends influencing the growth of artificial meat products. The market is characterized by a dynamic interplay of established food giants and innovative startups.
- Market Concentration: The market is currently moderately concentrated, with key players such as Beyond Meat and Impossible Foods holding significant market share. However, smaller players and new entrants are continuously emerging, leading to increased competition. We estimate the top 5 players hold approximately xx% of the market share in 2025.
- Technological Innovation: Continuous advancements in plant-based protein technology, such as precision fermentation and 3D bioprinting, are driving product innovation and improving the taste, texture, and nutritional value of artificial meat.
- Regulatory Frameworks: Government regulations and policies regarding labeling, safety, and nutritional standards significantly impact market growth. Variations in regulatory frameworks across different regions influence market penetration rates.
- Competitive Product Substitutes: Traditional meat products remain the primary substitute, though consumer preferences are shifting towards plant-based alternatives driven by health, ethical, and environmental concerns.
- End-User Demographics: The primary end-users are health-conscious consumers, vegetarians, vegans, and flexitarians. Growing awareness of environmental sustainability and animal welfare further fuels demand.
- M&A Trends: The artificial meat market has witnessed significant mergers and acquisitions (M&A) activity in recent years, with larger food companies acquiring smaller innovative startups to expand their product portfolio and market share. We project xx M&A deals in the forecast period. These strategic acquisitions fuel innovation and expand the market reach of artificial meat products.
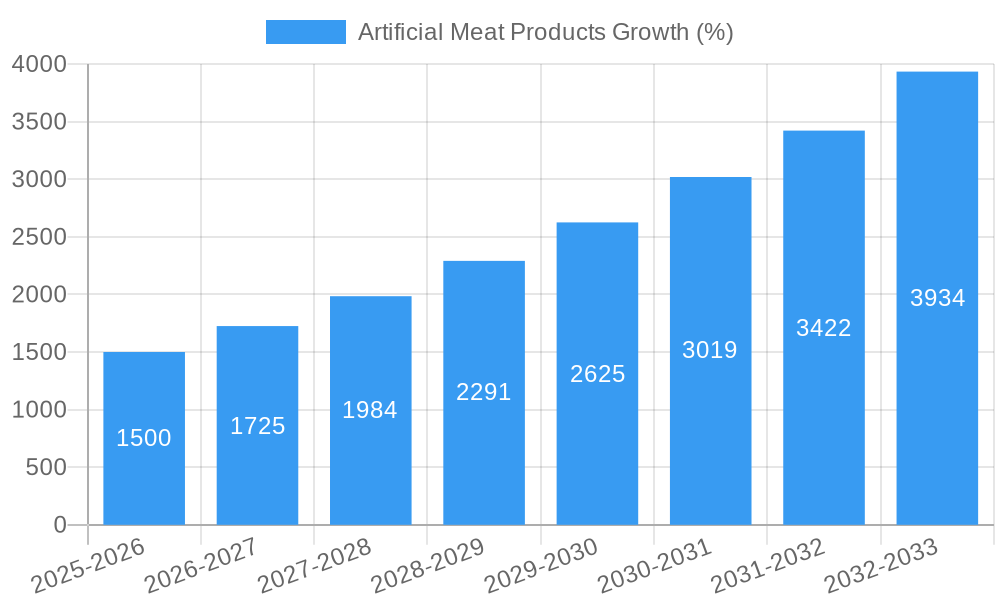
Artificial Meat Products Growth Trends & Insights
This section details the historical and projected growth of the artificial meat market, along with key market drivers. Utilizing both quantitative and qualitative data, this analysis paints a comprehensive picture of market evolution and consumer behavior.
The global artificial meat market experienced a CAGR of xx% during the historical period (2019-2024), driven by increasing consumer demand for plant-based protein alternatives. The market is expected to maintain strong growth momentum during the forecast period (2025-2033), with a projected CAGR of xx%. This growth is largely attributed to factors such as rising health consciousness, growing environmental concerns, and technological advancements in the production of plant-based meat alternatives. Increased market penetration is expected, particularly in developed regions where consumer awareness and adoption rates are high. Technological disruptions, such as the development of more realistic and palatable plant-based meat products, will further accelerate market expansion. Consumer behavior is shifting towards more sustainable and ethical food choices, directly influencing the growth of the artificial meat market.
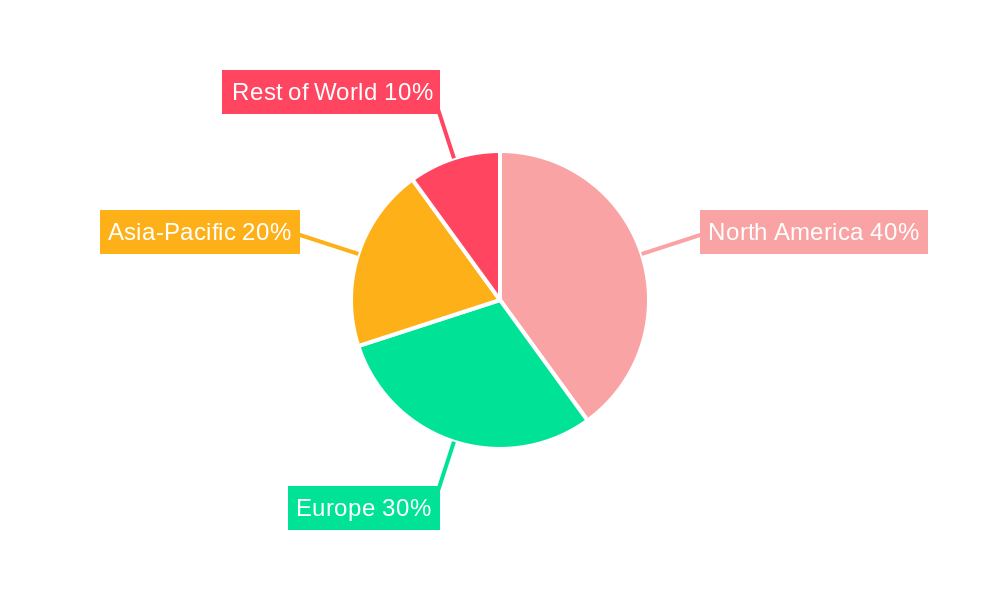
Dominant Regions, Countries, or Segments in Artificial Meat Products
North America currently dominates the global artificial meat market, followed by Europe and Asia-Pacific. The high adoption rate in North America is primarily attributed to factors such as strong consumer awareness, high disposable incomes, and a well-established distribution network for plant-based products. However, Asia-Pacific is expected to witness the fastest growth rate in the coming years, driven by rising demand, increasing population, and rapid economic development in emerging markets.
- North America: Strong consumer awareness, high disposable incomes, and well-established distribution channels are key drivers of market dominance.
- Europe: Growing consumer preference for sustainable and ethical food products contributes to market growth.
- Asia-Pacific: Rapid economic development and a large population base create significant growth potential. Government initiatives promoting sustainable food systems further accelerate market expansion.
- Other Regions: Latin America and Africa show promising growth potential, though adoption rates are relatively low at present due to factors such as lower disposable incomes and limited product availability.
Artificial Meat Products Product Landscape
The artificial meat market offers a diverse range of products, including plant-based burgers, sausages, chicken nuggets, and ground meat alternatives. These products vary in terms of ingredients, processing techniques, taste, and texture. Continuous product innovation is focused on enhancing taste and texture to closely mimic traditional meat products. Technological advancements such as 3D bioprinting and precision fermentation are pushing the boundaries of artificial meat production, enabling the creation of increasingly sophisticated products. Unique selling propositions often focus on health benefits, environmental sustainability, and ethical concerns.
Key Drivers, Barriers & Challenges in Artificial Meat Products
Key Drivers:
- Rising consumer demand for plant-based protein.
- Growing awareness of environmental and ethical issues related to animal agriculture.
- Technological advancements improving the taste, texture, and nutritional value of artificial meat.
- Favorable government policies and initiatives supporting sustainable food systems.
Key Challenges and Restraints:
- High production costs compared to traditional meat products. This limits accessibility for lower-income consumers. Production cost reductions are estimated to be a key factor for future growth.
- Regulatory uncertainties and varying standards across different regions create complexities for manufacturers and distributors.
- Consumer perception and acceptance remain a challenge in some markets. Overcoming negative perceptions and fostering positive attitudes is key to broader adoption.
- Competition from established meat companies and new entrants in the market. Maintaining a competitive edge requires continuous innovation and effective marketing strategies.
Emerging Opportunities in Artificial Meat Products
- Expansion into untapped markets in developing economies.
- Development of novel applications, such as artificial seafood and other animal products.
- Catering to evolving consumer preferences, including the growing demand for personalized nutrition and functional foods.
- Strategic partnerships and collaborations with food retailers and distributors.
Growth Accelerators in the Artificial Meat Products Industry
Technological breakthroughs in plant-based protein production, coupled with strategic partnerships and market expansion strategies, are crucial growth drivers for the artificial meat industry. Increased investment in research and development is vital for creating more realistic and affordable products. Expanding distribution networks to reach a wider consumer base is essential for increasing market penetration.
Key Players Shaping the Artificial Meat Products Market
- Beyond Meat
- Impossible Foods
- Turtle Island Foods
- Maple Leaf
- Yves Veggie Cuisine
- Nestle
- Kellogg’s (Morningstar Farms)
- Omnifood
- Qishan Foods
- Hongchang Food
- Sulian Food
- Fuzhou Sutianxia
Notable Milestones in Artificial Meat Products Sector
- 2020: Beyond Meat and Impossible Foods experience significant market expansion.
- 2021: Several major food companies invest heavily in the artificial meat sector.
- 2022: Significant advancements in cultivated meat technology are reported.
- 2023: Regulatory approvals for cultivated meat products expand in several regions.
- 2024: New product launches and strategic partnerships drive market growth.
In-Depth Artificial Meat Products Market Outlook
The artificial meat market is poised for sustained growth, driven by technological advancements, consumer preferences, and increasing environmental awareness. Strategic opportunities exist in developing innovative products, expanding into new markets, and forming strategic partnerships. Future market potential is significant, with the market expected to reach xx million units by 2033. Companies that successfully adapt to changing consumer demands and technological advancements are well-positioned to capture substantial market share.
Artificial Meat Products Segmentation
-
1. Application
- 1.1. Food
- 1.2. Retail
-
2. Types
- 2.1. Meat Products
- 2.2. Meat
Artificial Meat Products Segmentation By Geography
-
1. North America
- 1.1. United States
- 1.2. Canada
- 1.3. Mexico
-
2. South America
- 2.1. Brazil
- 2.2. Argentina
- 2.3. Rest of South America
-
3. Europe
- 3.1. United Kingdom
- 3.2. Germany
- 3.3. France
- 3.4. Italy
- 3.5. Spain
- 3.6. Russia
- 3.7. Benelux
- 3.8. Nordics
- 3.9. Rest of Europe
-
4. Middle East & Africa
- 4.1. Turkey
- 4.2. Israel
- 4.3. GCC
- 4.4. North Africa
- 4.5. South Africa
- 4.6. Rest of Middle East & Africa
-
5. Asia Pacific
- 5.1. China
- 5.2. India
- 5.3. Japan
- 5.4. South Korea
- 5.5. ASEAN
- 5.6. Oceania
- 5.7. Rest of Asia Pacific
Artificial Meat Products REPORT HIGHLIGHTS
| Aspects | Details |
|---|---|
| Study Period | 2019-2033 |
| Base Year | 2024 |
| Estimated Year | 2025 |
| Forecast Period | 2025-2033 |
| Historical Period | 2019-2024 |
| Growth Rate | CAGR of XX% from 2019-2033 |
| Segmentation |
|
Table of Contents
- 1. Introduction
- 1.1. Research Scope
- 1.2. Market Segmentation
- 1.3. Research Methodology
- 1.4. Definitions and Assumptions
- 2. Executive Summary
- 2.1. Introduction
- 3. Market Dynamics
- 3.1. Introduction
- 3.2. Market Drivers
- 3.3. Market Restrains
- 3.4. Market Trends
- 4. Market Factor Analysis
- 4.1. Porters Five Forces
- 4.2. Supply/Value Chain
- 4.3. PESTEL analysis
- 4.4. Market Entropy
- 4.5. Patent/Trademark Analysis
- 5. Global Artificial Meat Products Analysis, Insights and Forecast, 2019-2031
- 5.1. Market Analysis, Insights and Forecast - by Application
- 5.1.1. Food
- 5.1.2. Retail
- 5.2. Market Analysis, Insights and Forecast - by Types
- 5.2.1. Meat Products
- 5.2.2. Meat
- 5.3. Market Analysis, Insights and Forecast - by Region
- 5.3.1. North America
- 5.3.2. South America
- 5.3.3. Europe
- 5.3.4. Middle East & Africa
- 5.3.5. Asia Pacific
- 5.1. Market Analysis, Insights and Forecast - by Application
- 6. North America Artificial Meat Products Analysis, Insights and Forecast, 2019-2031
- 6.1. Market Analysis, Insights and Forecast - by Application
- 6.1.1. Food
- 6.1.2. Retail
- 6.2. Market Analysis, Insights and Forecast - by Types
- 6.2.1. Meat Products
- 6.2.2. Meat
- 6.1. Market Analysis, Insights and Forecast - by Application
- 7. South America Artificial Meat Products Analysis, Insights and Forecast, 2019-2031
- 7.1. Market Analysis, Insights and Forecast - by Application
- 7.1.1. Food
- 7.1.2. Retail
- 7.2. Market Analysis, Insights and Forecast - by Types
- 7.2.1. Meat Products
- 7.2.2. Meat
- 7.1. Market Analysis, Insights and Forecast - by Application
- 8. Europe Artificial Meat Products Analysis, Insights and Forecast, 2019-2031
- 8.1. Market Analysis, Insights and Forecast - by Application
- 8.1.1. Food
- 8.1.2. Retail
- 8.2. Market Analysis, Insights and Forecast - by Types
- 8.2.1. Meat Products
- 8.2.2. Meat
- 8.1. Market Analysis, Insights and Forecast - by Application
- 9. Middle East & Africa Artificial Meat Products Analysis, Insights and Forecast, 2019-2031
- 9.1. Market Analysis, Insights and Forecast - by Application
- 9.1.1. Food
- 9.1.2. Retail
- 9.2. Market Analysis, Insights and Forecast - by Types
- 9.2.1. Meat Products
- 9.2.2. Meat
- 9.1. Market Analysis, Insights and Forecast - by Application
- 10. Asia Pacific Artificial Meat Products Analysis, Insights and Forecast, 2019-2031
- 10.1. Market Analysis, Insights and Forecast - by Application
- 10.1.1. Food
- 10.1.2. Retail
- 10.2. Market Analysis, Insights and Forecast - by Types
- 10.2.1. Meat Products
- 10.2.2. Meat
- 10.1. Market Analysis, Insights and Forecast - by Application
- 11. Competitive Analysis
- 11.1. Global Market Share Analysis 2024
- 11.2. Company Profiles
- 11.2.1 Beyond Meat
- 11.2.1.1. Overview
- 11.2.1.2. Products
- 11.2.1.3. SWOT Analysis
- 11.2.1.4. Recent Developments
- 11.2.1.5. Financials (Based on Availability)
- 11.2.2 Impossible Foods
- 11.2.2.1. Overview
- 11.2.2.2. Products
- 11.2.2.3. SWOT Analysis
- 11.2.2.4. Recent Developments
- 11.2.2.5. Financials (Based on Availability)
- 11.2.3 Turtle Island Foods
- 11.2.3.1. Overview
- 11.2.3.2. Products
- 11.2.3.3. SWOT Analysis
- 11.2.3.4. Recent Developments
- 11.2.3.5. Financials (Based on Availability)
- 11.2.4 Maple Leaf
- 11.2.4.1. Overview
- 11.2.4.2. Products
- 11.2.4.3. SWOT Analysis
- 11.2.4.4. Recent Developments
- 11.2.4.5. Financials (Based on Availability)
- 11.2.5 Yves Veggie Cuisine
- 11.2.5.1. Overview
- 11.2.5.2. Products
- 11.2.5.3. SWOT Analysis
- 11.2.5.4. Recent Developments
- 11.2.5.5. Financials (Based on Availability)
- 11.2.6 Nestle
- 11.2.6.1. Overview
- 11.2.6.2. Products
- 11.2.6.3. SWOT Analysis
- 11.2.6.4. Recent Developments
- 11.2.6.5. Financials (Based on Availability)
- 11.2.7 Kellogg’s (Morningstar Farms)
- 11.2.7.1. Overview
- 11.2.7.2. Products
- 11.2.7.3. SWOT Analysis
- 11.2.7.4. Recent Developments
- 11.2.7.5. Financials (Based on Availability)
- 11.2.8 Omnifood
- 11.2.8.1. Overview
- 11.2.8.2. Products
- 11.2.8.3. SWOT Analysis
- 11.2.8.4. Recent Developments
- 11.2.8.5. Financials (Based on Availability)
- 11.2.9 Qishan Foods
- 11.2.9.1. Overview
- 11.2.9.2. Products
- 11.2.9.3. SWOT Analysis
- 11.2.9.4. Recent Developments
- 11.2.9.5. Financials (Based on Availability)
- 11.2.10 Hongchang Food
- 11.2.10.1. Overview
- 11.2.10.2. Products
- 11.2.10.3. SWOT Analysis
- 11.2.10.4. Recent Developments
- 11.2.10.5. Financials (Based on Availability)
- 11.2.11 Sulian Food
- 11.2.11.1. Overview
- 11.2.11.2. Products
- 11.2.11.3. SWOT Analysis
- 11.2.11.4. Recent Developments
- 11.2.11.5. Financials (Based on Availability)
- 11.2.12 Fuzhou Sutianxia
- 11.2.12.1. Overview
- 11.2.12.2. Products
- 11.2.12.3. SWOT Analysis
- 11.2.12.4. Recent Developments
- 11.2.12.5. Financials (Based on Availability)
- 11.2.1 Beyond Meat
List of Figures
- Figure 1: Global Artificial Meat Products Revenue Breakdown (million, %) by Region 2024 & 2032
- Figure 2: Global Artificial Meat Products Volume Breakdown (K, %) by Region 2024 & 2032
- Figure 3: North America Artificial Meat Products Revenue (million), by Application 2024 & 2032
- Figure 4: North America Artificial Meat Products Volume (K), by Application 2024 & 2032
- Figure 5: North America Artificial Meat Products Revenue Share (%), by Application 2024 & 2032
- Figure 6: North America Artificial Meat Products Volume Share (%), by Application 2024 & 2032
- Figure 7: North America Artificial Meat Products Revenue (million), by Types 2024 & 2032
- Figure 8: North America Artificial Meat Products Volume (K), by Types 2024 & 2032
- Figure 9: North America Artificial Meat Products Revenue Share (%), by Types 2024 & 2032
- Figure 10: North America Artificial Meat Products Volume Share (%), by Types 2024 & 2032
- Figure 11: North America Artificial Meat Products Revenue (million), by Country 2024 & 2032
- Figure 12: North America Artificial Meat Products Volume (K), by Country 2024 & 2032
- Figure 13: North America Artificial Meat Products Revenue Share (%), by Country 2024 & 2032
- Figure 14: North America Artificial Meat Products Volume Share (%), by Country 2024 & 2032
- Figure 15: South America Artificial Meat Products Revenue (million), by Application 2024 & 2032
- Figure 16: South America Artificial Meat Products Volume (K), by Application 2024 & 2032
- Figure 17: South America Artificial Meat Products Revenue Share (%), by Application 2024 & 2032
- Figure 18: South America Artificial Meat Products Volume Share (%), by Application 2024 & 2032
- Figure 19: South America Artificial Meat Products Revenue (million), by Types 2024 & 2032
- Figure 20: South America Artificial Meat Products Volume (K), by Types 2024 & 2032
- Figure 21: South America Artificial Meat Products Revenue Share (%), by Types 2024 & 2032
- Figure 22: South America Artificial Meat Products Volume Share (%), by Types 2024 & 2032
- Figure 23: South America Artificial Meat Products Revenue (million), by Country 2024 & 2032
- Figure 24: South America Artificial Meat Products Volume (K), by Country 2024 & 2032
- Figure 25: South America Artificial Meat Products Revenue Share (%), by Country 2024 & 2032
- Figure 26: South America Artificial Meat Products Volume Share (%), by Country 2024 & 2032
- Figure 27: Europe Artificial Meat Products Revenue (million), by Application 2024 & 2032
- Figure 28: Europe Artificial Meat Products Volume (K), by Application 2024 & 2032
- Figure 29: Europe Artificial Meat Products Revenue Share (%), by Application 2024 & 2032
- Figure 30: Europe Artificial Meat Products Volume Share (%), by Application 2024 & 2032
- Figure 31: Europe Artificial Meat Products Revenue (million), by Types 2024 & 2032
- Figure 32: Europe Artificial Meat Products Volume (K), by Types 2024 & 2032
- Figure 33: Europe Artificial Meat Products Revenue Share (%), by Types 2024 & 2032
- Figure 34: Europe Artificial Meat Products Volume Share (%), by Types 2024 & 2032
- Figure 35: Europe Artificial Meat Products Revenue (million), by Country 2024 & 2032
- Figure 36: Europe Artificial Meat Products Volume (K), by Country 2024 & 2032
- Figure 37: Europe Artificial Meat Products Revenue Share (%), by Country 2024 & 2032
- Figure 38: Europe Artificial Meat Products Volume Share (%), by Country 2024 & 2032
- Figure 39: Middle East & Africa Artificial Meat Products Revenue (million), by Application 2024 & 2032
- Figure 40: Middle East & Africa Artificial Meat Products Volume (K), by Application 2024 & 2032
- Figure 41: Middle East & Africa Artificial Meat Products Revenue Share (%), by Application 2024 & 2032
- Figure 42: Middle East & Africa Artificial Meat Products Volume Share (%), by Application 2024 & 2032
- Figure 43: Middle East & Africa Artificial Meat Products Revenue (million), by Types 2024 & 2032
- Figure 44: Middle East & Africa Artificial Meat Products Volume (K), by Types 2024 & 2032
- Figure 45: Middle East & Africa Artificial Meat Products Revenue Share (%), by Types 2024 & 2032
- Figure 46: Middle East & Africa Artificial Meat Products Volume Share (%), by Types 2024 & 2032
- Figure 47: Middle East & Africa Artificial Meat Products Revenue (million), by Country 2024 & 2032
- Figure 48: Middle East & Africa Artificial Meat Products Volume (K), by Country 2024 & 2032
- Figure 49: Middle East & Africa Artificial Meat Products Revenue Share (%), by Country 2024 & 2032
- Figure 50: Middle East & Africa Artificial Meat Products Volume Share (%), by Country 2024 & 2032
- Figure 51: Asia Pacific Artificial Meat Products Revenue (million), by Application 2024 & 2032
- Figure 52: Asia Pacific Artificial Meat Products Volume (K), by Application 2024 & 2032
- Figure 53: Asia Pacific Artificial Meat Products Revenue Share (%), by Application 2024 & 2032
- Figure 54: Asia Pacific Artificial Meat Products Volume Share (%), by Application 2024 & 2032
- Figure 55: Asia Pacific Artificial Meat Products Revenue (million), by Types 2024 & 2032
- Figure 56: Asia Pacific Artificial Meat Products Volume (K), by Types 2024 & 2032
- Figure 57: Asia Pacific Artificial Meat Products Revenue Share (%), by Types 2024 & 2032
- Figure 58: Asia Pacific Artificial Meat Products Volume Share (%), by Types 2024 & 2032
- Figure 59: Asia Pacific Artificial Meat Products Revenue (million), by Country 2024 & 2032
- Figure 60: Asia Pacific Artificial Meat Products Volume (K), by Country 2024 & 2032
- Figure 61: Asia Pacific Artificial Meat Products Revenue Share (%), by Country 2024 & 2032
- Figure 62: Asia Pacific Artificial Meat Products Volume Share (%), by Country 2024 & 2032
List of Tables
- Table 1: Global Artificial Meat Products Revenue million Forecast, by Region 2019 & 2032
- Table 2: Global Artificial Meat Products Volume K Forecast, by Region 2019 & 2032
- Table 3: Global Artificial Meat Products Revenue million Forecast, by Application 2019 & 2032
- Table 4: Global Artificial Meat Products Volume K Forecast, by Application 2019 & 2032
- Table 5: Global Artificial Meat Products Revenue million Forecast, by Types 2019 & 2032
- Table 6: Global Artificial Meat Products Volume K Forecast, by Types 2019 & 2032
- Table 7: Global Artificial Meat Products Revenue million Forecast, by Region 2019 & 2032
- Table 8: Global Artificial Meat Products Volume K Forecast, by Region 2019 & 2032
- Table 9: Global Artificial Meat Products Revenue million Forecast, by Application 2019 & 2032
- Table 10: Global Artificial Meat Products Volume K Forecast, by Application 2019 & 2032
- Table 11: Global Artificial Meat Products Revenue million Forecast, by Types 2019 & 2032
- Table 12: Global Artificial Meat Products Volume K Forecast, by Types 2019 & 2032
- Table 13: Global Artificial Meat Products Revenue million Forecast, by Country 2019 & 2032
- Table 14: Global Artificial Meat Products Volume K Forecast, by Country 2019 & 2032
- Table 15: United States Artificial Meat Products Revenue (million) Forecast, by Application 2019 & 2032
- Table 16: United States Artificial Meat Products Volume (K) Forecast, by Application 2019 & 2032
- Table 17: Canada Artificial Meat Products Revenue (million) Forecast, by Application 2019 & 2032
- Table 18: Canada Artificial Meat Products Volume (K) Forecast, by Application 2019 & 2032
- Table 19: Mexico Artificial Meat Products Revenue (million) Forecast, by Application 2019 & 2032
- Table 20: Mexico Artificial Meat Products Volume (K) Forecast, by Application 2019 & 2032
- Table 21: Global Artificial Meat Products Revenue million Forecast, by Application 2019 & 2032
- Table 22: Global Artificial Meat Products Volume K Forecast, by Application 2019 & 2032
- Table 23: Global Artificial Meat Products Revenue million Forecast, by Types 2019 & 2032
- Table 24: Global Artificial Meat Products Volume K Forecast, by Types 2019 & 2032
- Table 25: Global Artificial Meat Products Revenue million Forecast, by Country 2019 & 2032
- Table 26: Global Artificial Meat Products Volume K Forecast, by Country 2019 & 2032
- Table 27: Brazil Artificial Meat Products Revenue (million) Forecast, by Application 2019 & 2032
- Table 28: Brazil Artificial Meat Products Volume (K) Forecast, by Application 2019 & 2032
- Table 29: Argentina Artificial Meat Products Revenue (million) Forecast, by Application 2019 & 2032
- Table 30: Argentina Artificial Meat Products Volume (K) Forecast, by Application 2019 & 2032
- Table 31: Rest of South America Artificial Meat Products Revenue (million) Forecast, by Application 2019 & 2032
- Table 32: Rest of South America Artificial Meat Products Volume (K) Forecast, by Application 2019 & 2032
- Table 33: Global Artificial Meat Products Revenue million Forecast, by Application 2019 & 2032
- Table 34: Global Artificial Meat Products Volume K Forecast, by Application 2019 & 2032
- Table 35: Global Artificial Meat Products Revenue million Forecast, by Types 2019 & 2032
- Table 36: Global Artificial Meat Products Volume K Forecast, by Types 2019 & 2032
- Table 37: Global Artificial Meat Products Revenue million Forecast, by Country 2019 & 2032
- Table 38: Global Artificial Meat Products Volume K Forecast, by Country 2019 & 2032
- Table 39: United Kingdom Artificial Meat Products Revenue (million) Forecast, by Application 2019 & 2032
- Table 40: United Kingdom Artificial Meat Products Volume (K) Forecast, by Application 2019 & 2032
- Table 41: Germany Artificial Meat Products Revenue (million) Forecast, by Application 2019 & 2032
- Table 42: Germany Artificial Meat Products Volume (K) Forecast, by Application 2019 & 2032
- Table 43: France Artificial Meat Products Revenue (million) Forecast, by Application 2019 & 2032
- Table 44: France Artificial Meat Products Volume (K) Forecast, by Application 2019 & 2032
- Table 45: Italy Artificial Meat Products Revenue (million) Forecast, by Application 2019 & 2032
- Table 46: Italy Artificial Meat Products Volume (K) Forecast, by Application 2019 & 2032
- Table 47: Spain Artificial Meat Products Revenue (million) Forecast, by Application 2019 & 2032
- Table 48: Spain Artificial Meat Products Volume (K) Forecast, by Application 2019 & 2032
- Table 49: Russia Artificial Meat Products Revenue (million) Forecast, by Application 2019 & 2032
- Table 50: Russia Artificial Meat Products Volume (K) Forecast, by Application 2019 & 2032
- Table 51: Benelux Artificial Meat Products Revenue (million) Forecast, by Application 2019 & 2032
- Table 52: Benelux Artificial Meat Products Volume (K) Forecast, by Application 2019 & 2032
- Table 53: Nordics Artificial Meat Products Revenue (million) Forecast, by Application 2019 & 2032
- Table 54: Nordics Artificial Meat Products Volume (K) Forecast, by Application 2019 & 2032
- Table 55: Rest of Europe Artificial Meat Products Revenue (million) Forecast, by Application 2019 & 2032
- Table 56: Rest of Europe Artificial Meat Products Volume (K) Forecast, by Application 2019 & 2032
- Table 57: Global Artificial Meat Products Revenue million Forecast, by Application 2019 & 2032
- Table 58: Global Artificial Meat Products Volume K Forecast, by Application 2019 & 2032
- Table 59: Global Artificial Meat Products Revenue million Forecast, by Types 2019 & 2032
- Table 60: Global Artificial Meat Products Volume K Forecast, by Types 2019 & 2032
- Table 61: Global Artificial Meat Products Revenue million Forecast, by Country 2019 & 2032
- Table 62: Global Artificial Meat Products Volume K Forecast, by Country 2019 & 2032
- Table 63: Turkey Artificial Meat Products Revenue (million) Forecast, by Application 2019 & 2032
- Table 64: Turkey Artificial Meat Products Volume (K) Forecast, by Application 2019 & 2032
- Table 65: Israel Artificial Meat Products Revenue (million) Forecast, by Application 2019 & 2032
- Table 66: Israel Artificial Meat Products Volume (K) Forecast, by Application 2019 & 2032
- Table 67: GCC Artificial Meat Products Revenue (million) Forecast, by Application 2019 & 2032
- Table 68: GCC Artificial Meat Products Volume (K) Forecast, by Application 2019 & 2032
- Table 69: North Africa Artificial Meat Products Revenue (million) Forecast, by Application 2019 & 2032
- Table 70: North Africa Artificial Meat Products Volume (K) Forecast, by Application 2019 & 2032
- Table 71: South Africa Artificial Meat Products Revenue (million) Forecast, by Application 2019 & 2032
- Table 72: South Africa Artificial Meat Products Volume (K) Forecast, by Application 2019 & 2032
- Table 73: Rest of Middle East & Africa Artificial Meat Products Revenue (million) Forecast, by Application 2019 & 2032
- Table 74: Rest of Middle East & Africa Artificial Meat Products Volume (K) Forecast, by Application 2019 & 2032
- Table 75: Global Artificial Meat Products Revenue million Forecast, by Application 2019 & 2032
- Table 76: Global Artificial Meat Products Volume K Forecast, by Application 2019 & 2032
- Table 77: Global Artificial Meat Products Revenue million Forecast, by Types 2019 & 2032
- Table 78: Global Artificial Meat Products Volume K Forecast, by Types 2019 & 2032
- Table 79: Global Artificial Meat Products Revenue million Forecast, by Country 2019 & 2032
- Table 80: Global Artificial Meat Products Volume K Forecast, by Country 2019 & 2032
- Table 81: China Artificial Meat Products Revenue (million) Forecast, by Application 2019 & 2032
- Table 82: China Artificial Meat Products Volume (K) Forecast, by Application 2019 & 2032
- Table 83: India Artificial Meat Products Revenue (million) Forecast, by Application 2019 & 2032
- Table 84: India Artificial Meat Products Volume (K) Forecast, by Application 2019 & 2032
- Table 85: Japan Artificial Meat Products Revenue (million) Forecast, by Application 2019 & 2032
- Table 86: Japan Artificial Meat Products Volume (K) Forecast, by Application 2019 & 2032
- Table 87: South Korea Artificial Meat Products Revenue (million) Forecast, by Application 2019 & 2032
- Table 88: South Korea Artificial Meat Products Volume (K) Forecast, by Application 2019 & 2032
- Table 89: ASEAN Artificial Meat Products Revenue (million) Forecast, by Application 2019 & 2032
- Table 90: ASEAN Artificial Meat Products Volume (K) Forecast, by Application 2019 & 2032
- Table 91: Oceania Artificial Meat Products Revenue (million) Forecast, by Application 2019 & 2032
- Table 92: Oceania Artificial Meat Products Volume (K) Forecast, by Application 2019 & 2032
- Table 93: Rest of Asia Pacific Artificial Meat Products Revenue (million) Forecast, by Application 2019 & 2032
- Table 94: Rest of Asia Pacific Artificial Meat Products Volume (K) Forecast, by Application 2019 & 2032
Frequently Asked Questions
1. What is the projected Compound Annual Growth Rate (CAGR) of the Artificial Meat Products?
The projected CAGR is approximately XX%.
2. Which companies are prominent players in the Artificial Meat Products?
Key companies in the market include Beyond Meat, Impossible Foods, Turtle Island Foods, Maple Leaf, Yves Veggie Cuisine, Nestle, Kellogg’s (Morningstar Farms), Omnifood, Qishan Foods, Hongchang Food, Sulian Food, Fuzhou Sutianxia.
3. What are the main segments of the Artificial Meat Products?
The market segments include Application, Types.
4. Can you provide details about the market size?
The market size is estimated to be USD XXX million as of 2022.
5. What are some drivers contributing to market growth?
N/A
6. What are the notable trends driving market growth?
N/A
7. Are there any restraints impacting market growth?
N/A
8. Can you provide examples of recent developments in the market?
N/A
9. What pricing options are available for accessing the report?
Pricing options include single-user, multi-user, and enterprise licenses priced at USD 3350.00, USD 5025.00, and USD 6700.00 respectively.
10. Is the market size provided in terms of value or volume?
The market size is provided in terms of value, measured in million and volume, measured in K.
11. Are there any specific market keywords associated with the report?
Yes, the market keyword associated with the report is "Artificial Meat Products," which aids in identifying and referencing the specific market segment covered.
12. How do I determine which pricing option suits my needs best?
The pricing options vary based on user requirements and access needs. Individual users may opt for single-user licenses, while businesses requiring broader access may choose multi-user or enterprise licenses for cost-effective access to the report.
13. Are there any additional resources or data provided in the Artificial Meat Products report?
While the report offers comprehensive insights, it's advisable to review the specific contents or supplementary materials provided to ascertain if additional resources or data are available.
14. How can I stay updated on further developments or reports in the Artificial Meat Products?
To stay informed about further developments, trends, and reports in the Artificial Meat Products, consider subscribing to industry newsletters, following relevant companies and organizations, or regularly checking reputable industry news sources and publications.
Methodology
Step 1 - Identification of Relevant Samples Size from Population Database


Step 2 - Approaches for Defining Global Market Size (Value, Volume* & Price*)

Note*: In applicable scenarios
Step 3 - Data Sources
Primary Research
- Web Analytics
- Survey Reports
- Research Institute
- Latest Research Reports
- Opinion Leaders
Secondary Research
- Annual Reports
- White Paper
- Latest Press Release
- Industry Association
- Paid Database
- Investor Presentations

Step 4 - Data Triangulation
Involves using different sources of information in order to increase the validity of a study
These sources are likely to be stakeholders in a program - participants, other researchers, program staff, other community members, and so on.
Then we put all data in single framework & apply various statistical tools to find out the dynamic on the market.
During the analysis stage, feedback from the stakeholder groups would be compared to determine areas of agreement as well as areas of divergence
