

Key Insights
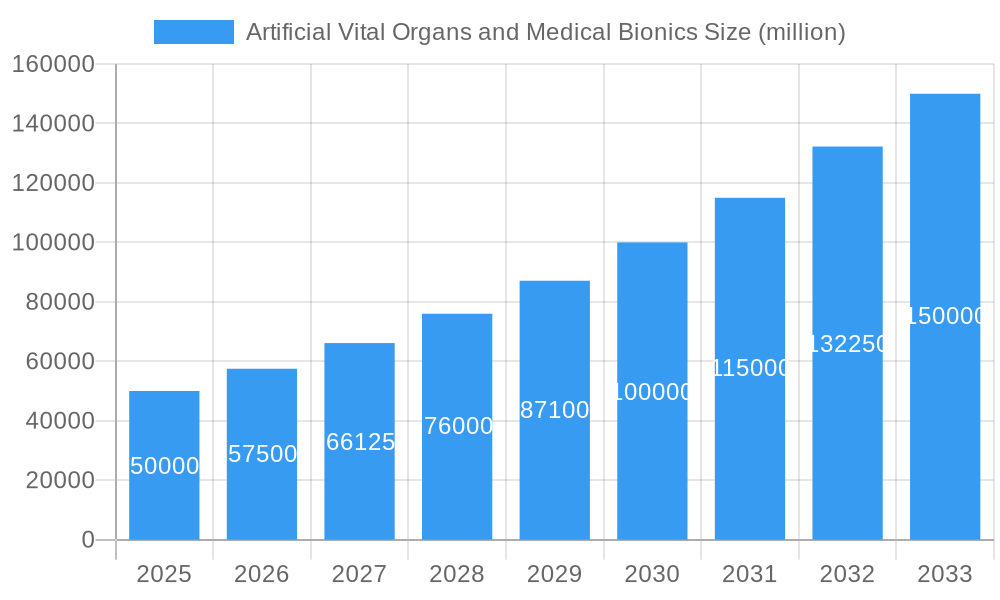
The global market for artificial vital organs and medical bionics is experiencing robust growth, driven by the increasing prevalence of chronic diseases, advancements in medical technology, and rising geriatric populations. The market, estimated at $50 billion in 2025, is projected to achieve a Compound Annual Growth Rate (CAGR) of 15% from 2025 to 2033, reaching approximately $150 billion by 2033. This expansion is fueled by several key factors. Technological advancements, including the development of biocompatible materials, miniaturized devices, and improved surgical techniques, are leading to more effective and less invasive treatments. Furthermore, the growing demand for improved quality of life and extended lifespans is driving increased adoption of these life-enhancing technologies. Significant investments in research and development by both established players and emerging biotech companies are further accelerating market growth. Key segments within the market include cardiac devices (pacemakers, artificial hearts), neuroprosthetics (cochlear implants, deep brain stimulators), and orthopedic implants (joint replacements, prosthetics), each contributing significantly to the overall market value. Competitive landscape is characterized by a mix of large multinational corporations and specialized smaller companies focused on niche applications.
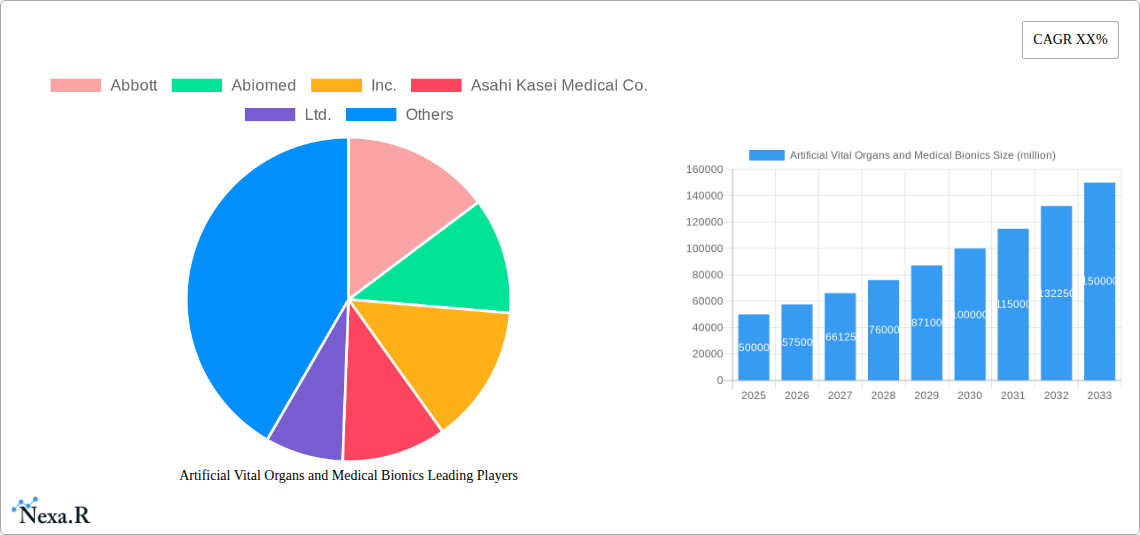
Artificial Vital Organs and Medical Bionics Market Size (In Billion)
Despite the positive outlook, certain challenges hinder market expansion. High costs associated with these advanced medical technologies can limit accessibility, particularly in low- and middle-income countries. Regulatory hurdles and stringent approval processes also pose a significant barrier to entry for new players. Furthermore, potential risks associated with device malfunction, rejection by the body, and long-term complications remain concerns that need to be addressed through improved technology and robust safety protocols. However, ongoing innovation and collaborative efforts between research institutions, healthcare providers, and regulatory bodies are likely to mitigate these challenges and pave the way for sustained market growth in the coming years. Companies like Medtronic, Abbott, and Baxter International are actively engaged in expanding their product portfolios and forging strategic partnerships to gain a competitive edge.
Artificial Vital Organs and Medical Bionics Company Market Share
Artificial Vital Organs and Medical Bionics Market Report: 2019-2033
This comprehensive report provides a detailed analysis of the Artificial Vital Organs and Medical Bionics market, offering invaluable insights for industry professionals, investors, and strategic decision-makers. Covering the period 2019-2033, with a base year of 2025 and a forecast period of 2025-2033, this report illuminates market dynamics, growth trends, and key players shaping this rapidly evolving sector. The parent market is the medical device industry (valued at $XX Billion in 2025), and the child market is specifically artificial organs and medical bionics.
Artificial Vital Organs and Medical Bionics Market Dynamics & Structure
The Artificial Vital Organs and Medical Bionics market is characterized by moderate concentration, with key players like Medtronic, Abbott, and Baxter holding significant market share (estimated at xx% combined in 2025). Technological innovation, particularly in areas like bioprinting and AI-driven control systems, is a major driver. Stringent regulatory frameworks (FDA, CE marking) influence product development and market entry. Competitive substitutes, including traditional therapies, pose a challenge. The end-user demographic is primarily patients with organ failure or debilitating injuries, with increasing demand driven by aging populations and rising prevalence of chronic diseases. M&A activity has been relatively moderate (xx deals in the last 5 years), with larger companies acquiring smaller innovative firms to expand their product portfolios.
- Market Concentration: Moderately concentrated, with top 3 players holding xx% market share in 2025.
- Technological Innovation: Significant advancements in biomaterials, miniaturization, and AI integration.
- Regulatory Landscape: Stringent regulatory approvals (FDA, CE marking) impact market entry and timelines.
- Competitive Substitutes: Traditional therapies (e.g., dialysis) act as competitive substitutes, limiting market penetration.
- End-User Demographics: Aging population and increased prevalence of chronic diseases drive market growth.
- M&A Activity: Moderate M&A activity (xx deals in the last 5 years), focusing on technology acquisition.
Artificial Vital Organs and Medical Bionics Growth Trends & Insights
The global Artificial Vital Organs and Medical Bionics market is experiencing robust growth, driven by technological advancements and increasing demand. The market size was valued at $XX billion in 2024 and is projected to reach $XX billion by 2033, exhibiting a CAGR of xx% during the forecast period. Adoption rates are steadily increasing, particularly in developed nations with advanced healthcare infrastructure. Disruptive technologies, such as bioprinting and personalized medicine, are transforming the landscape, enabling the creation of more effective and customized solutions. Consumer behavior is shifting towards preference for minimally invasive procedures and improved quality of life.
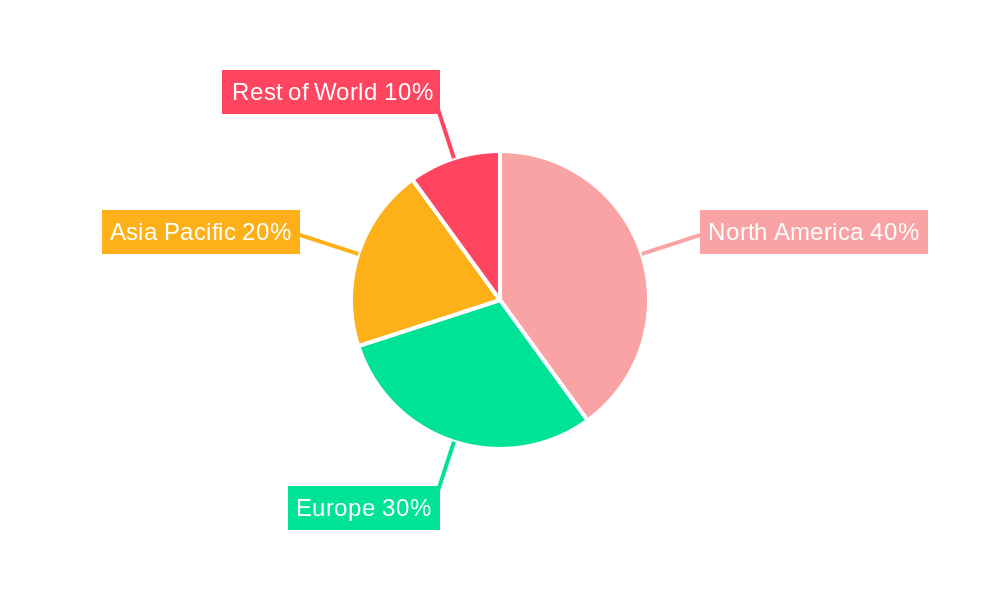
Dominant Regions, Countries, or Segments in Artificial Vital Organs and Medical Bionics
North America currently dominates the Artificial Vital Organs and Medical Bionics market, holding the largest market share (xx%) in 2025. This dominance is driven by factors including high healthcare expenditure, advanced medical infrastructure, and early adoption of new technologies. Europe follows as the second largest market, with significant growth potential in Asia Pacific due to rising disposable incomes and increasing healthcare investment. The cardiac devices segment currently represents the largest share of the market (xx%), followed by neuroprosthetics and other artificial organs.
- North America: High healthcare expenditure, robust infrastructure, and early adoption of new technologies.
- Europe: Strong regulatory framework, established healthcare systems, and increasing focus on improving patient outcomes.
- Asia Pacific: Rising disposable incomes, growing healthcare infrastructure investments, and expanding patient population.
- Cardiac Devices: High prevalence of cardiovascular diseases drives strong demand.
- Neuroprosthetics: Increasing awareness and technological advancements are boosting growth.
Artificial Vital Organs and Medical Bionics Product Landscape
The Artificial Vital Organs and Medical Bionics market offers a diverse range of products, including artificial hearts, kidneys, livers, and neuroprosthetics. Innovation focuses on improving biocompatibility, miniaturization, and integrating advanced features such as AI-driven control systems and remote monitoring capabilities. Unique selling propositions often revolve around improved patient outcomes, enhanced functionality, and reduced invasiveness. Recent advancements include improved biomaterials that minimize rejection rates and longer-lasting, more durable devices.
Key Drivers, Barriers & Challenges in Artificial Vital Organs and Medical Bionics
Key Drivers: Technological advancements (bioprinting, AI), rising prevalence of chronic diseases, increasing healthcare expenditure, and supportive government regulations.
Key Challenges: High costs of development and production, stringent regulatory approvals, complex ethical considerations (e.g., allocation of resources), and potential long-term health complications. Supply chain disruptions can impact production and availability, leading to estimated losses of $XX million annually.
Emerging Opportunities in Artificial Vital Organs and Medical Bionics
Emerging opportunities exist in personalized medicine, development of biocompatible materials, integration of AI for real-time monitoring and feedback, and expansion into developing markets with a rising prevalence of chronic illnesses. Furthermore, development of novel applications, such as advanced prosthetics and bio-integrated sensors for monitoring vital signs, presents substantial opportunities for market expansion.
Growth Accelerators in the Artificial Vital Organs and Medical Bionics Industry
Technological breakthroughs, such as the development of advanced biomaterials and miniaturized devices, will be significant growth accelerators. Strategic partnerships between research institutions, medical device companies, and healthcare providers will foster innovation and accelerate product development. Expansion into emerging markets and improving access to affordable care will further stimulate market growth.
Key Players Shaping the Artificial Vital Organs and Medical Bionics Market
- Abbott
- Abiomed, Inc.
- Asahi Kasei Medical Co., Ltd.
- Baxter
- Cyberonics, Inc.
- Edwards
- Ekso Bionics
- Roche
- Fresenius
- Baxter International
- Iwalk
- Jarvik Heart
- Medtronic
- Micromed Cardiovascular
- Nikkiso
- Ossur Hf
- Ottobock
- Second Sight Medical Products, Inc.
- Syncardia Systems, Inc.
- Thoratec Corporation
- Touch Bionics, Inc.
- Vital Therapies, Inc.
- WorldHeart Corporation
Notable Milestones in Artificial Vital Organs and Medical Bionics Sector
- 2020: FDA approval of a novel bioartificial liver device.
- 2022: Launch of a next-generation implantable artificial heart with improved longevity.
- 2023: Successful clinical trial of a new bionic hand with advanced sensory feedback.
- 2024: Acquisition of a leading bioprinting company by a major medical device manufacturer.
In-Depth Artificial Vital Organs and Medical Bionics Market Outlook
The future of the Artificial Vital Organs and Medical Bionics market is bright, driven by continuous technological advancements, rising healthcare expenditure, and increased demand for improved patient outcomes. Strategic partnerships and investments in research and development will be critical in driving innovation and expanding market access. The market is poised for significant growth, presenting attractive opportunities for companies that can successfully navigate the regulatory landscape and develop innovative solutions to meet the evolving needs of patients.
Artificial Vital Organs and Medical Bionics Segmentation
-
1. Application
- 1.1. Hospitals
- 1.2. Clinics
- 1.3. Others
-
2. Types
- 2.1. Artificial Vital Organs
- 2.2. Bionics
Artificial Vital Organs and Medical Bionics Segmentation By Geography
-
1. North America
- 1.1. United States
- 1.2. Canada
- 1.3. Mexico
-
2. South America
- 2.1. Brazil
- 2.2. Argentina
- 2.3. Rest of South America
-
3. Europe
- 3.1. United Kingdom
- 3.2. Germany
- 3.3. France
- 3.4. Italy
- 3.5. Spain
- 3.6. Russia
- 3.7. Benelux
- 3.8. Nordics
- 3.9. Rest of Europe
-
4. Middle East & Africa
- 4.1. Turkey
- 4.2. Israel
- 4.3. GCC
- 4.4. North Africa
- 4.5. South Africa
- 4.6. Rest of Middle East & Africa
-
5. Asia Pacific
- 5.1. China
- 5.2. India
- 5.3. Japan
- 5.4. South Korea
- 5.5. ASEAN
- 5.6. Oceania
- 5.7. Rest of Asia Pacific
Artificial Vital Organs and Medical Bionics Regional Market Share
Geographic Coverage of Artificial Vital Organs and Medical Bionics
Artificial Vital Organs and Medical Bionics REPORT HIGHLIGHTS
| Aspects | Details |
|---|---|
| Study Period | 2020-2034 |
| Base Year | 2025 |
| Estimated Year | 2026 |
| Forecast Period | 2026-2034 |
| Historical Period | 2020-2025 |
| Growth Rate | CAGR of 8.8% from 2020-2034 |
| Segmentation |
|
Table of Contents
- 1. Introduction
- 1.1. Research Scope
- 1.2. Market Segmentation
- 1.3. Research Objective
- 1.4. Definitions and Assumptions
- 2. Executive Summary
- 2.1. Market Snapshot
- 3. Market Dynamics
- 3.1. Market Drivers
- 3.2. Market Restrains
- 3.3. Market Trends
- 3.4. Market Opportunities
- 4. Market Factor Analysis
- 4.1. Porters Five Forces
- 4.1.1. Bargaining Power of Suppliers
- 4.1.2. Bargaining Power of Buyers
- 4.1.3. Threat of New Entrants
- 4.1.4. Threat of Substitutes
- 4.1.5. Competitive Rivalry
- 4.2. PESTEL analysis
- 4.3. BCG Analysis
- 4.3.1. Stars (High Growth, High Market Share)
- 4.3.2. Cash Cows (Low Growth, High Market Share)
- 4.3.3. Question Mark (High Growth, Low Market Share)
- 4.3.4. Dogs (Low Growth, Low Market Share)
- 4.4. Ansoff Matrix Analysis
- 4.5. Supply Chain Analysis
- 4.6. Regulatory Landscape
- 4.7. Current Market Potential and Opportunity Assessment (TAM–SAM–SOM Framework)
- 4.8. NRP Analyst Note
- 4.1. Porters Five Forces
- 5. Market Analysis, Insights and Forecast 2021-2033
- 5.1. Market Analysis, Insights and Forecast - by Application
- 5.1.1. Hospitals
- 5.1.2. Clinics
- 5.1.3. Others
- 5.2. Market Analysis, Insights and Forecast - by Types
- 5.2.1. Artificial Vital Organs
- 5.2.2. Bionics
- 5.3. Market Analysis, Insights and Forecast - by Region
- 5.3.1. North America
- 5.3.2. South America
- 5.3.3. Europe
- 5.3.4. Middle East & Africa
- 5.3.5. Asia Pacific
- 5.1. Market Analysis, Insights and Forecast - by Application
- 6. Global Artificial Vital Organs and Medical Bionics Analysis, Insights and Forecast, 2021-2033
- 6.1. Market Analysis, Insights and Forecast - by Application
- 6.1.1. Hospitals
- 6.1.2. Clinics
- 6.1.3. Others
- 6.2. Market Analysis, Insights and Forecast - by Types
- 6.2.1. Artificial Vital Organs
- 6.2.2. Bionics
- 6.1. Market Analysis, Insights and Forecast - by Application
- 7. North America Artificial Vital Organs and Medical Bionics Analysis, Insights and Forecast, 2020-2032
- 7.1. Market Analysis, Insights and Forecast - by Application
- 7.1.1. Hospitals
- 7.1.2. Clinics
- 7.1.3. Others
- 7.2. Market Analysis, Insights and Forecast - by Types
- 7.2.1. Artificial Vital Organs
- 7.2.2. Bionics
- 7.1. Market Analysis, Insights and Forecast - by Application
- 8. South America Artificial Vital Organs and Medical Bionics Analysis, Insights and Forecast, 2020-2032
- 8.1. Market Analysis, Insights and Forecast - by Application
- 8.1.1. Hospitals
- 8.1.2. Clinics
- 8.1.3. Others
- 8.2. Market Analysis, Insights and Forecast - by Types
- 8.2.1. Artificial Vital Organs
- 8.2.2. Bionics
- 8.1. Market Analysis, Insights and Forecast - by Application
- 9. Europe Artificial Vital Organs and Medical Bionics Analysis, Insights and Forecast, 2020-2032
- 9.1. Market Analysis, Insights and Forecast - by Application
- 9.1.1. Hospitals
- 9.1.2. Clinics
- 9.1.3. Others
- 9.2. Market Analysis, Insights and Forecast - by Types
- 9.2.1. Artificial Vital Organs
- 9.2.2. Bionics
- 9.1. Market Analysis, Insights and Forecast - by Application
- 10. Middle East & Africa Artificial Vital Organs and Medical Bionics Analysis, Insights and Forecast, 2020-2032
- 10.1. Market Analysis, Insights and Forecast - by Application
- 10.1.1. Hospitals
- 10.1.2. Clinics
- 10.1.3. Others
- 10.2. Market Analysis, Insights and Forecast - by Types
- 10.2.1. Artificial Vital Organs
- 10.2.2. Bionics
- 10.1. Market Analysis, Insights and Forecast - by Application
- 11. Asia Pacific Artificial Vital Organs and Medical Bionics Analysis, Insights and Forecast, 2020-2032
- 11.1. Market Analysis, Insights and Forecast - by Application
- 11.1.1. Hospitals
- 11.1.2. Clinics
- 11.1.3. Others
- 11.2. Market Analysis, Insights and Forecast - by Types
- 11.2.1. Artificial Vital Organs
- 11.2.2. Bionics
- 11.1. Market Analysis, Insights and Forecast - by Application
- 12. Competitive Analysis
- 12.1. Company Profiles
- 12.1.1 Abbott
- 12.1.1.1. Company Overview
- 12.1.1.2. Products
- 12.1.1.3. Company Financials
- 12.1.1.4. SWOT Analysis
- 12.1.2 Abiomed
- 12.1.2.1. Company Overview
- 12.1.2.2. Products
- 12.1.2.3. Company Financials
- 12.1.2.4. SWOT Analysis
- 12.1.3 Inc.
- 12.1.3.1. Company Overview
- 12.1.3.2. Products
- 12.1.3.3. Company Financials
- 12.1.3.4. SWOT Analysis
- 12.1.4 Asahi Kasei Medical Co.
- 12.1.4.1. Company Overview
- 12.1.4.2. Products
- 12.1.4.3. Company Financials
- 12.1.4.4. SWOT Analysis
- 12.1.5 Ltd.
- 12.1.5.1. Company Overview
- 12.1.5.2. Products
- 12.1.5.3. Company Financials
- 12.1.5.4. SWOT Analysis
- 12.1.6 Baxter
- 12.1.6.1. Company Overview
- 12.1.6.2. Products
- 12.1.6.3. Company Financials
- 12.1.6.4. SWOT Analysis
- 12.1.7 Cyberonics
- 12.1.7.1. Company Overview
- 12.1.7.2. Products
- 12.1.7.3. Company Financials
- 12.1.7.4. SWOT Analysis
- 12.1.8 Inc.
- 12.1.8.1. Company Overview
- 12.1.8.2. Products
- 12.1.8.3. Company Financials
- 12.1.8.4. SWOT Analysis
- 12.1.9 Edwards
- 12.1.9.1. Company Overview
- 12.1.9.2. Products
- 12.1.9.3. Company Financials
- 12.1.9.4. SWOT Analysis
- 12.1.10 Ekso Bionics
- 12.1.10.1. Company Overview
- 12.1.10.2. Products
- 12.1.10.3. Company Financials
- 12.1.10.4. SWOT Analysis
- 12.1.11 Roche
- 12.1.11.1. Company Overview
- 12.1.11.2. Products
- 12.1.11.3. Company Financials
- 12.1.11.4. SWOT Analysis
- 12.1.12 Fresenius
- 12.1.12.1. Company Overview
- 12.1.12.2. Products
- 12.1.12.3. Company Financials
- 12.1.12.4. SWOT Analysis
- 12.1.13 Baxter International
- 12.1.13.1. Company Overview
- 12.1.13.2. Products
- 12.1.13.3. Company Financials
- 12.1.13.4. SWOT Analysis
- 12.1.14 Iwalk
- 12.1.14.1. Company Overview
- 12.1.14.2. Products
- 12.1.14.3. Company Financials
- 12.1.14.4. SWOT Analysis
- 12.1.15 Jarvik Heart
- 12.1.15.1. Company Overview
- 12.1.15.2. Products
- 12.1.15.3. Company Financials
- 12.1.15.4. SWOT Analysis
- 12.1.16 Medtronic
- 12.1.16.1. Company Overview
- 12.1.16.2. Products
- 12.1.16.3. Company Financials
- 12.1.16.4. SWOT Analysis
- 12.1.17 Micromed Cardiovascular
- 12.1.17.1. Company Overview
- 12.1.17.2. Products
- 12.1.17.3. Company Financials
- 12.1.17.4. SWOT Analysis
- 12.1.18 Nikkiso
- 12.1.18.1. Company Overview
- 12.1.18.2. Products
- 12.1.18.3. Company Financials
- 12.1.18.4. SWOT Analysis
- 12.1.19 Ossur Hf
- 12.1.19.1. Company Overview
- 12.1.19.2. Products
- 12.1.19.3. Company Financials
- 12.1.19.4. SWOT Analysis
- 12.1.20 Ottobock
- 12.1.20.1. Company Overview
- 12.1.20.2. Products
- 12.1.20.3. Company Financials
- 12.1.20.4. SWOT Analysis
- 12.1.21 Second Sight Medical Products
- 12.1.21.1. Company Overview
- 12.1.21.2. Products
- 12.1.21.3. Company Financials
- 12.1.21.4. SWOT Analysis
- 12.1.22 Inc.
- 12.1.22.1. Company Overview
- 12.1.22.2. Products
- 12.1.22.3. Company Financials
- 12.1.22.4. SWOT Analysis
- 12.1.23 Syncardia Systems
- 12.1.23.1. Company Overview
- 12.1.23.2. Products
- 12.1.23.3. Company Financials
- 12.1.23.4. SWOT Analysis
- 12.1.24 Inc.
- 12.1.24.1. Company Overview
- 12.1.24.2. Products
- 12.1.24.3. Company Financials
- 12.1.24.4. SWOT Analysis
- 12.1.25 Thoratec Corporation
- 12.1.25.1. Company Overview
- 12.1.25.2. Products
- 12.1.25.3. Company Financials
- 12.1.25.4. SWOT Analysis
- 12.1.26 Touch Bionics
- 12.1.26.1. Company Overview
- 12.1.26.2. Products
- 12.1.26.3. Company Financials
- 12.1.26.4. SWOT Analysis
- 12.1.27 Inc.
- 12.1.27.1. Company Overview
- 12.1.27.2. Products
- 12.1.27.3. Company Financials
- 12.1.27.4. SWOT Analysis
- 12.1.28 Vital Therapies
- 12.1.28.1. Company Overview
- 12.1.28.2. Products
- 12.1.28.3. Company Financials
- 12.1.28.4. SWOT Analysis
- 12.1.29 Inc.
- 12.1.29.1. Company Overview
- 12.1.29.2. Products
- 12.1.29.3. Company Financials
- 12.1.29.4. SWOT Analysis
- 12.1.30 WorldHeart Corporation
- 12.1.30.1. Company Overview
- 12.1.30.2. Products
- 12.1.30.3. Company Financials
- 12.1.30.4. SWOT Analysis
- 12.1.1 Abbott
- 12.2. Market Entropy
- 12.2.1 Company's Key Areas Served
- 12.2.2 Recent Developments
- 12.3. Company Market Share Analysis 2025
- 12.3.1 Top 5 Companies Market Share Analysis
- 12.3.2 Top 3 Companies Market Share Analysis
- 12.4. List of Potential Customers
- 13. Research Methodology
List of Figures
- Figure 1: Global Artificial Vital Organs and Medical Bionics Revenue Breakdown (undefined, %) by Region 2025 & 2033
- Figure 2: Global Artificial Vital Organs and Medical Bionics Volume Breakdown (K, %) by Region 2025 & 2033
- Figure 3: North America Artificial Vital Organs and Medical Bionics Revenue (undefined), by Application 2025 & 2033
- Figure 4: North America Artificial Vital Organs and Medical Bionics Volume (K), by Application 2025 & 2033
- Figure 5: North America Artificial Vital Organs and Medical Bionics Revenue Share (%), by Application 2025 & 2033
- Figure 6: North America Artificial Vital Organs and Medical Bionics Volume Share (%), by Application 2025 & 2033
- Figure 7: North America Artificial Vital Organs and Medical Bionics Revenue (undefined), by Types 2025 & 2033
- Figure 8: North America Artificial Vital Organs and Medical Bionics Volume (K), by Types 2025 & 2033
- Figure 9: North America Artificial Vital Organs and Medical Bionics Revenue Share (%), by Types 2025 & 2033
- Figure 10: North America Artificial Vital Organs and Medical Bionics Volume Share (%), by Types 2025 & 2033
- Figure 11: North America Artificial Vital Organs and Medical Bionics Revenue (undefined), by Country 2025 & 2033
- Figure 12: North America Artificial Vital Organs and Medical Bionics Volume (K), by Country 2025 & 2033
- Figure 13: North America Artificial Vital Organs and Medical Bionics Revenue Share (%), by Country 2025 & 2033
- Figure 14: North America Artificial Vital Organs and Medical Bionics Volume Share (%), by Country 2025 & 2033
- Figure 15: South America Artificial Vital Organs and Medical Bionics Revenue (undefined), by Application 2025 & 2033
- Figure 16: South America Artificial Vital Organs and Medical Bionics Volume (K), by Application 2025 & 2033
- Figure 17: South America Artificial Vital Organs and Medical Bionics Revenue Share (%), by Application 2025 & 2033
- Figure 18: South America Artificial Vital Organs and Medical Bionics Volume Share (%), by Application 2025 & 2033
- Figure 19: South America Artificial Vital Organs and Medical Bionics Revenue (undefined), by Types 2025 & 2033
- Figure 20: South America Artificial Vital Organs and Medical Bionics Volume (K), by Types 2025 & 2033
- Figure 21: South America Artificial Vital Organs and Medical Bionics Revenue Share (%), by Types 2025 & 2033
- Figure 22: South America Artificial Vital Organs and Medical Bionics Volume Share (%), by Types 2025 & 2033
- Figure 23: South America Artificial Vital Organs and Medical Bionics Revenue (undefined), by Country 2025 & 2033
- Figure 24: South America Artificial Vital Organs and Medical Bionics Volume (K), by Country 2025 & 2033
- Figure 25: South America Artificial Vital Organs and Medical Bionics Revenue Share (%), by Country 2025 & 2033
- Figure 26: South America Artificial Vital Organs and Medical Bionics Volume Share (%), by Country 2025 & 2033
- Figure 27: Europe Artificial Vital Organs and Medical Bionics Revenue (undefined), by Application 2025 & 2033
- Figure 28: Europe Artificial Vital Organs and Medical Bionics Volume (K), by Application 2025 & 2033
- Figure 29: Europe Artificial Vital Organs and Medical Bionics Revenue Share (%), by Application 2025 & 2033
- Figure 30: Europe Artificial Vital Organs and Medical Bionics Volume Share (%), by Application 2025 & 2033
- Figure 31: Europe Artificial Vital Organs and Medical Bionics Revenue (undefined), by Types 2025 & 2033
- Figure 32: Europe Artificial Vital Organs and Medical Bionics Volume (K), by Types 2025 & 2033
- Figure 33: Europe Artificial Vital Organs and Medical Bionics Revenue Share (%), by Types 2025 & 2033
- Figure 34: Europe Artificial Vital Organs and Medical Bionics Volume Share (%), by Types 2025 & 2033
- Figure 35: Europe Artificial Vital Organs and Medical Bionics Revenue (undefined), by Country 2025 & 2033
- Figure 36: Europe Artificial Vital Organs and Medical Bionics Volume (K), by Country 2025 & 2033
- Figure 37: Europe Artificial Vital Organs and Medical Bionics Revenue Share (%), by Country 2025 & 2033
- Figure 38: Europe Artificial Vital Organs and Medical Bionics Volume Share (%), by Country 2025 & 2033
- Figure 39: Middle East & Africa Artificial Vital Organs and Medical Bionics Revenue (undefined), by Application 2025 & 2033
- Figure 40: Middle East & Africa Artificial Vital Organs and Medical Bionics Volume (K), by Application 2025 & 2033
- Figure 41: Middle East & Africa Artificial Vital Organs and Medical Bionics Revenue Share (%), by Application 2025 & 2033
- Figure 42: Middle East & Africa Artificial Vital Organs and Medical Bionics Volume Share (%), by Application 2025 & 2033
- Figure 43: Middle East & Africa Artificial Vital Organs and Medical Bionics Revenue (undefined), by Types 2025 & 2033
- Figure 44: Middle East & Africa Artificial Vital Organs and Medical Bionics Volume (K), by Types 2025 & 2033
- Figure 45: Middle East & Africa Artificial Vital Organs and Medical Bionics Revenue Share (%), by Types 2025 & 2033
- Figure 46: Middle East & Africa Artificial Vital Organs and Medical Bionics Volume Share (%), by Types 2025 & 2033
- Figure 47: Middle East & Africa Artificial Vital Organs and Medical Bionics Revenue (undefined), by Country 2025 & 2033
- Figure 48: Middle East & Africa Artificial Vital Organs and Medical Bionics Volume (K), by Country 2025 & 2033
- Figure 49: Middle East & Africa Artificial Vital Organs and Medical Bionics Revenue Share (%), by Country 2025 & 2033
- Figure 50: Middle East & Africa Artificial Vital Organs and Medical Bionics Volume Share (%), by Country 2025 & 2033
- Figure 51: Asia Pacific Artificial Vital Organs and Medical Bionics Revenue (undefined), by Application 2025 & 2033
- Figure 52: Asia Pacific Artificial Vital Organs and Medical Bionics Volume (K), by Application 2025 & 2033
- Figure 53: Asia Pacific Artificial Vital Organs and Medical Bionics Revenue Share (%), by Application 2025 & 2033
- Figure 54: Asia Pacific Artificial Vital Organs and Medical Bionics Volume Share (%), by Application 2025 & 2033
- Figure 55: Asia Pacific Artificial Vital Organs and Medical Bionics Revenue (undefined), by Types 2025 & 2033
- Figure 56: Asia Pacific Artificial Vital Organs and Medical Bionics Volume (K), by Types 2025 & 2033
- Figure 57: Asia Pacific Artificial Vital Organs and Medical Bionics Revenue Share (%), by Types 2025 & 2033
- Figure 58: Asia Pacific Artificial Vital Organs and Medical Bionics Volume Share (%), by Types 2025 & 2033
- Figure 59: Asia Pacific Artificial Vital Organs and Medical Bionics Revenue (undefined), by Country 2025 & 2033
- Figure 60: Asia Pacific Artificial Vital Organs and Medical Bionics Volume (K), by Country 2025 & 2033
- Figure 61: Asia Pacific Artificial Vital Organs and Medical Bionics Revenue Share (%), by Country 2025 & 2033
- Figure 62: Asia Pacific Artificial Vital Organs and Medical Bionics Volume Share (%), by Country 2025 & 2033
List of Tables
- Table 1: Global Artificial Vital Organs and Medical Bionics Revenue undefined Forecast, by Application 2020 & 2033
- Table 2: Global Artificial Vital Organs and Medical Bionics Volume K Forecast, by Application 2020 & 2033
- Table 3: Global Artificial Vital Organs and Medical Bionics Revenue undefined Forecast, by Types 2020 & 2033
- Table 4: Global Artificial Vital Organs and Medical Bionics Volume K Forecast, by Types 2020 & 2033
- Table 5: Global Artificial Vital Organs and Medical Bionics Revenue undefined Forecast, by Region 2020 & 2033
- Table 6: Global Artificial Vital Organs and Medical Bionics Volume K Forecast, by Region 2020 & 2033
- Table 7: Global Artificial Vital Organs and Medical Bionics Revenue undefined Forecast, by Application 2020 & 2033
- Table 8: Global Artificial Vital Organs and Medical Bionics Volume K Forecast, by Application 2020 & 2033
- Table 9: Global Artificial Vital Organs and Medical Bionics Revenue undefined Forecast, by Types 2020 & 2033
- Table 10: Global Artificial Vital Organs and Medical Bionics Volume K Forecast, by Types 2020 & 2033
- Table 11: Global Artificial Vital Organs and Medical Bionics Revenue undefined Forecast, by Country 2020 & 2033
- Table 12: Global Artificial Vital Organs and Medical Bionics Volume K Forecast, by Country 2020 & 2033
- Table 13: United States Artificial Vital Organs and Medical Bionics Revenue (undefined) Forecast, by Application 2020 & 2033
- Table 14: United States Artificial Vital Organs and Medical Bionics Volume (K) Forecast, by Application 2020 & 2033
- Table 15: Canada Artificial Vital Organs and Medical Bionics Revenue (undefined) Forecast, by Application 2020 & 2033
- Table 16: Canada Artificial Vital Organs and Medical Bionics Volume (K) Forecast, by Application 2020 & 2033
- Table 17: Mexico Artificial Vital Organs and Medical Bionics Revenue (undefined) Forecast, by Application 2020 & 2033
- Table 18: Mexico Artificial Vital Organs and Medical Bionics Volume (K) Forecast, by Application 2020 & 2033
- Table 19: Global Artificial Vital Organs and Medical Bionics Revenue undefined Forecast, by Application 2020 & 2033
- Table 20: Global Artificial Vital Organs and Medical Bionics Volume K Forecast, by Application 2020 & 2033
- Table 21: Global Artificial Vital Organs and Medical Bionics Revenue undefined Forecast, by Types 2020 & 2033
- Table 22: Global Artificial Vital Organs and Medical Bionics Volume K Forecast, by Types 2020 & 2033
- Table 23: Global Artificial Vital Organs and Medical Bionics Revenue undefined Forecast, by Country 2020 & 2033
- Table 24: Global Artificial Vital Organs and Medical Bionics Volume K Forecast, by Country 2020 & 2033
- Table 25: Brazil Artificial Vital Organs and Medical Bionics Revenue (undefined) Forecast, by Application 2020 & 2033
- Table 26: Brazil Artificial Vital Organs and Medical Bionics Volume (K) Forecast, by Application 2020 & 2033
- Table 27: Argentina Artificial Vital Organs and Medical Bionics Revenue (undefined) Forecast, by Application 2020 & 2033
- Table 28: Argentina Artificial Vital Organs and Medical Bionics Volume (K) Forecast, by Application 2020 & 2033
- Table 29: Rest of South America Artificial Vital Organs and Medical Bionics Revenue (undefined) Forecast, by Application 2020 & 2033
- Table 30: Rest of South America Artificial Vital Organs and Medical Bionics Volume (K) Forecast, by Application 2020 & 2033
- Table 31: Global Artificial Vital Organs and Medical Bionics Revenue undefined Forecast, by Application 2020 & 2033
- Table 32: Global Artificial Vital Organs and Medical Bionics Volume K Forecast, by Application 2020 & 2033
- Table 33: Global Artificial Vital Organs and Medical Bionics Revenue undefined Forecast, by Types 2020 & 2033
- Table 34: Global Artificial Vital Organs and Medical Bionics Volume K Forecast, by Types 2020 & 2033
- Table 35: Global Artificial Vital Organs and Medical Bionics Revenue undefined Forecast, by Country 2020 & 2033
- Table 36: Global Artificial Vital Organs and Medical Bionics Volume K Forecast, by Country 2020 & 2033
- Table 37: United Kingdom Artificial Vital Organs and Medical Bionics Revenue (undefined) Forecast, by Application 2020 & 2033
- Table 38: United Kingdom Artificial Vital Organs and Medical Bionics Volume (K) Forecast, by Application 2020 & 2033
- Table 39: Germany Artificial Vital Organs and Medical Bionics Revenue (undefined) Forecast, by Application 2020 & 2033
- Table 40: Germany Artificial Vital Organs and Medical Bionics Volume (K) Forecast, by Application 2020 & 2033
- Table 41: France Artificial Vital Organs and Medical Bionics Revenue (undefined) Forecast, by Application 2020 & 2033
- Table 42: France Artificial Vital Organs and Medical Bionics Volume (K) Forecast, by Application 2020 & 2033
- Table 43: Italy Artificial Vital Organs and Medical Bionics Revenue (undefined) Forecast, by Application 2020 & 2033
- Table 44: Italy Artificial Vital Organs and Medical Bionics Volume (K) Forecast, by Application 2020 & 2033
- Table 45: Spain Artificial Vital Organs and Medical Bionics Revenue (undefined) Forecast, by Application 2020 & 2033
- Table 46: Spain Artificial Vital Organs and Medical Bionics Volume (K) Forecast, by Application 2020 & 2033
- Table 47: Russia Artificial Vital Organs and Medical Bionics Revenue (undefined) Forecast, by Application 2020 & 2033
- Table 48: Russia Artificial Vital Organs and Medical Bionics Volume (K) Forecast, by Application 2020 & 2033
- Table 49: Benelux Artificial Vital Organs and Medical Bionics Revenue (undefined) Forecast, by Application 2020 & 2033
- Table 50: Benelux Artificial Vital Organs and Medical Bionics Volume (K) Forecast, by Application 2020 & 2033
- Table 51: Nordics Artificial Vital Organs and Medical Bionics Revenue (undefined) Forecast, by Application 2020 & 2033
- Table 52: Nordics Artificial Vital Organs and Medical Bionics Volume (K) Forecast, by Application 2020 & 2033
- Table 53: Rest of Europe Artificial Vital Organs and Medical Bionics Revenue (undefined) Forecast, by Application 2020 & 2033
- Table 54: Rest of Europe Artificial Vital Organs and Medical Bionics Volume (K) Forecast, by Application 2020 & 2033
- Table 55: Global Artificial Vital Organs and Medical Bionics Revenue undefined Forecast, by Application 2020 & 2033
- Table 56: Global Artificial Vital Organs and Medical Bionics Volume K Forecast, by Application 2020 & 2033
- Table 57: Global Artificial Vital Organs and Medical Bionics Revenue undefined Forecast, by Types 2020 & 2033
- Table 58: Global Artificial Vital Organs and Medical Bionics Volume K Forecast, by Types 2020 & 2033
- Table 59: Global Artificial Vital Organs and Medical Bionics Revenue undefined Forecast, by Country 2020 & 2033
- Table 60: Global Artificial Vital Organs and Medical Bionics Volume K Forecast, by Country 2020 & 2033
- Table 61: Turkey Artificial Vital Organs and Medical Bionics Revenue (undefined) Forecast, by Application 2020 & 2033
- Table 62: Turkey Artificial Vital Organs and Medical Bionics Volume (K) Forecast, by Application 2020 & 2033
- Table 63: Israel Artificial Vital Organs and Medical Bionics Revenue (undefined) Forecast, by Application 2020 & 2033
- Table 64: Israel Artificial Vital Organs and Medical Bionics Volume (K) Forecast, by Application 2020 & 2033
- Table 65: GCC Artificial Vital Organs and Medical Bionics Revenue (undefined) Forecast, by Application 2020 & 2033
- Table 66: GCC Artificial Vital Organs and Medical Bionics Volume (K) Forecast, by Application 2020 & 2033
- Table 67: North Africa Artificial Vital Organs and Medical Bionics Revenue (undefined) Forecast, by Application 2020 & 2033
- Table 68: North Africa Artificial Vital Organs and Medical Bionics Volume (K) Forecast, by Application 2020 & 2033
- Table 69: South Africa Artificial Vital Organs and Medical Bionics Revenue (undefined) Forecast, by Application 2020 & 2033
- Table 70: South Africa Artificial Vital Organs and Medical Bionics Volume (K) Forecast, by Application 2020 & 2033
- Table 71: Rest of Middle East & Africa Artificial Vital Organs and Medical Bionics Revenue (undefined) Forecast, by Application 2020 & 2033
- Table 72: Rest of Middle East & Africa Artificial Vital Organs and Medical Bionics Volume (K) Forecast, by Application 2020 & 2033
- Table 73: Global Artificial Vital Organs and Medical Bionics Revenue undefined Forecast, by Application 2020 & 2033
- Table 74: Global Artificial Vital Organs and Medical Bionics Volume K Forecast, by Application 2020 & 2033
- Table 75: Global Artificial Vital Organs and Medical Bionics Revenue undefined Forecast, by Types 2020 & 2033
- Table 76: Global Artificial Vital Organs and Medical Bionics Volume K Forecast, by Types 2020 & 2033
- Table 77: Global Artificial Vital Organs and Medical Bionics Revenue undefined Forecast, by Country 2020 & 2033
- Table 78: Global Artificial Vital Organs and Medical Bionics Volume K Forecast, by Country 2020 & 2033
- Table 79: China Artificial Vital Organs and Medical Bionics Revenue (undefined) Forecast, by Application 2020 & 2033
- Table 80: China Artificial Vital Organs and Medical Bionics Volume (K) Forecast, by Application 2020 & 2033
- Table 81: India Artificial Vital Organs and Medical Bionics Revenue (undefined) Forecast, by Application 2020 & 2033
- Table 82: India Artificial Vital Organs and Medical Bionics Volume (K) Forecast, by Application 2020 & 2033
- Table 83: Japan Artificial Vital Organs and Medical Bionics Revenue (undefined) Forecast, by Application 2020 & 2033
- Table 84: Japan Artificial Vital Organs and Medical Bionics Volume (K) Forecast, by Application 2020 & 2033
- Table 85: South Korea Artificial Vital Organs and Medical Bionics Revenue (undefined) Forecast, by Application 2020 & 2033
- Table 86: South Korea Artificial Vital Organs and Medical Bionics Volume (K) Forecast, by Application 2020 & 2033
- Table 87: ASEAN Artificial Vital Organs and Medical Bionics Revenue (undefined) Forecast, by Application 2020 & 2033
- Table 88: ASEAN Artificial Vital Organs and Medical Bionics Volume (K) Forecast, by Application 2020 & 2033
- Table 89: Oceania Artificial Vital Organs and Medical Bionics Revenue (undefined) Forecast, by Application 2020 & 2033
- Table 90: Oceania Artificial Vital Organs and Medical Bionics Volume (K) Forecast, by Application 2020 & 2033
- Table 91: Rest of Asia Pacific Artificial Vital Organs and Medical Bionics Revenue (undefined) Forecast, by Application 2020 & 2033
- Table 92: Rest of Asia Pacific Artificial Vital Organs and Medical Bionics Volume (K) Forecast, by Application 2020 & 2033
Frequently Asked Questions
1. What is the projected Compound Annual Growth Rate (CAGR) of the Artificial Vital Organs and Medical Bionics?
The projected CAGR is approximately 8.8%.
2. Which companies are prominent players in the Artificial Vital Organs and Medical Bionics?
Key companies in the market include Abbott, Abiomed, Inc., Asahi Kasei Medical Co., Ltd., Baxter, Cyberonics, Inc., Edwards, Ekso Bionics, Roche, Fresenius, Baxter International, Iwalk, Jarvik Heart, Medtronic, Micromed Cardiovascular, Nikkiso, Ossur Hf, Ottobock, Second Sight Medical Products, Inc., Syncardia Systems, Inc., Thoratec Corporation, Touch Bionics, Inc., Vital Therapies, Inc., WorldHeart Corporation.
3. What are the main segments of the Artificial Vital Organs and Medical Bionics?
The market segments include Application, Types.
4. Can you provide details about the market size?
The market size is estimated to be USD XXX N/A as of 2022.
5. What are some drivers contributing to market growth?
N/A
6. What are the notable trends driving market growth?
N/A
7. Are there any restraints impacting market growth?
N/A
8. Can you provide examples of recent developments in the market?
N/A
9. What pricing options are available for accessing the report?
Pricing options include single-user, multi-user, and enterprise licenses priced at USD 3350.00, USD 5025.00, and USD 6700.00 respectively.
10. Is the market size provided in terms of value or volume?
The market size is provided in terms of value, measured in N/A and volume, measured in K.
11. Are there any specific market keywords associated with the report?
Yes, the market keyword associated with the report is "Artificial Vital Organs and Medical Bionics," which aids in identifying and referencing the specific market segment covered.
12. How do I determine which pricing option suits my needs best?
The pricing options vary based on user requirements and access needs. Individual users may opt for single-user licenses, while businesses requiring broader access may choose multi-user or enterprise licenses for cost-effective access to the report.
13. Are there any additional resources or data provided in the Artificial Vital Organs and Medical Bionics report?
While the report offers comprehensive insights, it's advisable to review the specific contents or supplementary materials provided to ascertain if additional resources or data are available.
14. How can I stay updated on further developments or reports in the Artificial Vital Organs and Medical Bionics?
To stay informed about further developments, trends, and reports in the Artificial Vital Organs and Medical Bionics, consider subscribing to industry newsletters, following relevant companies and organizations, or regularly checking reputable industry news sources and publications.
Methodology
Step 1 - Identification of Relevant Samples Size from Population Database


Step 2 - Approaches for Defining Global Market Size (Value, Volume* & Price*)

Note*: In applicable scenarios
Step 3 - Data Sources
Primary Research
- Web Analytics
- Survey Reports
- Research Institute
- Latest Research Reports
- Opinion Leaders
Secondary Research
- Annual Reports
- White Paper
- Latest Press Release
- Industry Association
- Paid Database
- Investor Presentations

Step 4 - Data Triangulation
Involves using different sources of information in order to increase the validity of a study
These sources are likely to be stakeholders in a program - participants, other researchers, program staff, other community members, and so on.
Then we put all data in single framework & apply various statistical tools to find out the dynamic on the market.
During the analysis stage, feedback from the stakeholder groups would be compared to determine areas of agreement as well as areas of divergence