

Key Insights
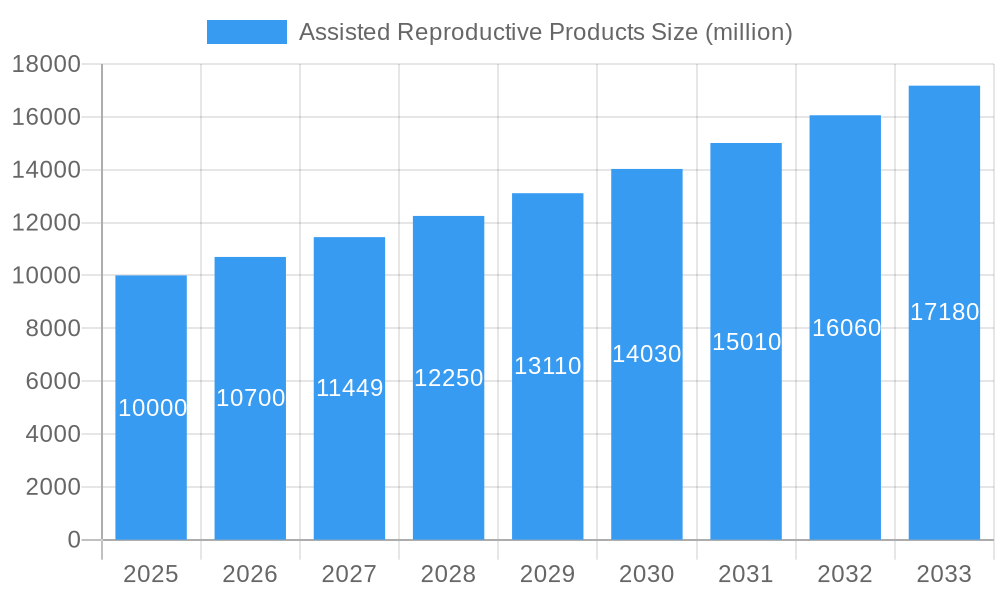
The global assisted reproductive technology (ART) products market is experiencing robust growth, driven by increasing infertility rates worldwide, advancements in ART technologies, and rising awareness about fertility treatments. The market, estimated at $10 billion in 2025, is projected to exhibit a Compound Annual Growth Rate (CAGR) of around 7% from 2025 to 2033, reaching approximately $16 billion by 2033. This expansion is fueled by several key factors. Technological innovations, such as improved in-vitro fertilization (IVF) techniques, preimplantation genetic testing (PGT), and cryopreservation methods, are significantly enhancing treatment success rates and patient outcomes, thereby boosting market demand. Furthermore, the growing accessibility of ART procedures through expanding fertility clinics and improved healthcare infrastructure, particularly in developing economies, is contributing to market growth. The increasing prevalence of lifestyle factors contributing to infertility, such as delayed childbearing and rising rates of sexually transmitted infections, further fuels the market's upward trajectory.
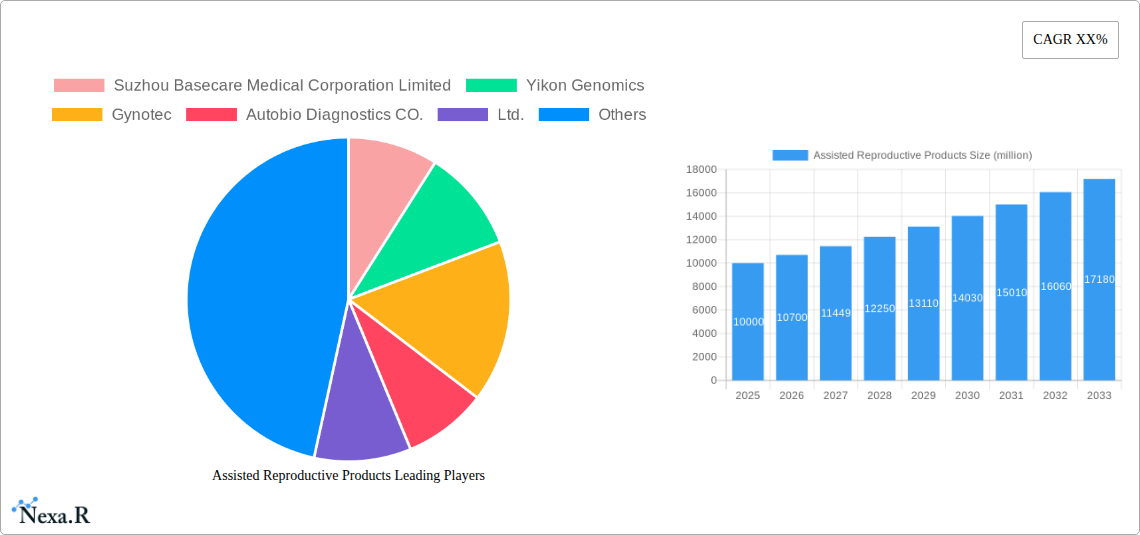
Assisted Reproductive Products Market Size (In Billion)
However, the market faces certain challenges. High treatment costs remain a significant barrier to access for many individuals and couples, particularly in regions with limited healthcare coverage. Ethical considerations surrounding ART technologies, including concerns about multiple births and the potential for genetic manipulation, continue to be debated. Moreover, regulatory hurdles and varying levels of reimbursement policies across different countries create complexities for market players. Despite these challenges, the market is segmented by product type (medications, devices, and services) and geography, with North America and Europe holding significant market shares initially, but with emerging markets in Asia and Latin America demonstrating substantial growth potential. Key players in the market include Suzhou Basecare Medical Corporation Limited, Yikon Genomics, Gynotec, and several other prominent companies actively engaged in research, development, and commercialization of ART products. The competitive landscape is dynamic, characterized by both established players and emerging innovative companies.
Assisted Reproductive Products Company Market Share
Assisted Reproductive Products Market Report: 2019-2033
This comprehensive report provides a detailed analysis of the Assisted Reproductive Products market, encompassing market dynamics, growth trends, regional dominance, product landscape, key players, and future outlook. The study period covers 2019-2033, with 2025 as the base and estimated year. The forecast period spans 2025-2033, and the historical period includes 2019-2024. This report is essential for industry professionals, investors, and anyone seeking a deep understanding of this rapidly evolving market. The global market size was valued at xx million units in 2025 and is projected to reach xx million units by 2033.
Assisted Reproductive Products Market Dynamics & Structure
The Assisted Reproductive Products market is characterized by a moderately concentrated landscape with several key players vying for market share. Technological innovation, particularly in areas like genetic screening and embryo selection, is a major driver of growth. Regulatory frameworks, varying across regions, significantly influence market access and adoption. Competitive substitutes, including alternative fertility treatments, pose challenges, while the growing demographic of individuals seeking assisted reproduction fuels market expansion. Mergers and acquisitions (M&A) activity is moderate, with strategic partnerships aimed at expanding product portfolios and geographical reach.
- Market Concentration: Moderately concentrated, with top 5 players holding approximately xx% market share in 2025.
- Technological Innovation: Focus on improved embryo selection techniques, genetic screening, and minimally invasive procedures.
- Regulatory Landscape: Varying regulations across countries influence market access and pricing.
- Competitive Substitutes: Alternative fertility treatments and lifestyle changes present competitive pressure.
- End-User Demographics: Increasing demand from older first-time parents and same-sex couples.
- M&A Activity: Moderate level of M&A activity, primarily focused on strategic partnerships and expansion.
Assisted Reproductive Products Growth Trends & Insights
The Assisted Reproductive Products market has experienced substantial growth over the past few years, driven by increasing infertility rates, technological advancements, and rising awareness. The market size exhibited a CAGR of xx% during the historical period (2019-2024) and is projected to maintain a CAGR of xx% during the forecast period (2025-2033). Market penetration varies significantly across regions, with developed countries exhibiting higher adoption rates. Technological disruptions, such as AI-powered embryo selection, are accelerating growth and transforming the market landscape. Changing consumer behavior, favoring personalized and technologically advanced treatments, is a key trend.
(Note: XXX refers to specific data sources used to support the 600-word analysis. This section would be filled with specific data and insights from those sources.)
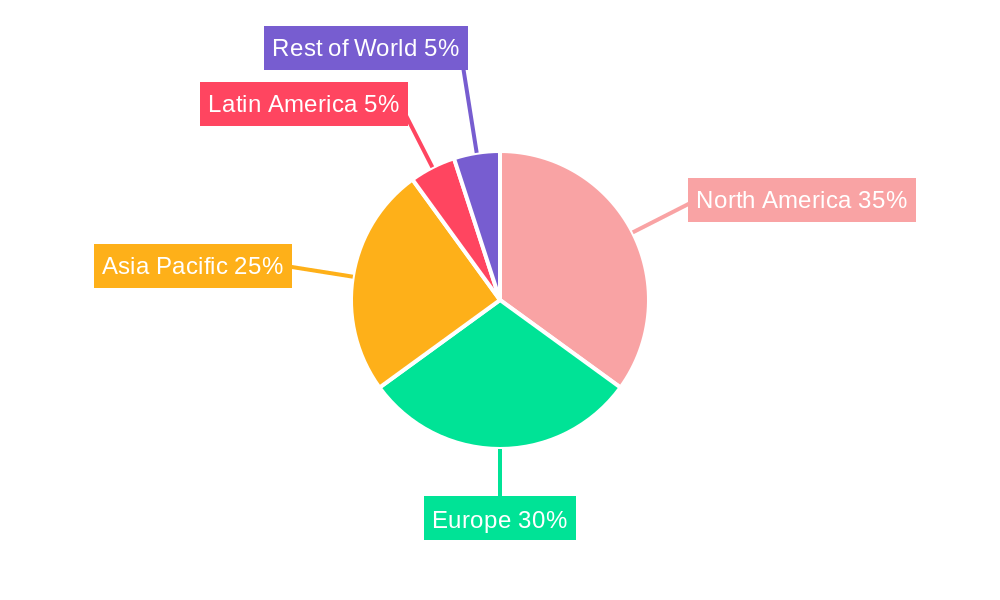
Dominant Regions, Countries, or Segments in Assisted Reproductive Products
North America currently dominates the Assisted Reproductive Products market, owing to factors such as high infertility rates, advanced healthcare infrastructure, and robust regulatory support. Europe follows closely, driven by increasing adoption rates and a growing awareness of assisted reproductive technologies. Asia-Pacific is experiencing rapid growth, fueled by rising disposable incomes, increasing awareness, and government initiatives.
- North America: High adoption rates, advanced healthcare infrastructure, favorable regulatory environment.
- Europe: Strong healthcare systems, increasing awareness, and favorable government policies.
- Asia-Pacific: Rapid growth potential due to rising disposable incomes and growing awareness.
- Other Regions: Moderate growth potential with regional variations.
(This section would be filled with more detailed country-specific data and analysis to support the 600-word requirement)
Assisted Reproductive Products Product Landscape
The Assisted Reproductive Products market offers a diverse range of products, including in-vitro fertilization (IVF) kits, diagnostic tests, and related devices. Innovation focuses on improving the efficiency and effectiveness of these products, enhancing pregnancy success rates, and reducing side effects. Unique selling propositions often center around improved diagnostics, enhanced embryo selection, and personalized treatment plans. Technological advancements in areas such as AI and microfluidics are transforming the product landscape.
Key Drivers, Barriers & Challenges in Assisted Reproductive Products
Key Drivers:
- Increasing infertility rates globally.
- Technological advancements leading to improved success rates.
- Rising disposable incomes and healthcare spending in developing countries.
- Growing awareness and acceptance of assisted reproductive technologies.
Key Challenges:
- High cost of treatment limiting accessibility for a large segment of the population.
- Stringent regulatory approvals and varying regulations across countries.
- Ethical concerns surrounding genetic screening and embryo selection.
- Intense competition among providers.
Emerging Opportunities in Assisted Reproductive Products
- Untapped markets in developing countries with high infertility rates.
- Development of cost-effective and accessible ART technologies.
- Integration of AI and machine learning for improved diagnostics and treatment planning.
- Growing demand for personalized and tailored fertility treatments.
Growth Accelerators in the Assisted Reproductive Products Industry
Long-term growth will be fueled by ongoing technological breakthroughs, particularly in genetic screening and embryo selection. Strategic partnerships between technology companies and healthcare providers will also accelerate innovation and market expansion. Government initiatives aimed at improving access to fertility treatments, coupled with increased awareness campaigns, will play a crucial role in driving market growth.
Key Players Shaping the Assisted Reproductive Products Market
- Suzhou Basecare Medical Corporation Limited
- Yikon Genomics
- Gynotec
- Autobio Diagnostics CO.,Ltd.
- Beijing BerryGenomics Co.,Ltd.
- Jabrehoo
- Capitalbio
- BGI Genomics Co.,Ltd.
- Merck Serono
- Zhejiang Xianju Pharmaceutical Co.,Ltd.
- Livzon Pharmaceutical Group Inc.
- Changchun Genescience Pharmaceutical Co.,Ltd.
- Besins
- Ipsen
- Ferring
- IVFtech
- Minitube Human ART
Notable Milestones in Assisted Reproductive Products Sector
- 2021-Q4: Launch of a new AI-powered embryo selection system by Company X.
- 2022-Q2: Acquisition of Company Y by Company Z, expanding market reach.
- 2023-Q3: FDA approval of a novel diagnostic test for improved embryo assessment. (More milestones would be added here)
In-Depth Assisted Reproductive Products Market Outlook
The Assisted Reproductive Products market holds significant potential for future growth, driven by sustained technological advancements, increased accessibility, and a growing global demand. Strategic partnerships, focused on developing innovative and affordable solutions, will play a critical role in shaping the market's future. The market is expected to see further consolidation, with larger players acquiring smaller companies to expand their product portfolios and geographic reach. The focus on personalized medicine and AI-driven solutions will continue to drive market expansion.
Assisted Reproductive Products Segmentation
-
1. Application
- 1.1. Infertility Patients
- 1.2. Prepare for Pregnancy
-
2. Types
- 2.1. Equipment and Consumables
- 2.2. Medicine
Assisted Reproductive Products Segmentation By Geography
-
1. North America
- 1.1. United States
- 1.2. Canada
- 1.3. Mexico
-
2. South America
- 2.1. Brazil
- 2.2. Argentina
- 2.3. Rest of South America
-
3. Europe
- 3.1. United Kingdom
- 3.2. Germany
- 3.3. France
- 3.4. Italy
- 3.5. Spain
- 3.6. Russia
- 3.7. Benelux
- 3.8. Nordics
- 3.9. Rest of Europe
-
4. Middle East & Africa
- 4.1. Turkey
- 4.2. Israel
- 4.3. GCC
- 4.4. North Africa
- 4.5. South Africa
- 4.6. Rest of Middle East & Africa
-
5. Asia Pacific
- 5.1. China
- 5.2. India
- 5.3. Japan
- 5.4. South Korea
- 5.5. ASEAN
- 5.6. Oceania
- 5.7. Rest of Asia Pacific
Assisted Reproductive Products Regional Market Share
Geographic Coverage of Assisted Reproductive Products
Assisted Reproductive Products REPORT HIGHLIGHTS
| Aspects | Details |
|---|---|
| Study Period | 2020-2034 |
| Base Year | 2025 |
| Estimated Year | 2026 |
| Forecast Period | 2026-2034 |
| Historical Period | 2020-2025 |
| Growth Rate | CAGR of 9.2% from 2020-2034 |
| Segmentation |
|
Table of Contents
- 1. Introduction
- 1.1. Research Scope
- 1.2. Market Segmentation
- 1.3. Research Objective
- 1.4. Definitions and Assumptions
- 2. Executive Summary
- 2.1. Market Snapshot
- 3. Market Dynamics
- 3.1. Market Drivers
- 3.2. Market Restrains
- 3.3. Market Trends
- 3.4. Market Opportunities
- 4. Market Factor Analysis
- 4.1. Porters Five Forces
- 4.1.1. Bargaining Power of Suppliers
- 4.1.2. Bargaining Power of Buyers
- 4.1.3. Threat of New Entrants
- 4.1.4. Threat of Substitutes
- 4.1.5. Competitive Rivalry
- 4.2. PESTEL analysis
- 4.3. BCG Analysis
- 4.3.1. Stars (High Growth, High Market Share)
- 4.3.2. Cash Cows (Low Growth, High Market Share)
- 4.3.3. Question Mark (High Growth, Low Market Share)
- 4.3.4. Dogs (Low Growth, Low Market Share)
- 4.4. Ansoff Matrix Analysis
- 4.5. Supply Chain Analysis
- 4.6. Regulatory Landscape
- 4.7. Current Market Potential and Opportunity Assessment (TAM–SAM–SOM Framework)
- 4.8. NRP Analyst Note
- 4.1. Porters Five Forces
- 5. Market Analysis, Insights and Forecast 2021-2033
- 5.1. Market Analysis, Insights and Forecast - by Application
- 5.1.1. Infertility Patients
- 5.1.2. Prepare for Pregnancy
- 5.2. Market Analysis, Insights and Forecast - by Types
- 5.2.1. Equipment and Consumables
- 5.2.2. Medicine
- 5.3. Market Analysis, Insights and Forecast - by Region
- 5.3.1. North America
- 5.3.2. South America
- 5.3.3. Europe
- 5.3.4. Middle East & Africa
- 5.3.5. Asia Pacific
- 5.1. Market Analysis, Insights and Forecast - by Application
- 6. Global Assisted Reproductive Products Analysis, Insights and Forecast, 2021-2033
- 6.1. Market Analysis, Insights and Forecast - by Application
- 6.1.1. Infertility Patients
- 6.1.2. Prepare for Pregnancy
- 6.2. Market Analysis, Insights and Forecast - by Types
- 6.2.1. Equipment and Consumables
- 6.2.2. Medicine
- 6.1. Market Analysis, Insights and Forecast - by Application
- 7. North America Assisted Reproductive Products Analysis, Insights and Forecast, 2020-2032
- 7.1. Market Analysis, Insights and Forecast - by Application
- 7.1.1. Infertility Patients
- 7.1.2. Prepare for Pregnancy
- 7.2. Market Analysis, Insights and Forecast - by Types
- 7.2.1. Equipment and Consumables
- 7.2.2. Medicine
- 7.1. Market Analysis, Insights and Forecast - by Application
- 8. South America Assisted Reproductive Products Analysis, Insights and Forecast, 2020-2032
- 8.1. Market Analysis, Insights and Forecast - by Application
- 8.1.1. Infertility Patients
- 8.1.2. Prepare for Pregnancy
- 8.2. Market Analysis, Insights and Forecast - by Types
- 8.2.1. Equipment and Consumables
- 8.2.2. Medicine
- 8.1. Market Analysis, Insights and Forecast - by Application
- 9. Europe Assisted Reproductive Products Analysis, Insights and Forecast, 2020-2032
- 9.1. Market Analysis, Insights and Forecast - by Application
- 9.1.1. Infertility Patients
- 9.1.2. Prepare for Pregnancy
- 9.2. Market Analysis, Insights and Forecast - by Types
- 9.2.1. Equipment and Consumables
- 9.2.2. Medicine
- 9.1. Market Analysis, Insights and Forecast - by Application
- 10. Middle East & Africa Assisted Reproductive Products Analysis, Insights and Forecast, 2020-2032
- 10.1. Market Analysis, Insights and Forecast - by Application
- 10.1.1. Infertility Patients
- 10.1.2. Prepare for Pregnancy
- 10.2. Market Analysis, Insights and Forecast - by Types
- 10.2.1. Equipment and Consumables
- 10.2.2. Medicine
- 10.1. Market Analysis, Insights and Forecast - by Application
- 11. Asia Pacific Assisted Reproductive Products Analysis, Insights and Forecast, 2020-2032
- 11.1. Market Analysis, Insights and Forecast - by Application
- 11.1.1. Infertility Patients
- 11.1.2. Prepare for Pregnancy
- 11.2. Market Analysis, Insights and Forecast - by Types
- 11.2.1. Equipment and Consumables
- 11.2.2. Medicine
- 11.1. Market Analysis, Insights and Forecast - by Application
- 12. Competitive Analysis
- 12.1. Company Profiles
- 12.1.1 Suzhou Basecare Medical Corporation Limited
- 12.1.1.1. Company Overview
- 12.1.1.2. Products
- 12.1.1.3. Company Financials
- 12.1.1.4. SWOT Analysis
- 12.1.2 Yikon Genomics
- 12.1.2.1. Company Overview
- 12.1.2.2. Products
- 12.1.2.3. Company Financials
- 12.1.2.4. SWOT Analysis
- 12.1.3 Gynotec
- 12.1.3.1. Company Overview
- 12.1.3.2. Products
- 12.1.3.3. Company Financials
- 12.1.3.4. SWOT Analysis
- 12.1.4 Autobio Diagnostics CO.
- 12.1.4.1. Company Overview
- 12.1.4.2. Products
- 12.1.4.3. Company Financials
- 12.1.4.4. SWOT Analysis
- 12.1.5 Ltd.
- 12.1.5.1. Company Overview
- 12.1.5.2. Products
- 12.1.5.3. Company Financials
- 12.1.5.4. SWOT Analysis
- 12.1.6 Beijing BerryGenomics Co.
- 12.1.6.1. Company Overview
- 12.1.6.2. Products
- 12.1.6.3. Company Financials
- 12.1.6.4. SWOT Analysis
- 12.1.7 Ltd.
- 12.1.7.1. Company Overview
- 12.1.7.2. Products
- 12.1.7.3. Company Financials
- 12.1.7.4. SWOT Analysis
- 12.1.8 Jabrehoo
- 12.1.8.1. Company Overview
- 12.1.8.2. Products
- 12.1.8.3. Company Financials
- 12.1.8.4. SWOT Analysis
- 12.1.9 Capitalbio
- 12.1.9.1. Company Overview
- 12.1.9.2. Products
- 12.1.9.3. Company Financials
- 12.1.9.4. SWOT Analysis
- 12.1.10 BGI Genomics Co.
- 12.1.10.1. Company Overview
- 12.1.10.2. Products
- 12.1.10.3. Company Financials
- 12.1.10.4. SWOT Analysis
- 12.1.11 Ltd.
- 12.1.11.1. Company Overview
- 12.1.11.2. Products
- 12.1.11.3. Company Financials
- 12.1.11.4. SWOT Analysis
- 12.1.12 Merck Serono
- 12.1.12.1. Company Overview
- 12.1.12.2. Products
- 12.1.12.3. Company Financials
- 12.1.12.4. SWOT Analysis
- 12.1.13 Zhejiang Xianju Pharmaceutical Co.
- 12.1.13.1. Company Overview
- 12.1.13.2. Products
- 12.1.13.3. Company Financials
- 12.1.13.4. SWOT Analysis
- 12.1.14 Ltd.
- 12.1.14.1. Company Overview
- 12.1.14.2. Products
- 12.1.14.3. Company Financials
- 12.1.14.4. SWOT Analysis
- 12.1.15 Livzon Pharmaceutical Group Inc.
- 12.1.15.1. Company Overview
- 12.1.15.2. Products
- 12.1.15.3. Company Financials
- 12.1.15.4. SWOT Analysis
- 12.1.16 Changchun Genescience Pharmaceutical Co.
- 12.1.16.1. Company Overview
- 12.1.16.2. Products
- 12.1.16.3. Company Financials
- 12.1.16.4. SWOT Analysis
- 12.1.17 Ltd.
- 12.1.17.1. Company Overview
- 12.1.17.2. Products
- 12.1.17.3. Company Financials
- 12.1.17.4. SWOT Analysis
- 12.1.18 Besins
- 12.1.18.1. Company Overview
- 12.1.18.2. Products
- 12.1.18.3. Company Financials
- 12.1.18.4. SWOT Analysis
- 12.1.19 Ipsen
- 12.1.19.1. Company Overview
- 12.1.19.2. Products
- 12.1.19.3. Company Financials
- 12.1.19.4. SWOT Analysis
- 12.1.20 Ferring
- 12.1.20.1. Company Overview
- 12.1.20.2. Products
- 12.1.20.3. Company Financials
- 12.1.20.4. SWOT Analysis
- 12.1.21 IVFtech
- 12.1.21.1. Company Overview
- 12.1.21.2. Products
- 12.1.21.3. Company Financials
- 12.1.21.4. SWOT Analysis
- 12.1.22 Minitube Human ART
- 12.1.22.1. Company Overview
- 12.1.22.2. Products
- 12.1.22.3. Company Financials
- 12.1.22.4. SWOT Analysis
- 12.1.1 Suzhou Basecare Medical Corporation Limited
- 12.2. Market Entropy
- 12.2.1 Company's Key Areas Served
- 12.2.2 Recent Developments
- 12.3. Company Market Share Analysis 2025
- 12.3.1 Top 5 Companies Market Share Analysis
- 12.3.2 Top 3 Companies Market Share Analysis
- 12.4. List of Potential Customers
- 13. Research Methodology
List of Figures
- Figure 1: Global Assisted Reproductive Products Revenue Breakdown (undefined, %) by Region 2025 & 2033
- Figure 2: Global Assisted Reproductive Products Volume Breakdown (K, %) by Region 2025 & 2033
- Figure 3: North America Assisted Reproductive Products Revenue (undefined), by Application 2025 & 2033
- Figure 4: North America Assisted Reproductive Products Volume (K), by Application 2025 & 2033
- Figure 5: North America Assisted Reproductive Products Revenue Share (%), by Application 2025 & 2033
- Figure 6: North America Assisted Reproductive Products Volume Share (%), by Application 2025 & 2033
- Figure 7: North America Assisted Reproductive Products Revenue (undefined), by Types 2025 & 2033
- Figure 8: North America Assisted Reproductive Products Volume (K), by Types 2025 & 2033
- Figure 9: North America Assisted Reproductive Products Revenue Share (%), by Types 2025 & 2033
- Figure 10: North America Assisted Reproductive Products Volume Share (%), by Types 2025 & 2033
- Figure 11: North America Assisted Reproductive Products Revenue (undefined), by Country 2025 & 2033
- Figure 12: North America Assisted Reproductive Products Volume (K), by Country 2025 & 2033
- Figure 13: North America Assisted Reproductive Products Revenue Share (%), by Country 2025 & 2033
- Figure 14: North America Assisted Reproductive Products Volume Share (%), by Country 2025 & 2033
- Figure 15: South America Assisted Reproductive Products Revenue (undefined), by Application 2025 & 2033
- Figure 16: South America Assisted Reproductive Products Volume (K), by Application 2025 & 2033
- Figure 17: South America Assisted Reproductive Products Revenue Share (%), by Application 2025 & 2033
- Figure 18: South America Assisted Reproductive Products Volume Share (%), by Application 2025 & 2033
- Figure 19: South America Assisted Reproductive Products Revenue (undefined), by Types 2025 & 2033
- Figure 20: South America Assisted Reproductive Products Volume (K), by Types 2025 & 2033
- Figure 21: South America Assisted Reproductive Products Revenue Share (%), by Types 2025 & 2033
- Figure 22: South America Assisted Reproductive Products Volume Share (%), by Types 2025 & 2033
- Figure 23: South America Assisted Reproductive Products Revenue (undefined), by Country 2025 & 2033
- Figure 24: South America Assisted Reproductive Products Volume (K), by Country 2025 & 2033
- Figure 25: South America Assisted Reproductive Products Revenue Share (%), by Country 2025 & 2033
- Figure 26: South America Assisted Reproductive Products Volume Share (%), by Country 2025 & 2033
- Figure 27: Europe Assisted Reproductive Products Revenue (undefined), by Application 2025 & 2033
- Figure 28: Europe Assisted Reproductive Products Volume (K), by Application 2025 & 2033
- Figure 29: Europe Assisted Reproductive Products Revenue Share (%), by Application 2025 & 2033
- Figure 30: Europe Assisted Reproductive Products Volume Share (%), by Application 2025 & 2033
- Figure 31: Europe Assisted Reproductive Products Revenue (undefined), by Types 2025 & 2033
- Figure 32: Europe Assisted Reproductive Products Volume (K), by Types 2025 & 2033
- Figure 33: Europe Assisted Reproductive Products Revenue Share (%), by Types 2025 & 2033
- Figure 34: Europe Assisted Reproductive Products Volume Share (%), by Types 2025 & 2033
- Figure 35: Europe Assisted Reproductive Products Revenue (undefined), by Country 2025 & 2033
- Figure 36: Europe Assisted Reproductive Products Volume (K), by Country 2025 & 2033
- Figure 37: Europe Assisted Reproductive Products Revenue Share (%), by Country 2025 & 2033
- Figure 38: Europe Assisted Reproductive Products Volume Share (%), by Country 2025 & 2033
- Figure 39: Middle East & Africa Assisted Reproductive Products Revenue (undefined), by Application 2025 & 2033
- Figure 40: Middle East & Africa Assisted Reproductive Products Volume (K), by Application 2025 & 2033
- Figure 41: Middle East & Africa Assisted Reproductive Products Revenue Share (%), by Application 2025 & 2033
- Figure 42: Middle East & Africa Assisted Reproductive Products Volume Share (%), by Application 2025 & 2033
- Figure 43: Middle East & Africa Assisted Reproductive Products Revenue (undefined), by Types 2025 & 2033
- Figure 44: Middle East & Africa Assisted Reproductive Products Volume (K), by Types 2025 & 2033
- Figure 45: Middle East & Africa Assisted Reproductive Products Revenue Share (%), by Types 2025 & 2033
- Figure 46: Middle East & Africa Assisted Reproductive Products Volume Share (%), by Types 2025 & 2033
- Figure 47: Middle East & Africa Assisted Reproductive Products Revenue (undefined), by Country 2025 & 2033
- Figure 48: Middle East & Africa Assisted Reproductive Products Volume (K), by Country 2025 & 2033
- Figure 49: Middle East & Africa Assisted Reproductive Products Revenue Share (%), by Country 2025 & 2033
- Figure 50: Middle East & Africa Assisted Reproductive Products Volume Share (%), by Country 2025 & 2033
- Figure 51: Asia Pacific Assisted Reproductive Products Revenue (undefined), by Application 2025 & 2033
- Figure 52: Asia Pacific Assisted Reproductive Products Volume (K), by Application 2025 & 2033
- Figure 53: Asia Pacific Assisted Reproductive Products Revenue Share (%), by Application 2025 & 2033
- Figure 54: Asia Pacific Assisted Reproductive Products Volume Share (%), by Application 2025 & 2033
- Figure 55: Asia Pacific Assisted Reproductive Products Revenue (undefined), by Types 2025 & 2033
- Figure 56: Asia Pacific Assisted Reproductive Products Volume (K), by Types 2025 & 2033
- Figure 57: Asia Pacific Assisted Reproductive Products Revenue Share (%), by Types 2025 & 2033
- Figure 58: Asia Pacific Assisted Reproductive Products Volume Share (%), by Types 2025 & 2033
- Figure 59: Asia Pacific Assisted Reproductive Products Revenue (undefined), by Country 2025 & 2033
- Figure 60: Asia Pacific Assisted Reproductive Products Volume (K), by Country 2025 & 2033
- Figure 61: Asia Pacific Assisted Reproductive Products Revenue Share (%), by Country 2025 & 2033
- Figure 62: Asia Pacific Assisted Reproductive Products Volume Share (%), by Country 2025 & 2033
List of Tables
- Table 1: Global Assisted Reproductive Products Revenue undefined Forecast, by Application 2020 & 2033
- Table 2: Global Assisted Reproductive Products Volume K Forecast, by Application 2020 & 2033
- Table 3: Global Assisted Reproductive Products Revenue undefined Forecast, by Types 2020 & 2033
- Table 4: Global Assisted Reproductive Products Volume K Forecast, by Types 2020 & 2033
- Table 5: Global Assisted Reproductive Products Revenue undefined Forecast, by Region 2020 & 2033
- Table 6: Global Assisted Reproductive Products Volume K Forecast, by Region 2020 & 2033
- Table 7: Global Assisted Reproductive Products Revenue undefined Forecast, by Application 2020 & 2033
- Table 8: Global Assisted Reproductive Products Volume K Forecast, by Application 2020 & 2033
- Table 9: Global Assisted Reproductive Products Revenue undefined Forecast, by Types 2020 & 2033
- Table 10: Global Assisted Reproductive Products Volume K Forecast, by Types 2020 & 2033
- Table 11: Global Assisted Reproductive Products Revenue undefined Forecast, by Country 2020 & 2033
- Table 12: Global Assisted Reproductive Products Volume K Forecast, by Country 2020 & 2033
- Table 13: United States Assisted Reproductive Products Revenue (undefined) Forecast, by Application 2020 & 2033
- Table 14: United States Assisted Reproductive Products Volume (K) Forecast, by Application 2020 & 2033
- Table 15: Canada Assisted Reproductive Products Revenue (undefined) Forecast, by Application 2020 & 2033
- Table 16: Canada Assisted Reproductive Products Volume (K) Forecast, by Application 2020 & 2033
- Table 17: Mexico Assisted Reproductive Products Revenue (undefined) Forecast, by Application 2020 & 2033
- Table 18: Mexico Assisted Reproductive Products Volume (K) Forecast, by Application 2020 & 2033
- Table 19: Global Assisted Reproductive Products Revenue undefined Forecast, by Application 2020 & 2033
- Table 20: Global Assisted Reproductive Products Volume K Forecast, by Application 2020 & 2033
- Table 21: Global Assisted Reproductive Products Revenue undefined Forecast, by Types 2020 & 2033
- Table 22: Global Assisted Reproductive Products Volume K Forecast, by Types 2020 & 2033
- Table 23: Global Assisted Reproductive Products Revenue undefined Forecast, by Country 2020 & 2033
- Table 24: Global Assisted Reproductive Products Volume K Forecast, by Country 2020 & 2033
- Table 25: Brazil Assisted Reproductive Products Revenue (undefined) Forecast, by Application 2020 & 2033
- Table 26: Brazil Assisted Reproductive Products Volume (K) Forecast, by Application 2020 & 2033
- Table 27: Argentina Assisted Reproductive Products Revenue (undefined) Forecast, by Application 2020 & 2033
- Table 28: Argentina Assisted Reproductive Products Volume (K) Forecast, by Application 2020 & 2033
- Table 29: Rest of South America Assisted Reproductive Products Revenue (undefined) Forecast, by Application 2020 & 2033
- Table 30: Rest of South America Assisted Reproductive Products Volume (K) Forecast, by Application 2020 & 2033
- Table 31: Global Assisted Reproductive Products Revenue undefined Forecast, by Application 2020 & 2033
- Table 32: Global Assisted Reproductive Products Volume K Forecast, by Application 2020 & 2033
- Table 33: Global Assisted Reproductive Products Revenue undefined Forecast, by Types 2020 & 2033
- Table 34: Global Assisted Reproductive Products Volume K Forecast, by Types 2020 & 2033
- Table 35: Global Assisted Reproductive Products Revenue undefined Forecast, by Country 2020 & 2033
- Table 36: Global Assisted Reproductive Products Volume K Forecast, by Country 2020 & 2033
- Table 37: United Kingdom Assisted Reproductive Products Revenue (undefined) Forecast, by Application 2020 & 2033
- Table 38: United Kingdom Assisted Reproductive Products Volume (K) Forecast, by Application 2020 & 2033
- Table 39: Germany Assisted Reproductive Products Revenue (undefined) Forecast, by Application 2020 & 2033
- Table 40: Germany Assisted Reproductive Products Volume (K) Forecast, by Application 2020 & 2033
- Table 41: France Assisted Reproductive Products Revenue (undefined) Forecast, by Application 2020 & 2033
- Table 42: France Assisted Reproductive Products Volume (K) Forecast, by Application 2020 & 2033
- Table 43: Italy Assisted Reproductive Products Revenue (undefined) Forecast, by Application 2020 & 2033
- Table 44: Italy Assisted Reproductive Products Volume (K) Forecast, by Application 2020 & 2033
- Table 45: Spain Assisted Reproductive Products Revenue (undefined) Forecast, by Application 2020 & 2033
- Table 46: Spain Assisted Reproductive Products Volume (K) Forecast, by Application 2020 & 2033
- Table 47: Russia Assisted Reproductive Products Revenue (undefined) Forecast, by Application 2020 & 2033
- Table 48: Russia Assisted Reproductive Products Volume (K) Forecast, by Application 2020 & 2033
- Table 49: Benelux Assisted Reproductive Products Revenue (undefined) Forecast, by Application 2020 & 2033
- Table 50: Benelux Assisted Reproductive Products Volume (K) Forecast, by Application 2020 & 2033
- Table 51: Nordics Assisted Reproductive Products Revenue (undefined) Forecast, by Application 2020 & 2033
- Table 52: Nordics Assisted Reproductive Products Volume (K) Forecast, by Application 2020 & 2033
- Table 53: Rest of Europe Assisted Reproductive Products Revenue (undefined) Forecast, by Application 2020 & 2033
- Table 54: Rest of Europe Assisted Reproductive Products Volume (K) Forecast, by Application 2020 & 2033
- Table 55: Global Assisted Reproductive Products Revenue undefined Forecast, by Application 2020 & 2033
- Table 56: Global Assisted Reproductive Products Volume K Forecast, by Application 2020 & 2033
- Table 57: Global Assisted Reproductive Products Revenue undefined Forecast, by Types 2020 & 2033
- Table 58: Global Assisted Reproductive Products Volume K Forecast, by Types 2020 & 2033
- Table 59: Global Assisted Reproductive Products Revenue undefined Forecast, by Country 2020 & 2033
- Table 60: Global Assisted Reproductive Products Volume K Forecast, by Country 2020 & 2033
- Table 61: Turkey Assisted Reproductive Products Revenue (undefined) Forecast, by Application 2020 & 2033
- Table 62: Turkey Assisted Reproductive Products Volume (K) Forecast, by Application 2020 & 2033
- Table 63: Israel Assisted Reproductive Products Revenue (undefined) Forecast, by Application 2020 & 2033
- Table 64: Israel Assisted Reproductive Products Volume (K) Forecast, by Application 2020 & 2033
- Table 65: GCC Assisted Reproductive Products Revenue (undefined) Forecast, by Application 2020 & 2033
- Table 66: GCC Assisted Reproductive Products Volume (K) Forecast, by Application 2020 & 2033
- Table 67: North Africa Assisted Reproductive Products Revenue (undefined) Forecast, by Application 2020 & 2033
- Table 68: North Africa Assisted Reproductive Products Volume (K) Forecast, by Application 2020 & 2033
- Table 69: South Africa Assisted Reproductive Products Revenue (undefined) Forecast, by Application 2020 & 2033
- Table 70: South Africa Assisted Reproductive Products Volume (K) Forecast, by Application 2020 & 2033
- Table 71: Rest of Middle East & Africa Assisted Reproductive Products Revenue (undefined) Forecast, by Application 2020 & 2033
- Table 72: Rest of Middle East & Africa Assisted Reproductive Products Volume (K) Forecast, by Application 2020 & 2033
- Table 73: Global Assisted Reproductive Products Revenue undefined Forecast, by Application 2020 & 2033
- Table 74: Global Assisted Reproductive Products Volume K Forecast, by Application 2020 & 2033
- Table 75: Global Assisted Reproductive Products Revenue undefined Forecast, by Types 2020 & 2033
- Table 76: Global Assisted Reproductive Products Volume K Forecast, by Types 2020 & 2033
- Table 77: Global Assisted Reproductive Products Revenue undefined Forecast, by Country 2020 & 2033
- Table 78: Global Assisted Reproductive Products Volume K Forecast, by Country 2020 & 2033
- Table 79: China Assisted Reproductive Products Revenue (undefined) Forecast, by Application 2020 & 2033
- Table 80: China Assisted Reproductive Products Volume (K) Forecast, by Application 2020 & 2033
- Table 81: India Assisted Reproductive Products Revenue (undefined) Forecast, by Application 2020 & 2033
- Table 82: India Assisted Reproductive Products Volume (K) Forecast, by Application 2020 & 2033
- Table 83: Japan Assisted Reproductive Products Revenue (undefined) Forecast, by Application 2020 & 2033
- Table 84: Japan Assisted Reproductive Products Volume (K) Forecast, by Application 2020 & 2033
- Table 85: South Korea Assisted Reproductive Products Revenue (undefined) Forecast, by Application 2020 & 2033
- Table 86: South Korea Assisted Reproductive Products Volume (K) Forecast, by Application 2020 & 2033
- Table 87: ASEAN Assisted Reproductive Products Revenue (undefined) Forecast, by Application 2020 & 2033
- Table 88: ASEAN Assisted Reproductive Products Volume (K) Forecast, by Application 2020 & 2033
- Table 89: Oceania Assisted Reproductive Products Revenue (undefined) Forecast, by Application 2020 & 2033
- Table 90: Oceania Assisted Reproductive Products Volume (K) Forecast, by Application 2020 & 2033
- Table 91: Rest of Asia Pacific Assisted Reproductive Products Revenue (undefined) Forecast, by Application 2020 & 2033
- Table 92: Rest of Asia Pacific Assisted Reproductive Products Volume (K) Forecast, by Application 2020 & 2033
Frequently Asked Questions
1. What is the projected Compound Annual Growth Rate (CAGR) of the Assisted Reproductive Products?
The projected CAGR is approximately 9.2%.
2. Which companies are prominent players in the Assisted Reproductive Products?
Key companies in the market include Suzhou Basecare Medical Corporation Limited, Yikon Genomics, Gynotec, Autobio Diagnostics CO., Ltd., Beijing BerryGenomics Co., Ltd., Jabrehoo, Capitalbio, BGI Genomics Co., Ltd., Merck Serono, Zhejiang Xianju Pharmaceutical Co., Ltd., Livzon Pharmaceutical Group Inc., Changchun Genescience Pharmaceutical Co., Ltd., Besins, Ipsen, Ferring, IVFtech, Minitube Human ART.
3. What are the main segments of the Assisted Reproductive Products?
The market segments include Application, Types.
4. Can you provide details about the market size?
The market size is estimated to be USD XXX N/A as of 2022.
5. What are some drivers contributing to market growth?
N/A
6. What are the notable trends driving market growth?
N/A
7. Are there any restraints impacting market growth?
N/A
8. Can you provide examples of recent developments in the market?
N/A
9. What pricing options are available for accessing the report?
Pricing options include single-user, multi-user, and enterprise licenses priced at USD 3950.00, USD 5925.00, and USD 7900.00 respectively.
10. Is the market size provided in terms of value or volume?
The market size is provided in terms of value, measured in N/A and volume, measured in K.
11. Are there any specific market keywords associated with the report?
Yes, the market keyword associated with the report is "Assisted Reproductive Products," which aids in identifying and referencing the specific market segment covered.
12. How do I determine which pricing option suits my needs best?
The pricing options vary based on user requirements and access needs. Individual users may opt for single-user licenses, while businesses requiring broader access may choose multi-user or enterprise licenses for cost-effective access to the report.
13. Are there any additional resources or data provided in the Assisted Reproductive Products report?
While the report offers comprehensive insights, it's advisable to review the specific contents or supplementary materials provided to ascertain if additional resources or data are available.
14. How can I stay updated on further developments or reports in the Assisted Reproductive Products?
To stay informed about further developments, trends, and reports in the Assisted Reproductive Products, consider subscribing to industry newsletters, following relevant companies and organizations, or regularly checking reputable industry news sources and publications.
Methodology
Step 1 - Identification of Relevant Samples Size from Population Database


Step 2 - Approaches for Defining Global Market Size (Value, Volume* & Price*)

Note*: In applicable scenarios
Step 3 - Data Sources
Primary Research
- Web Analytics
- Survey Reports
- Research Institute
- Latest Research Reports
- Opinion Leaders
Secondary Research
- Annual Reports
- White Paper
- Latest Press Release
- Industry Association
- Paid Database
- Investor Presentations

Step 4 - Data Triangulation
Involves using different sources of information in order to increase the validity of a study
These sources are likely to be stakeholders in a program - participants, other researchers, program staff, other community members, and so on.
Then we put all data in single framework & apply various statistical tools to find out the dynamic on the market.
During the analysis stage, feedback from the stakeholder groups would be compared to determine areas of agreement as well as areas of divergence