

Key Insights
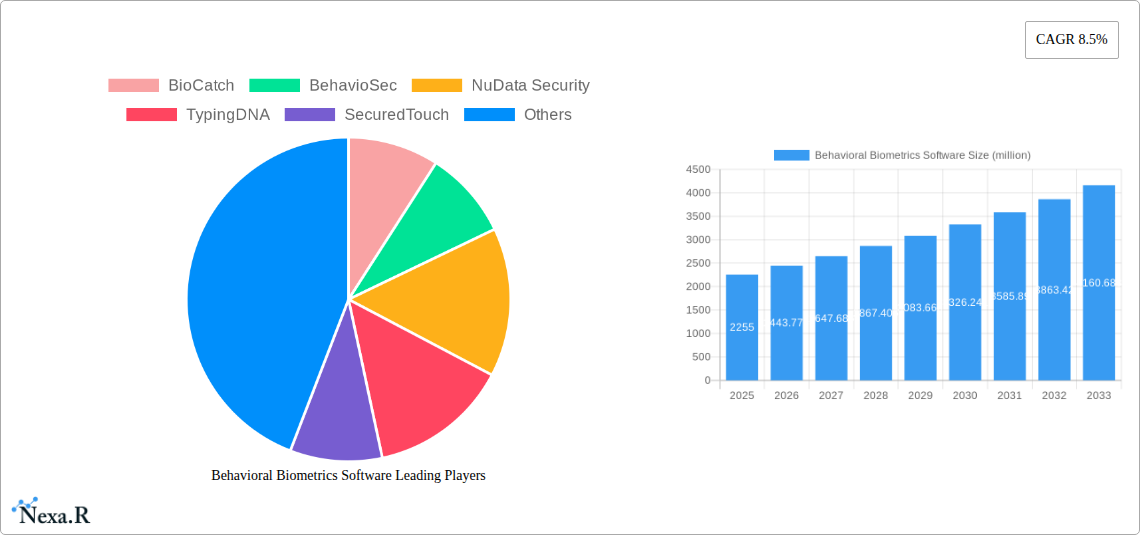
The behavioral biometrics software market, currently valued at approximately $2.255 billion in 2025, is poised for significant growth, exhibiting a Compound Annual Growth Rate (CAGR) of 8.5% from 2025 to 2033. This robust expansion is driven by several key factors. The increasing prevalence of cyber threats and data breaches is fueling the demand for advanced security solutions that go beyond traditional password-based authentication. Behavioral biometrics, which analyzes unique user patterns like typing rhythm, mouse movements, and scrolling behavior, offers a robust layer of security that is both effective and user-friendly. Furthermore, the rising adoption of mobile and remote work environments has heightened the need for secure access controls, further propelling market growth. The integration of behavioral biometrics into various applications, from financial transactions to access control systems, expands the market's addressable market. Leading vendors like BioCatch, BehavioSec, and NuData Security are driving innovation through continuous product development and strategic partnerships, solidifying the market's trajectory.
The market segmentation is likely diversified across various industries, including finance, healthcare, and government, each with unique security requirements. Geographic distribution will likely see strong growth in North America and Europe, given the advanced technological infrastructure and regulatory landscape. However, developing economies are also expected to experience substantial growth as awareness of cybersecurity threats increases and digital adoption accelerates. Restraints on market growth might include concerns regarding data privacy, the complexity of implementation, and the cost of integrating behavioral biometrics into existing systems. Nevertheless, the advantages of enhanced security and improved user experience are likely to outweigh these challenges, ensuring continued strong growth in the forecast period.
Behavioral Biometrics Software Market Report: 2019-2033
This comprehensive report provides a detailed analysis of the Behavioral Biometrics Software market, encompassing market dynamics, growth trends, regional analysis, competitive landscape, and future outlook. The study period covers 2019-2033, with 2025 as the base and estimated year. The forecast period is 2025-2033, and the historical period is 2019-2024. The report caters to industry professionals, investors, and researchers seeking in-depth insights into this rapidly evolving market. The total market size is projected to reach xx million by 2033.
Behavioral Biometrics Software Market Dynamics & Structure
The behavioral biometrics software market is experiencing significant growth driven by increasing concerns over digital security and fraud prevention. Market concentration is moderate, with several key players holding substantial market share, but a fragmented landscape also exists, particularly amongst smaller, niche providers. Technological innovation, particularly in AI and machine learning, is a key driver, leading to more accurate and efficient authentication solutions. Regulatory frameworks, such as GDPR and CCPA, are also influencing market growth by increasing the demand for robust and compliant authentication methods. Competitive substitutes include traditional password-based systems and other biometric technologies (e.g., fingerprint, facial recognition), but behavioral biometrics offer unique advantages in terms of continuous authentication and passive data collection.
- Market Concentration: Moderate, with top 5 players holding approximately xx% of the market share in 2025.
- Technological Innovation: AI-powered anomaly detection and continuous authentication are major drivers.
- Regulatory Landscape: GDPR, CCPA, and other data privacy regulations are boosting demand.
- Competitive Substitutes: Password-based authentication, fingerprint, and facial recognition technologies.
- M&A Activity: An estimated xx M&A deals occurred between 2019 and 2024, indicating consolidation within the market. The value of these deals totaled approximately xx million.
- End-User Demographics: Predominantly financial institutions, government agencies, and large enterprises, with increasing adoption in healthcare and other sectors.
Behavioral Biometrics Software Growth Trends & Insights
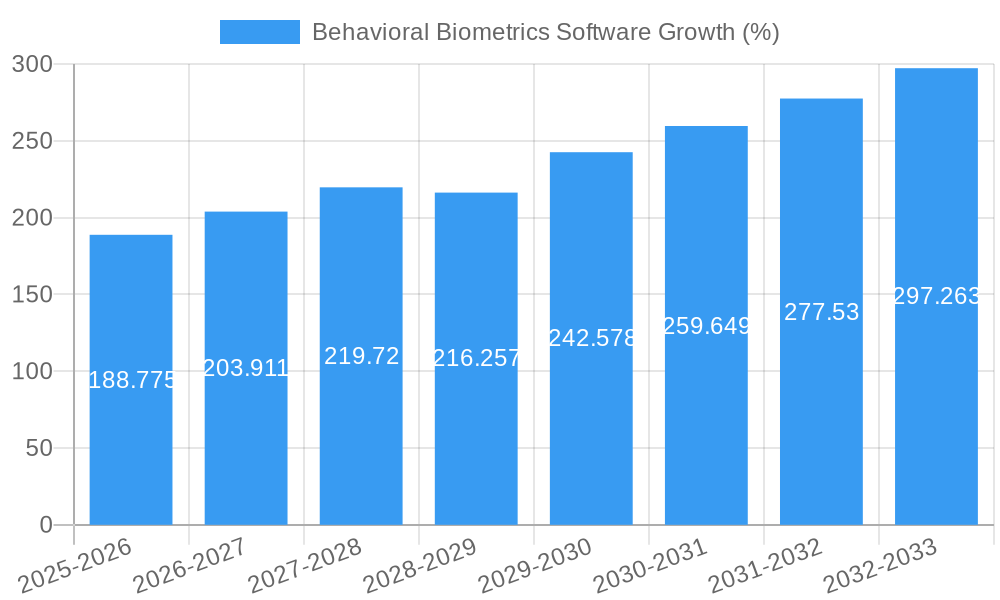
The behavioral biometrics software market has witnessed significant growth over the past few years, fueled by rising cyber threats and the need for more secure authentication methods. The market size reached xx million in 2024 and is projected to experience a Compound Annual Growth Rate (CAGR) of xx% during the forecast period (2025-2033), reaching xx million by 2033. This growth is attributed to several factors, including increased adoption rates across various industries, technological advancements like AI and machine learning enhancing accuracy, and a shift in consumer preference towards more frictionless yet secure authentication experiences. The market penetration rate is expected to increase from xx% in 2024 to xx% by 2033. This upward trajectory is further supported by the increasing awareness of the limitations of traditional authentication methods and the growing sophistication of cyberattacks.
Dominant Regions, Countries, or Segments in Behavioral Biometrics Software
North America currently dominates the behavioral biometrics software market, driven by the high adoption rate in the financial sector and the presence of major technology companies. Europe follows closely, propelled by stringent data privacy regulations and a growing awareness of cybersecurity threats. The Asia-Pacific region is exhibiting strong growth potential, fueled by rapid digitalization and increasing investment in cybersecurity infrastructure.
- North America: High adoption rates in financial services and robust cybersecurity investments are key drivers. Market share: xx% in 2025.
- Europe: Stringent data privacy regulations and increasing cyber threats are driving growth. Market share: xx% in 2025.
- Asia-Pacific: Rapid digitalization and growing cybersecurity infrastructure investments are fueling market expansion. Market share: xx% in 2025.
- Key Drivers: Strong regulatory frameworks, increasing cyberattacks, and high digital adoption rates.
Behavioral Biometrics Software Product Landscape
Behavioral biometrics software solutions offer a range of features, including passive authentication, fraud detection, risk scoring, and user behavior analysis. Recent product innovations have focused on improving accuracy, reducing friction, and integrating with existing security systems. Key advancements include the use of AI and machine learning to analyze increasingly complex behavioral patterns, leading to more robust fraud detection capabilities and enhanced user experience. Unique selling propositions include continuous authentication, reducing reliance on passwords, and improving security without hindering user experience.
Key Drivers, Barriers & Challenges in Behavioral Biometrics Software
Key Drivers:
- Increasing cybercrime and fraud incidents.
- Growing demand for robust and secure authentication methods.
- Advancements in AI and machine learning technologies.
- Stringent data privacy regulations.
Challenges and Restraints:
- High initial implementation costs.
- Concerns about data privacy and security.
- Lack of standardization and interoperability.
- Potential for bias and inaccuracies in behavioral data analysis. This leads to approximately xx million in lost revenue annually for companies impacted.
Emerging Opportunities in Behavioral Biometrics Software
- Expansion into new markets, such as healthcare and IoT.
- Development of more sophisticated and accurate algorithms using advanced AI and machine learning.
- Integration with other biometric technologies for enhanced security.
- Focus on user experience and frictionless authentication.
Growth Accelerators in the Behavioral Biometrics Software Industry
Strategic partnerships and collaborations between behavioral biometrics companies and technology providers are driving significant growth. Furthermore, technological breakthroughs in AI and machine learning are leading to enhanced accuracy and efficiency of behavioral biometrics solutions, accelerating market expansion. Increased regulatory pressure for improved security measures is also creating strong demand for these solutions.
Key Players Shaping the Behavioral Biometrics Software Market
- BioCatch
- BehavioSec
- NuData Security
- TypingDNA
- SecuredTouch
- Zighra
- Plurilock
- UnifyID
- SentiLink
- GuardSquare
- IBM
- Frictionless Security
Notable Milestones in Behavioral Biometrics Software Sector
- 2020: BioCatch launches its next-generation behavioral biometrics platform.
- 2021: BehavioSec secures a significant funding round to expand its operations.
- 2022: NuData Security integrates its behavioral biometrics solution with a major payment gateway.
- 2023: TypingDNA releases a new SDK for easier integration into mobile applications.
- 2024: Several significant acquisitions and mergers take place within the industry.
In-Depth Behavioral Biometrics Software Market Outlook
The future of the behavioral biometrics software market looks promising. Continued technological advancements, increasing cybersecurity threats, and the growing adoption of digital technologies across various industries will drive significant market growth. The focus on enhancing user experience while maintaining robust security will be crucial for market success. Strategic partnerships and collaborations will play a key role in accelerating market expansion. The market is expected to witness considerable consolidation in the coming years, with larger players acquiring smaller companies to expand their product portfolio and market reach. The overall market potential is substantial, offering significant opportunities for innovation and growth.
Behavioral Biometrics Software Segmentation
-
1. Application
- 1.1. SMEs
- 1.2. Large Enterprises
-
2. Types
- 2.1. Cloud-Based
- 2.2. On-Premises
Behavioral Biometrics Software Segmentation By Geography
-
1. North America
- 1.1. United States
- 1.2. Canada
- 1.3. Mexico
-
2. South America
- 2.1. Brazil
- 2.2. Argentina
- 2.3. Rest of South America
-
3. Europe
- 3.1. United Kingdom
- 3.2. Germany
- 3.3. France
- 3.4. Italy
- 3.5. Spain
- 3.6. Russia
- 3.7. Benelux
- 3.8. Nordics
- 3.9. Rest of Europe
-
4. Middle East & Africa
- 4.1. Turkey
- 4.2. Israel
- 4.3. GCC
- 4.4. North Africa
- 4.5. South Africa
- 4.6. Rest of Middle East & Africa
-
5. Asia Pacific
- 5.1. China
- 5.2. India
- 5.3. Japan
- 5.4. South Korea
- 5.5. ASEAN
- 5.6. Oceania
- 5.7. Rest of Asia Pacific

Behavioral Biometrics Software REPORT HIGHLIGHTS
| Aspects | Details |
|---|---|
| Study Period | 2019-2033 |
| Base Year | 2024 |
| Estimated Year | 2025 |
| Forecast Period | 2025-2033 |
| Historical Period | 2019-2024 |
| Growth Rate | CAGR of 8.5% from 2019-2033 |
| Segmentation |
|
Table of Contents
- 1. Introduction
- 1.1. Research Scope
- 1.2. Market Segmentation
- 1.3. Research Methodology
- 1.4. Definitions and Assumptions
- 2. Executive Summary
- 2.1. Introduction
- 3. Market Dynamics
- 3.1. Introduction
- 3.2. Market Drivers
- 3.3. Market Restrains
- 3.4. Market Trends
- 4. Market Factor Analysis
- 4.1. Porters Five Forces
- 4.2. Supply/Value Chain
- 4.3. PESTEL analysis
- 4.4. Market Entropy
- 4.5. Patent/Trademark Analysis
- 5. Global Behavioral Biometrics Software Analysis, Insights and Forecast, 2019-2031
- 5.1. Market Analysis, Insights and Forecast - by Application
- 5.1.1. SMEs
- 5.1.2. Large Enterprises
- 5.2. Market Analysis, Insights and Forecast - by Types
- 5.2.1. Cloud-Based
- 5.2.2. On-Premises
- 5.3. Market Analysis, Insights and Forecast - by Region
- 5.3.1. North America
- 5.3.2. South America
- 5.3.3. Europe
- 5.3.4. Middle East & Africa
- 5.3.5. Asia Pacific
- 5.1. Market Analysis, Insights and Forecast - by Application
- 6. North America Behavioral Biometrics Software Analysis, Insights and Forecast, 2019-2031
- 6.1. Market Analysis, Insights and Forecast - by Application
- 6.1.1. SMEs
- 6.1.2. Large Enterprises
- 6.2. Market Analysis, Insights and Forecast - by Types
- 6.2.1. Cloud-Based
- 6.2.2. On-Premises
- 6.1. Market Analysis, Insights and Forecast - by Application
- 7. South America Behavioral Biometrics Software Analysis, Insights and Forecast, 2019-2031
- 7.1. Market Analysis, Insights and Forecast - by Application
- 7.1.1. SMEs
- 7.1.2. Large Enterprises
- 7.2. Market Analysis, Insights and Forecast - by Types
- 7.2.1. Cloud-Based
- 7.2.2. On-Premises
- 7.1. Market Analysis, Insights and Forecast - by Application
- 8. Europe Behavioral Biometrics Software Analysis, Insights and Forecast, 2019-2031
- 8.1. Market Analysis, Insights and Forecast - by Application
- 8.1.1. SMEs
- 8.1.2. Large Enterprises
- 8.2. Market Analysis, Insights and Forecast - by Types
- 8.2.1. Cloud-Based
- 8.2.2. On-Premises
- 8.1. Market Analysis, Insights and Forecast - by Application
- 9. Middle East & Africa Behavioral Biometrics Software Analysis, Insights and Forecast, 2019-2031
- 9.1. Market Analysis, Insights and Forecast - by Application
- 9.1.1. SMEs
- 9.1.2. Large Enterprises
- 9.2. Market Analysis, Insights and Forecast - by Types
- 9.2.1. Cloud-Based
- 9.2.2. On-Premises
- 9.1. Market Analysis, Insights and Forecast - by Application
- 10. Asia Pacific Behavioral Biometrics Software Analysis, Insights and Forecast, 2019-2031
- 10.1. Market Analysis, Insights and Forecast - by Application
- 10.1.1. SMEs
- 10.1.2. Large Enterprises
- 10.2. Market Analysis, Insights and Forecast - by Types
- 10.2.1. Cloud-Based
- 10.2.2. On-Premises
- 10.1. Market Analysis, Insights and Forecast - by Application
- 11. Competitive Analysis
- 11.1. Global Market Share Analysis 2024
- 11.2. Company Profiles
- 11.2.1 BioCatch
- 11.2.1.1. Overview
- 11.2.1.2. Products
- 11.2.1.3. SWOT Analysis
- 11.2.1.4. Recent Developments
- 11.2.1.5. Financials (Based on Availability)
- 11.2.2 BehavioSec
- 11.2.2.1. Overview
- 11.2.2.2. Products
- 11.2.2.3. SWOT Analysis
- 11.2.2.4. Recent Developments
- 11.2.2.5. Financials (Based on Availability)
- 11.2.3 NuData Security
- 11.2.3.1. Overview
- 11.2.3.2. Products
- 11.2.3.3. SWOT Analysis
- 11.2.3.4. Recent Developments
- 11.2.3.5. Financials (Based on Availability)
- 11.2.4 TypingDNA
- 11.2.4.1. Overview
- 11.2.4.2. Products
- 11.2.4.3. SWOT Analysis
- 11.2.4.4. Recent Developments
- 11.2.4.5. Financials (Based on Availability)
- 11.2.5 SecuredTouch
- 11.2.5.1. Overview
- 11.2.5.2. Products
- 11.2.5.3. SWOT Analysis
- 11.2.5.4. Recent Developments
- 11.2.5.5. Financials (Based on Availability)
- 11.2.6 Zighra
- 11.2.6.1. Overview
- 11.2.6.2. Products
- 11.2.6.3. SWOT Analysis
- 11.2.6.4. Recent Developments
- 11.2.6.5. Financials (Based on Availability)
- 11.2.7 Plurilock
- 11.2.7.1. Overview
- 11.2.7.2. Products
- 11.2.7.3. SWOT Analysis
- 11.2.7.4. Recent Developments
- 11.2.7.5. Financials (Based on Availability)
- 11.2.8 UnifyID
- 11.2.8.1. Overview
- 11.2.8.2. Products
- 11.2.8.3. SWOT Analysis
- 11.2.8.4. Recent Developments
- 11.2.8.5. Financials (Based on Availability)
- 11.2.9 SentiLink
- 11.2.9.1. Overview
- 11.2.9.2. Products
- 11.2.9.3. SWOT Analysis
- 11.2.9.4. Recent Developments
- 11.2.9.5. Financials (Based on Availability)
- 11.2.10 GuardSquare
- 11.2.10.1. Overview
- 11.2.10.2. Products
- 11.2.10.3. SWOT Analysis
- 11.2.10.4. Recent Developments
- 11.2.10.5. Financials (Based on Availability)
- 11.2.11 IBM
- 11.2.11.1. Overview
- 11.2.11.2. Products
- 11.2.11.3. SWOT Analysis
- 11.2.11.4. Recent Developments
- 11.2.11.5. Financials (Based on Availability)
- 11.2.12 Frictionless Security
- 11.2.12.1. Overview
- 11.2.12.2. Products
- 11.2.12.3. SWOT Analysis
- 11.2.12.4. Recent Developments
- 11.2.12.5. Financials (Based on Availability)
- 11.2.1 BioCatch
List of Figures
- Figure 1: Global Behavioral Biometrics Software Revenue Breakdown (million, %) by Region 2024 & 2032
- Figure 2: North America Behavioral Biometrics Software Revenue (million), by Application 2024 & 2032
- Figure 3: North America Behavioral Biometrics Software Revenue Share (%), by Application 2024 & 2032
- Figure 4: North America Behavioral Biometrics Software Revenue (million), by Types 2024 & 2032
- Figure 5: North America Behavioral Biometrics Software Revenue Share (%), by Types 2024 & 2032
- Figure 6: North America Behavioral Biometrics Software Revenue (million), by Country 2024 & 2032
- Figure 7: North America Behavioral Biometrics Software Revenue Share (%), by Country 2024 & 2032
- Figure 8: South America Behavioral Biometrics Software Revenue (million), by Application 2024 & 2032
- Figure 9: South America Behavioral Biometrics Software Revenue Share (%), by Application 2024 & 2032
- Figure 10: South America Behavioral Biometrics Software Revenue (million), by Types 2024 & 2032
- Figure 11: South America Behavioral Biometrics Software Revenue Share (%), by Types 2024 & 2032
- Figure 12: South America Behavioral Biometrics Software Revenue (million), by Country 2024 & 2032
- Figure 13: South America Behavioral Biometrics Software Revenue Share (%), by Country 2024 & 2032
- Figure 14: Europe Behavioral Biometrics Software Revenue (million), by Application 2024 & 2032
- Figure 15: Europe Behavioral Biometrics Software Revenue Share (%), by Application 2024 & 2032
- Figure 16: Europe Behavioral Biometrics Software Revenue (million), by Types 2024 & 2032
- Figure 17: Europe Behavioral Biometrics Software Revenue Share (%), by Types 2024 & 2032
- Figure 18: Europe Behavioral Biometrics Software Revenue (million), by Country 2024 & 2032
- Figure 19: Europe Behavioral Biometrics Software Revenue Share (%), by Country 2024 & 2032
- Figure 20: Middle East & Africa Behavioral Biometrics Software Revenue (million), by Application 2024 & 2032
- Figure 21: Middle East & Africa Behavioral Biometrics Software Revenue Share (%), by Application 2024 & 2032
- Figure 22: Middle East & Africa Behavioral Biometrics Software Revenue (million), by Types 2024 & 2032
- Figure 23: Middle East & Africa Behavioral Biometrics Software Revenue Share (%), by Types 2024 & 2032
- Figure 24: Middle East & Africa Behavioral Biometrics Software Revenue (million), by Country 2024 & 2032
- Figure 25: Middle East & Africa Behavioral Biometrics Software Revenue Share (%), by Country 2024 & 2032
- Figure 26: Asia Pacific Behavioral Biometrics Software Revenue (million), by Application 2024 & 2032
- Figure 27: Asia Pacific Behavioral Biometrics Software Revenue Share (%), by Application 2024 & 2032
- Figure 28: Asia Pacific Behavioral Biometrics Software Revenue (million), by Types 2024 & 2032
- Figure 29: Asia Pacific Behavioral Biometrics Software Revenue Share (%), by Types 2024 & 2032
- Figure 30: Asia Pacific Behavioral Biometrics Software Revenue (million), by Country 2024 & 2032
- Figure 31: Asia Pacific Behavioral Biometrics Software Revenue Share (%), by Country 2024 & 2032
List of Tables
- Table 1: Global Behavioral Biometrics Software Revenue million Forecast, by Region 2019 & 2032
- Table 2: Global Behavioral Biometrics Software Revenue million Forecast, by Application 2019 & 2032
- Table 3: Global Behavioral Biometrics Software Revenue million Forecast, by Types 2019 & 2032
- Table 4: Global Behavioral Biometrics Software Revenue million Forecast, by Region 2019 & 2032
- Table 5: Global Behavioral Biometrics Software Revenue million Forecast, by Application 2019 & 2032
- Table 6: Global Behavioral Biometrics Software Revenue million Forecast, by Types 2019 & 2032
- Table 7: Global Behavioral Biometrics Software Revenue million Forecast, by Country 2019 & 2032
- Table 8: United States Behavioral Biometrics Software Revenue (million) Forecast, by Application 2019 & 2032
- Table 9: Canada Behavioral Biometrics Software Revenue (million) Forecast, by Application 2019 & 2032
- Table 10: Mexico Behavioral Biometrics Software Revenue (million) Forecast, by Application 2019 & 2032
- Table 11: Global Behavioral Biometrics Software Revenue million Forecast, by Application 2019 & 2032
- Table 12: Global Behavioral Biometrics Software Revenue million Forecast, by Types 2019 & 2032
- Table 13: Global Behavioral Biometrics Software Revenue million Forecast, by Country 2019 & 2032
- Table 14: Brazil Behavioral Biometrics Software Revenue (million) Forecast, by Application 2019 & 2032
- Table 15: Argentina Behavioral Biometrics Software Revenue (million) Forecast, by Application 2019 & 2032
- Table 16: Rest of South America Behavioral Biometrics Software Revenue (million) Forecast, by Application 2019 & 2032
- Table 17: Global Behavioral Biometrics Software Revenue million Forecast, by Application 2019 & 2032
- Table 18: Global Behavioral Biometrics Software Revenue million Forecast, by Types 2019 & 2032
- Table 19: Global Behavioral Biometrics Software Revenue million Forecast, by Country 2019 & 2032
- Table 20: United Kingdom Behavioral Biometrics Software Revenue (million) Forecast, by Application 2019 & 2032
- Table 21: Germany Behavioral Biometrics Software Revenue (million) Forecast, by Application 2019 & 2032
- Table 22: France Behavioral Biometrics Software Revenue (million) Forecast, by Application 2019 & 2032
- Table 23: Italy Behavioral Biometrics Software Revenue (million) Forecast, by Application 2019 & 2032
- Table 24: Spain Behavioral Biometrics Software Revenue (million) Forecast, by Application 2019 & 2032
- Table 25: Russia Behavioral Biometrics Software Revenue (million) Forecast, by Application 2019 & 2032
- Table 26: Benelux Behavioral Biometrics Software Revenue (million) Forecast, by Application 2019 & 2032
- Table 27: Nordics Behavioral Biometrics Software Revenue (million) Forecast, by Application 2019 & 2032
- Table 28: Rest of Europe Behavioral Biometrics Software Revenue (million) Forecast, by Application 2019 & 2032
- Table 29: Global Behavioral Biometrics Software Revenue million Forecast, by Application 2019 & 2032
- Table 30: Global Behavioral Biometrics Software Revenue million Forecast, by Types 2019 & 2032
- Table 31: Global Behavioral Biometrics Software Revenue million Forecast, by Country 2019 & 2032
- Table 32: Turkey Behavioral Biometrics Software Revenue (million) Forecast, by Application 2019 & 2032
- Table 33: Israel Behavioral Biometrics Software Revenue (million) Forecast, by Application 2019 & 2032
- Table 34: GCC Behavioral Biometrics Software Revenue (million) Forecast, by Application 2019 & 2032
- Table 35: North Africa Behavioral Biometrics Software Revenue (million) Forecast, by Application 2019 & 2032
- Table 36: South Africa Behavioral Biometrics Software Revenue (million) Forecast, by Application 2019 & 2032
- Table 37: Rest of Middle East & Africa Behavioral Biometrics Software Revenue (million) Forecast, by Application 2019 & 2032
- Table 38: Global Behavioral Biometrics Software Revenue million Forecast, by Application 2019 & 2032
- Table 39: Global Behavioral Biometrics Software Revenue million Forecast, by Types 2019 & 2032
- Table 40: Global Behavioral Biometrics Software Revenue million Forecast, by Country 2019 & 2032
- Table 41: China Behavioral Biometrics Software Revenue (million) Forecast, by Application 2019 & 2032
- Table 42: India Behavioral Biometrics Software Revenue (million) Forecast, by Application 2019 & 2032
- Table 43: Japan Behavioral Biometrics Software Revenue (million) Forecast, by Application 2019 & 2032
- Table 44: South Korea Behavioral Biometrics Software Revenue (million) Forecast, by Application 2019 & 2032
- Table 45: ASEAN Behavioral Biometrics Software Revenue (million) Forecast, by Application 2019 & 2032
- Table 46: Oceania Behavioral Biometrics Software Revenue (million) Forecast, by Application 2019 & 2032
- Table 47: Rest of Asia Pacific Behavioral Biometrics Software Revenue (million) Forecast, by Application 2019 & 2032
Frequently Asked Questions
1. What is the projected Compound Annual Growth Rate (CAGR) of the Behavioral Biometrics Software?
The projected CAGR is approximately 8.5%.
2. Which companies are prominent players in the Behavioral Biometrics Software?
Key companies in the market include BioCatch, BehavioSec, NuData Security, TypingDNA, SecuredTouch, Zighra, Plurilock, UnifyID, SentiLink, GuardSquare, IBM, Frictionless Security.
3. What are the main segments of the Behavioral Biometrics Software?
The market segments include Application, Types.
4. Can you provide details about the market size?
The market size is estimated to be USD 2255 million as of 2022.
5. What are some drivers contributing to market growth?
N/A
6. What are the notable trends driving market growth?
N/A
7. Are there any restraints impacting market growth?
N/A
8. Can you provide examples of recent developments in the market?
N/A
9. What pricing options are available for accessing the report?
Pricing options include single-user, multi-user, and enterprise licenses priced at USD 4350.00, USD 6525.00, and USD 8700.00 respectively.
10. Is the market size provided in terms of value or volume?
The market size is provided in terms of value, measured in million.
11. Are there any specific market keywords associated with the report?
Yes, the market keyword associated with the report is "Behavioral Biometrics Software," which aids in identifying and referencing the specific market segment covered.
12. How do I determine which pricing option suits my needs best?
The pricing options vary based on user requirements and access needs. Individual users may opt for single-user licenses, while businesses requiring broader access may choose multi-user or enterprise licenses for cost-effective access to the report.
13. Are there any additional resources or data provided in the Behavioral Biometrics Software report?
While the report offers comprehensive insights, it's advisable to review the specific contents or supplementary materials provided to ascertain if additional resources or data are available.
14. How can I stay updated on further developments or reports in the Behavioral Biometrics Software?
To stay informed about further developments, trends, and reports in the Behavioral Biometrics Software, consider subscribing to industry newsletters, following relevant companies and organizations, or regularly checking reputable industry news sources and publications.
Methodology
Step 1 - Identification of Relevant Samples Size from Population Database


Step 2 - Approaches for Defining Global Market Size (Value, Volume* & Price*)

Note*: In applicable scenarios
Step 3 - Data Sources
Primary Research
- Web Analytics
- Survey Reports
- Research Institute
- Latest Research Reports
- Opinion Leaders
Secondary Research
- Annual Reports
- White Paper
- Latest Press Release
- Industry Association
- Paid Database
- Investor Presentations

Step 4 - Data Triangulation
Involves using different sources of information in order to increase the validity of a study
These sources are likely to be stakeholders in a program - participants, other researchers, program staff, other community members, and so on.
Then we put all data in single framework & apply various statistical tools to find out the dynamic on the market.
During the analysis stage, feedback from the stakeholder groups would be compared to determine areas of agreement as well as areas of divergence
