

Key Insights
The global biophotonics market, estimated at $76.1 billion in 2024, is projected for substantial growth, forecasting a compound annual growth rate (CAGR) of 11.3% from 2024 to 2033. This expansion is driven by advancements in imaging technologies, including surface, internal, and transmissive imaging, which enhance early and accurate disease diagnosis. The rising global burden of chronic diseases fuels demand for sophisticated biophotonic diagnostic and therapeutic solutions. Additionally, the integration of biosensors and medical lasers in minimally invasive procedures is a key market driver. Ongoing innovations in spectromolecular imaging and microscopy are improving the precision and efficiency of biophotonic applications. Despite challenges like regulatory complexities and high initial investments, the market outlook is optimistic, supported by continuous technological development and the critical need for precise, timely healthcare solutions.
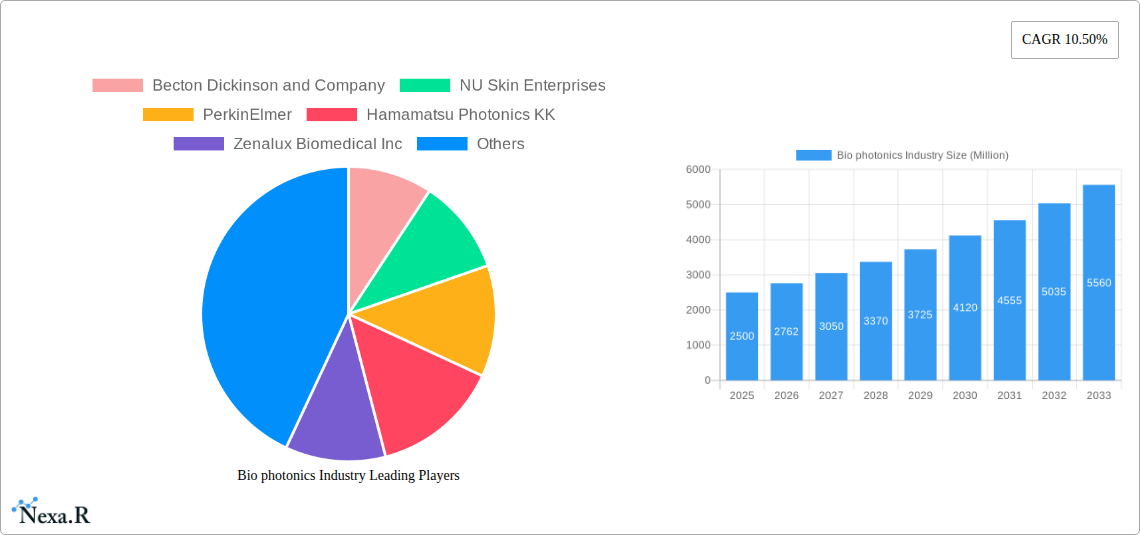
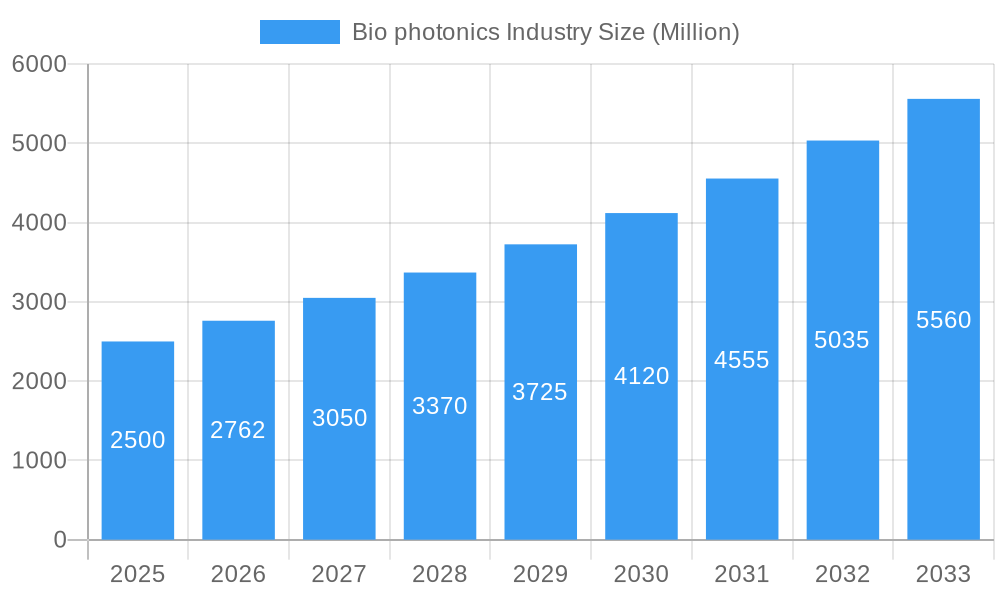
Bio photonics Industry Market Size (In Billion)
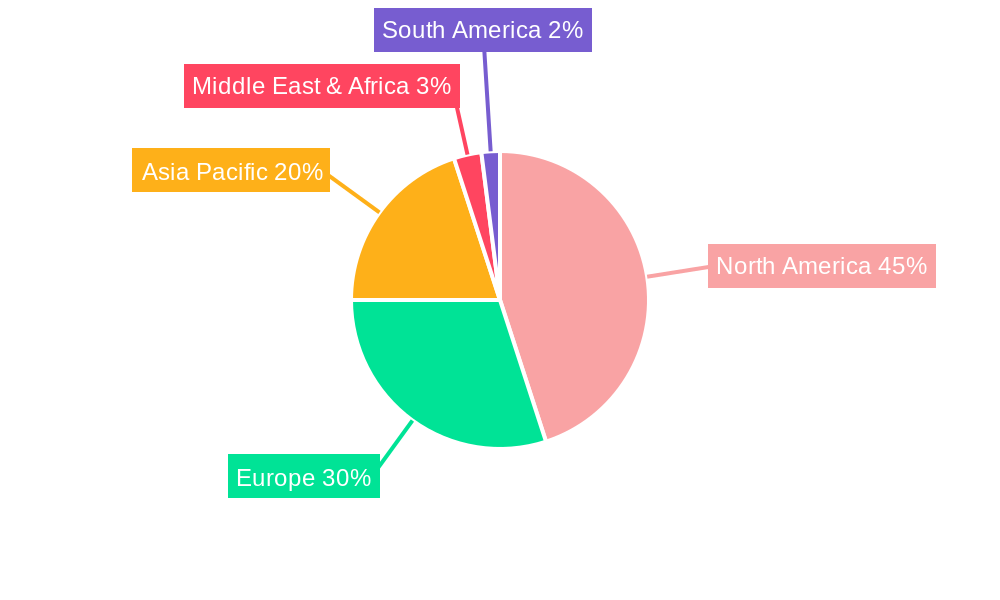
Market segmentation highlights the prominence of surface, internal, and transmissive imaging technologies, alongside microscopy and biosensors, which are vital for research and clinical applications. Geographically, North America and Europe lead the biophotonics market, attributed to robust healthcare infrastructure and significant R&D investment. The Asia-Pacific region is anticipated to witness accelerated growth, propelled by increasing healthcare expenditure and the adoption of advanced medical technologies in key economies. Major industry players, including Becton Dickinson, PerkinElmer, and Thermo Fisher Scientific, indicate a mature and innovative market. Continued R&D investment and strategic collaborations will be essential for competitive advantage in this dynamic sector.
Bio photonics Industry Company Market Share
Biophotonics Industry Market Report: 2019-2033
This comprehensive report provides a detailed analysis of the biophotonics industry, encompassing market dynamics, growth trends, regional segmentation, product landscape, key players, and future outlook. The study period covers 2019-2033, with 2025 as the base and estimated year. The report utilizes a robust methodology, incorporating both quantitative and qualitative data to deliver actionable insights for industry professionals, investors, and stakeholders. The market is segmented by technology (Surface Imaging, Inside Imaging, See-through Imaging, Microscopy, Biosensors, Medical Lasers, Spectromolecular, Other Technologies), providing a granular understanding of market dynamics across various segments. The total market size is projected to reach xx Million by 2033.
Biophotonics Industry Market Dynamics & Structure
The biophotonics market is characterized by moderate concentration, with several key players holding significant market share. Technological innovation, driven by advancements in lasers, detectors, and imaging techniques, is a primary growth driver. Stringent regulatory frameworks governing medical devices and diagnostics influence market dynamics. Competitive pressures exist from alternative diagnostic and therapeutic approaches. The end-user demographic includes research institutions, hospitals, pharmaceutical companies, and biotech firms. M&A activity has been moderate, with strategic acquisitions aimed at expanding technological capabilities and market reach.
- Market Concentration: Moderately concentrated, with the top 5 players holding approximately xx% market share in 2025.
- Technological Innovation: Significant advancements in laser technology, optical sensors, and image processing are driving market growth.
- Regulatory Framework: Stringent regulations, particularly for medical applications, pose both challenges and opportunities.
- Competitive Substitutes: Alternative diagnostic and therapeutic technologies create competitive pressure.
- End-User Demographics: Research institutions, hospitals, pharmaceutical and biotechnology companies are key end-users.
- M&A Trends: Moderate M&A activity focused on technological expansion and market penetration. An estimated xx M&A deals occurred between 2019 and 2024.
Biophotonics Industry Growth Trends & Insights
The biophotonics market experienced significant growth during the historical period (2019-2024), driven by increasing demand for advanced diagnostic and therapeutic tools and expanding applications in life sciences research. The market is projected to maintain a healthy CAGR of xx% during the forecast period (2025-2033), reaching an estimated market size of xx Million by 2033. Technological disruptions, such as the development of miniaturized devices and AI-powered image analysis, are accelerating market adoption. Shifting consumer preferences towards minimally invasive procedures and personalized medicine are further boosting growth. Market penetration is projected to increase from xx% in 2025 to xx% by 2033. Technological advancements in areas like microscopy and biosensors will contribute significantly to this growth.
Dominant Regions, Countries, or Segments in Biophotonics Industry
North America currently dominates the biophotonics market, driven by strong R&D investments, the presence of major players, and supportive regulatory frameworks. Europe follows as a significant market, with strong growth in specific segments like medical lasers and biosensors. Asia-Pacific is exhibiting the fastest growth rate, driven by increasing healthcare spending and technological advancements. Within the technology segments, Microscopy and Medical Lasers currently hold the largest market share, fueled by high demand for advanced imaging and therapeutic applications.
- North America: Strong R&D, presence of key players, and favorable regulatory environment contribute to market dominance.
- Europe: Significant market with strong growth in specific segments like medical lasers and biosensors.
- Asia-Pacific: Fastest-growing region, driven by increasing healthcare spending and technological advancements.
- Microscopy and Medical Lasers: Largest market segments, due to high demand for advanced imaging and therapeutic applications.
Biophotonics Industry Product Landscape
The biophotonics product landscape comprises a diverse range of technologies, including advanced microscopes, high-performance lasers, and sensitive biosensors. Product innovation focuses on miniaturization, increased sensitivity, improved resolution, and integrated functionalities. Key features driving sales include real-time imaging capabilities, high throughput analysis, and ease of use. Recent advancements in AI and machine learning are enhancing data analysis and image processing capabilities.
Key Drivers, Barriers & Challenges in Biophotonics Industry
Key Drivers:
- Rising prevalence of chronic diseases driving demand for advanced diagnostics and treatments.
- Increasing R&D investments in life sciences and biotechnology.
- Technological advancements in imaging, sensing, and laser technologies.
- Growing adoption of minimally invasive procedures.
Challenges & Restraints:
- High cost of equipment and consumables limiting accessibility.
- Stringent regulatory requirements for medical devices.
- Intense competition among established players and emerging startups.
- Potential supply chain disruptions affecting component availability. This resulted in a xx% increase in production costs in 2022.
Emerging Opportunities in Biophotonics Industry
- Expanding applications in personalized medicine, point-of-care diagnostics, and drug discovery.
- Growing demand for portable and handheld biophotonics devices for remote healthcare settings.
- Integration of AI and machine learning for enhanced image analysis and diagnostic capabilities.
- Development of novel imaging techniques for early disease detection and monitoring.
Growth Accelerators in the Biophotonics Industry
Technological breakthroughs, particularly in areas such as super-resolution microscopy and advanced laser sources, are crucial growth catalysts. Strategic partnerships between technology providers and healthcare institutions will accelerate market adoption. Expansion into new applications, such as environmental monitoring and industrial quality control, will broaden the market's scope and drive growth.
Key Players Shaping the Biophotonics Industry Market
- Becton Dickinson and Company
- NU Skin Enterprises
- PerkinElmer
- Hamamatsu Photonics KK
- Zenalux Biomedical Inc
- Glenbrook Technologies
- Oxford Instruments PLC
- Carl Zeiss AG
- Olympus Corporation
- Thermo Fisher Scientific
Notable Milestones in Biophotonics Industry Sector
- March 2021: Zeiss invested USD 180 million in a new North American R&D, production, sales, and customer service center, expanding its presence in the life sciences and materials research markets.
- November 2021: Oxford Instruments launched the BC43, a compact microscopy device enabling real-time 3D imaging.
In-Depth Biophotonics Industry Market Outlook
The biophotonics market is poised for continued strong growth, driven by technological advancements, increasing healthcare expenditure, and expanding applications across various sectors. Strategic partnerships, investments in R&D, and the development of innovative products will shape the future market landscape. The market presents significant opportunities for companies that can effectively leverage technological advancements and adapt to evolving healthcare needs. The integration of AI and big data will further drive innovation and growth in the coming years.
Bio photonics Industry Segmentation
-
1. Technology
- 1.1. Surface Imaging
- 1.2. Inside Imaging
- 1.3. See-through Imaging
- 1.4. Microscopy
- 1.5. Biosensors
- 1.6. Medical Lasers
- 1.7. Spectromolecular
- 1.8. Other Technologies
-
2. Application
- 2.1. Medical Diagnostics
- 2.2. Drug Discovery
- 2.3. Medical Research
- 2.4. Biotechnology
- 2.5. Environmental Monitoring
Bio photonics Industry Segmentation By Geography
-
1. North America
- 1.1. United States
- 1.2. Canada
- 1.3. Mexico
-
2. Europe
- 2.1. Germany
- 2.2. United Kingdom
- 2.3. France
- 2.4. Italy
- 2.5. Spain
- 2.6. Rest of Europe
-
3. Asia Pacific
- 3.1. China
- 3.2. Japan
- 3.3. India
- 3.4. Australia
- 3.5. South Korea
- 3.6. Rest of Asia Pacific
-
4. Middle East and Africa
- 4.1. GCC
- 4.2. South Africa
- 4.3. Rest of Middle East and Africa
-
5. South America
- 5.1. Brazil
- 5.2. Argentina
- 5.3. Rest of South America
Bio photonics Industry Regional Market Share
Geographic Coverage of Bio photonics Industry
Bio photonics Industry REPORT HIGHLIGHTS
| Aspects | Details |
|---|---|
| Study Period | 2020-2034 |
| Base Year | 2025 |
| Estimated Year | 2026 |
| Forecast Period | 2026-2034 |
| Historical Period | 2020-2025 |
| Growth Rate | CAGR of 11.3% from 2020-2034 |
| Segmentation |
|
Table of Contents
- 1. Introduction
- 1.1. Research Scope
- 1.2. Market Segmentation
- 1.3. Research Objective
- 1.4. Definitions and Assumptions
- 2. Executive Summary
- 2.1. Market Snapshot
- 3. Market Dynamics
- 3.1. Market Drivers
- 3.2. Market Restrains
- 3.3. Market Trends
- 3.4. Market Opportunities
- 4. Market Factor Analysis
- 4.1. Porters Five Forces
- 4.1.1. Bargaining Power of Suppliers
- 4.1.2. Bargaining Power of Buyers
- 4.1.3. Threat of New Entrants
- 4.1.4. Threat of Substitutes
- 4.1.5. Competitive Rivalry
- 4.2. PESTEL analysis
- 4.3. BCG Analysis
- 4.3.1. Stars (High Growth, High Market Share)
- 4.3.2. Cash Cows (Low Growth, High Market Share)
- 4.3.3. Question Mark (High Growth, Low Market Share)
- 4.3.4. Dogs (Low Growth, Low Market Share)
- 4.4. Ansoff Matrix Analysis
- 4.5. Supply Chain Analysis
- 4.6. Regulatory Landscape
- 4.7. Current Market Potential and Opportunity Assessment (TAM–SAM–SOM Framework)
- 4.8. NRP Analyst Note
- 4.1. Porters Five Forces
- 5. Market Analysis, Insights and Forecast 2021-2033
- 5.1. Market Analysis, Insights and Forecast - by Technology
- 5.1.1. Surface Imaging
- 5.1.2. Inside Imaging
- 5.1.3. See-through Imaging
- 5.1.4. Microscopy
- 5.1.5. Biosensors
- 5.1.6. Medical Lasers
- 5.1.7. Spectromolecular
- 5.1.8. Other Technologies
- 5.2. Market Analysis, Insights and Forecast - by Application
- 5.2.1. Medical Diagnostics
- 5.2.2. Drug Discovery
- 5.2.3. Medical Research
- 5.2.4. Biotechnology
- 5.2.5. Environmental Monitoring
- 5.3. Market Analysis, Insights and Forecast - by Region
- 5.3.1. North America
- 5.3.2. Europe
- 5.3.3. Asia Pacific
- 5.3.4. Middle East and Africa
- 5.3.5. South America
- 5.1. Market Analysis, Insights and Forecast - by Technology
- 6. Global Bio photonics Industry Analysis, Insights and Forecast, 2021-2033
- 6.1. Market Analysis, Insights and Forecast - by Technology
- 6.1.1. Surface Imaging
- 6.1.2. Inside Imaging
- 6.1.3. See-through Imaging
- 6.1.4. Microscopy
- 6.1.5. Biosensors
- 6.1.6. Medical Lasers
- 6.1.7. Spectromolecular
- 6.1.8. Other Technologies
- 6.2. Market Analysis, Insights and Forecast - by Application
- 6.2.1. Medical Diagnostics
- 6.2.2. Drug Discovery
- 6.2.3. Medical Research
- 6.2.4. Biotechnology
- 6.2.5. Environmental Monitoring
- 6.1. Market Analysis, Insights and Forecast - by Technology
- 7. North America Bio photonics Industry Analysis, Insights and Forecast, 2020-2032
- 7.1. Market Analysis, Insights and Forecast - by Technology
- 7.1.1. Surface Imaging
- 7.1.2. Inside Imaging
- 7.1.3. See-through Imaging
- 7.1.4. Microscopy
- 7.1.5. Biosensors
- 7.1.6. Medical Lasers
- 7.1.7. Spectromolecular
- 7.1.8. Other Technologies
- 7.2. Market Analysis, Insights and Forecast - by Application
- 7.2.1. Medical Diagnostics
- 7.2.2. Drug Discovery
- 7.2.3. Medical Research
- 7.2.4. Biotechnology
- 7.2.5. Environmental Monitoring
- 7.1. Market Analysis, Insights and Forecast - by Technology
- 8. Europe Bio photonics Industry Analysis, Insights and Forecast, 2020-2032
- 8.1. Market Analysis, Insights and Forecast - by Technology
- 8.1.1. Surface Imaging
- 8.1.2. Inside Imaging
- 8.1.3. See-through Imaging
- 8.1.4. Microscopy
- 8.1.5. Biosensors
- 8.1.6. Medical Lasers
- 8.1.7. Spectromolecular
- 8.1.8. Other Technologies
- 8.2. Market Analysis, Insights and Forecast - by Application
- 8.2.1. Medical Diagnostics
- 8.2.2. Drug Discovery
- 8.2.3. Medical Research
- 8.2.4. Biotechnology
- 8.2.5. Environmental Monitoring
- 8.1. Market Analysis, Insights and Forecast - by Technology
- 9. Asia Pacific Bio photonics Industry Analysis, Insights and Forecast, 2020-2032
- 9.1. Market Analysis, Insights and Forecast - by Technology
- 9.1.1. Surface Imaging
- 9.1.2. Inside Imaging
- 9.1.3. See-through Imaging
- 9.1.4. Microscopy
- 9.1.5. Biosensors
- 9.1.6. Medical Lasers
- 9.1.7. Spectromolecular
- 9.1.8. Other Technologies
- 9.2. Market Analysis, Insights and Forecast - by Application
- 9.2.1. Medical Diagnostics
- 9.2.2. Drug Discovery
- 9.2.3. Medical Research
- 9.2.4. Biotechnology
- 9.2.5. Environmental Monitoring
- 9.1. Market Analysis, Insights and Forecast - by Technology
- 10. Middle East and Africa Bio photonics Industry Analysis, Insights and Forecast, 2020-2032
- 10.1. Market Analysis, Insights and Forecast - by Technology
- 10.1.1. Surface Imaging
- 10.1.2. Inside Imaging
- 10.1.3. See-through Imaging
- 10.1.4. Microscopy
- 10.1.5. Biosensors
- 10.1.6. Medical Lasers
- 10.1.7. Spectromolecular
- 10.1.8. Other Technologies
- 10.2. Market Analysis, Insights and Forecast - by Application
- 10.2.1. Medical Diagnostics
- 10.2.2. Drug Discovery
- 10.2.3. Medical Research
- 10.2.4. Biotechnology
- 10.2.5. Environmental Monitoring
- 10.1. Market Analysis, Insights and Forecast - by Technology
- 11. South America Bio photonics Industry Analysis, Insights and Forecast, 2020-2032
- 11.1. Market Analysis, Insights and Forecast - by Technology
- 11.1.1. Surface Imaging
- 11.1.2. Inside Imaging
- 11.1.3. See-through Imaging
- 11.1.4. Microscopy
- 11.1.5. Biosensors
- 11.1.6. Medical Lasers
- 11.1.7. Spectromolecular
- 11.1.8. Other Technologies
- 11.2. Market Analysis, Insights and Forecast - by Application
- 11.2.1. Medical Diagnostics
- 11.2.2. Drug Discovery
- 11.2.3. Medical Research
- 11.2.4. Biotechnology
- 11.2.5. Environmental Monitoring
- 11.1. Market Analysis, Insights and Forecast - by Technology
- 12. Competitive Analysis
- 12.1. Company Profiles
- 12.1.1 Becton Dickinson and Company
- 12.1.1.1. Company Overview
- 12.1.1.2. Products
- 12.1.1.3. Company Financials
- 12.1.1.4. SWOT Analysis
- 12.1.2 NU Skin Enterprises
- 12.1.2.1. Company Overview
- 12.1.2.2. Products
- 12.1.2.3. Company Financials
- 12.1.2.4. SWOT Analysis
- 12.1.3 PerkinElmer
- 12.1.3.1. Company Overview
- 12.1.3.2. Products
- 12.1.3.3. Company Financials
- 12.1.3.4. SWOT Analysis
- 12.1.4 Hamamatsu Photonics KK
- 12.1.4.1. Company Overview
- 12.1.4.2. Products
- 12.1.4.3. Company Financials
- 12.1.4.4. SWOT Analysis
- 12.1.5 Zenalux Biomedical Inc
- 12.1.5.1. Company Overview
- 12.1.5.2. Products
- 12.1.5.3. Company Financials
- 12.1.5.4. SWOT Analysis
- 12.1.6 Glenbrook Technologies
- 12.1.6.1. Company Overview
- 12.1.6.2. Products
- 12.1.6.3. Company Financials
- 12.1.6.4. SWOT Analysis
- 12.1.7 Oxford Instruments PLC
- 12.1.7.1. Company Overview
- 12.1.7.2. Products
- 12.1.7.3. Company Financials
- 12.1.7.4. SWOT Analysis
- 12.1.8 Carl Zeiss AG
- 12.1.8.1. Company Overview
- 12.1.8.2. Products
- 12.1.8.3. Company Financials
- 12.1.8.4. SWOT Analysis
- 12.1.9 Olympus Corporation
- 12.1.9.1. Company Overview
- 12.1.9.2. Products
- 12.1.9.3. Company Financials
- 12.1.9.4. SWOT Analysis
- 12.1.10 Thermo Fisher Scientific
- 12.1.10.1. Company Overview
- 12.1.10.2. Products
- 12.1.10.3. Company Financials
- 12.1.10.4. SWOT Analysis
- 12.1.1 Becton Dickinson and Company
- 12.2. Market Entropy
- 12.2.1 Company's Key Areas Served
- 12.2.2 Recent Developments
- 12.3. Company Market Share Analysis 2025
- 12.3.1 Top 5 Companies Market Share Analysis
- 12.3.2 Top 3 Companies Market Share Analysis
- 12.4. List of Potential Customers
- 13. Research Methodology
List of Figures
- Figure 1: Global Bio photonics Industry Revenue Breakdown (billion, %) by Region 2025 & 2033
- Figure 2: Global Bio photonics Industry Volume Breakdown (K Unit, %) by Region 2025 & 2033
- Figure 3: North America Bio photonics Industry Revenue (billion), by Technology 2025 & 2033
- Figure 4: North America Bio photonics Industry Volume (K Unit), by Technology 2025 & 2033
- Figure 5: North America Bio photonics Industry Revenue Share (%), by Technology 2025 & 2033
- Figure 6: North America Bio photonics Industry Volume Share (%), by Technology 2025 & 2033
- Figure 7: North America Bio photonics Industry Revenue (billion), by Application 2025 & 2033
- Figure 8: North America Bio photonics Industry Volume (K Unit), by Application 2025 & 2033
- Figure 9: North America Bio photonics Industry Revenue Share (%), by Application 2025 & 2033
- Figure 10: North America Bio photonics Industry Volume Share (%), by Application 2025 & 2033
- Figure 11: North America Bio photonics Industry Revenue (billion), by Country 2025 & 2033
- Figure 12: North America Bio photonics Industry Volume (K Unit), by Country 2025 & 2033
- Figure 13: North America Bio photonics Industry Revenue Share (%), by Country 2025 & 2033
- Figure 14: North America Bio photonics Industry Volume Share (%), by Country 2025 & 2033
- Figure 15: Europe Bio photonics Industry Revenue (billion), by Technology 2025 & 2033
- Figure 16: Europe Bio photonics Industry Volume (K Unit), by Technology 2025 & 2033
- Figure 17: Europe Bio photonics Industry Revenue Share (%), by Technology 2025 & 2033
- Figure 18: Europe Bio photonics Industry Volume Share (%), by Technology 2025 & 2033
- Figure 19: Europe Bio photonics Industry Revenue (billion), by Application 2025 & 2033
- Figure 20: Europe Bio photonics Industry Volume (K Unit), by Application 2025 & 2033
- Figure 21: Europe Bio photonics Industry Revenue Share (%), by Application 2025 & 2033
- Figure 22: Europe Bio photonics Industry Volume Share (%), by Application 2025 & 2033
- Figure 23: Europe Bio photonics Industry Revenue (billion), by Country 2025 & 2033
- Figure 24: Europe Bio photonics Industry Volume (K Unit), by Country 2025 & 2033
- Figure 25: Europe Bio photonics Industry Revenue Share (%), by Country 2025 & 2033
- Figure 26: Europe Bio photonics Industry Volume Share (%), by Country 2025 & 2033
- Figure 27: Asia Pacific Bio photonics Industry Revenue (billion), by Technology 2025 & 2033
- Figure 28: Asia Pacific Bio photonics Industry Volume (K Unit), by Technology 2025 & 2033
- Figure 29: Asia Pacific Bio photonics Industry Revenue Share (%), by Technology 2025 & 2033
- Figure 30: Asia Pacific Bio photonics Industry Volume Share (%), by Technology 2025 & 2033
- Figure 31: Asia Pacific Bio photonics Industry Revenue (billion), by Application 2025 & 2033
- Figure 32: Asia Pacific Bio photonics Industry Volume (K Unit), by Application 2025 & 2033
- Figure 33: Asia Pacific Bio photonics Industry Revenue Share (%), by Application 2025 & 2033
- Figure 34: Asia Pacific Bio photonics Industry Volume Share (%), by Application 2025 & 2033
- Figure 35: Asia Pacific Bio photonics Industry Revenue (billion), by Country 2025 & 2033
- Figure 36: Asia Pacific Bio photonics Industry Volume (K Unit), by Country 2025 & 2033
- Figure 37: Asia Pacific Bio photonics Industry Revenue Share (%), by Country 2025 & 2033
- Figure 38: Asia Pacific Bio photonics Industry Volume Share (%), by Country 2025 & 2033
- Figure 39: Middle East and Africa Bio photonics Industry Revenue (billion), by Technology 2025 & 2033
- Figure 40: Middle East and Africa Bio photonics Industry Volume (K Unit), by Technology 2025 & 2033
- Figure 41: Middle East and Africa Bio photonics Industry Revenue Share (%), by Technology 2025 & 2033
- Figure 42: Middle East and Africa Bio photonics Industry Volume Share (%), by Technology 2025 & 2033
- Figure 43: Middle East and Africa Bio photonics Industry Revenue (billion), by Application 2025 & 2033
- Figure 44: Middle East and Africa Bio photonics Industry Volume (K Unit), by Application 2025 & 2033
- Figure 45: Middle East and Africa Bio photonics Industry Revenue Share (%), by Application 2025 & 2033
- Figure 46: Middle East and Africa Bio photonics Industry Volume Share (%), by Application 2025 & 2033
- Figure 47: Middle East and Africa Bio photonics Industry Revenue (billion), by Country 2025 & 2033
- Figure 48: Middle East and Africa Bio photonics Industry Volume (K Unit), by Country 2025 & 2033
- Figure 49: Middle East and Africa Bio photonics Industry Revenue Share (%), by Country 2025 & 2033
- Figure 50: Middle East and Africa Bio photonics Industry Volume Share (%), by Country 2025 & 2033
- Figure 51: South America Bio photonics Industry Revenue (billion), by Technology 2025 & 2033
- Figure 52: South America Bio photonics Industry Volume (K Unit), by Technology 2025 & 2033
- Figure 53: South America Bio photonics Industry Revenue Share (%), by Technology 2025 & 2033
- Figure 54: South America Bio photonics Industry Volume Share (%), by Technology 2025 & 2033
- Figure 55: South America Bio photonics Industry Revenue (billion), by Application 2025 & 2033
- Figure 56: South America Bio photonics Industry Volume (K Unit), by Application 2025 & 2033
- Figure 57: South America Bio photonics Industry Revenue Share (%), by Application 2025 & 2033
- Figure 58: South America Bio photonics Industry Volume Share (%), by Application 2025 & 2033
- Figure 59: South America Bio photonics Industry Revenue (billion), by Country 2025 & 2033
- Figure 60: South America Bio photonics Industry Volume (K Unit), by Country 2025 & 2033
- Figure 61: South America Bio photonics Industry Revenue Share (%), by Country 2025 & 2033
- Figure 62: South America Bio photonics Industry Volume Share (%), by Country 2025 & 2033
List of Tables
- Table 1: Global Bio photonics Industry Revenue billion Forecast, by Technology 2020 & 2033
- Table 2: Global Bio photonics Industry Volume K Unit Forecast, by Technology 2020 & 2033
- Table 3: Global Bio photonics Industry Revenue billion Forecast, by Application 2020 & 2033
- Table 4: Global Bio photonics Industry Volume K Unit Forecast, by Application 2020 & 2033
- Table 5: Global Bio photonics Industry Revenue billion Forecast, by Region 2020 & 2033
- Table 6: Global Bio photonics Industry Volume K Unit Forecast, by Region 2020 & 2033
- Table 7: Global Bio photonics Industry Revenue billion Forecast, by Technology 2020 & 2033
- Table 8: Global Bio photonics Industry Volume K Unit Forecast, by Technology 2020 & 2033
- Table 9: Global Bio photonics Industry Revenue billion Forecast, by Application 2020 & 2033
- Table 10: Global Bio photonics Industry Volume K Unit Forecast, by Application 2020 & 2033
- Table 11: Global Bio photonics Industry Revenue billion Forecast, by Country 2020 & 2033
- Table 12: Global Bio photonics Industry Volume K Unit Forecast, by Country 2020 & 2033
- Table 13: United States Bio photonics Industry Revenue (billion) Forecast, by Application 2020 & 2033
- Table 14: United States Bio photonics Industry Volume (K Unit) Forecast, by Application 2020 & 2033
- Table 15: Canada Bio photonics Industry Revenue (billion) Forecast, by Application 2020 & 2033
- Table 16: Canada Bio photonics Industry Volume (K Unit) Forecast, by Application 2020 & 2033
- Table 17: Mexico Bio photonics Industry Revenue (billion) Forecast, by Application 2020 & 2033
- Table 18: Mexico Bio photonics Industry Volume (K Unit) Forecast, by Application 2020 & 2033
- Table 19: Global Bio photonics Industry Revenue billion Forecast, by Technology 2020 & 2033
- Table 20: Global Bio photonics Industry Volume K Unit Forecast, by Technology 2020 & 2033
- Table 21: Global Bio photonics Industry Revenue billion Forecast, by Application 2020 & 2033
- Table 22: Global Bio photonics Industry Volume K Unit Forecast, by Application 2020 & 2033
- Table 23: Global Bio photonics Industry Revenue billion Forecast, by Country 2020 & 2033
- Table 24: Global Bio photonics Industry Volume K Unit Forecast, by Country 2020 & 2033
- Table 25: Germany Bio photonics Industry Revenue (billion) Forecast, by Application 2020 & 2033
- Table 26: Germany Bio photonics Industry Volume (K Unit) Forecast, by Application 2020 & 2033
- Table 27: United Kingdom Bio photonics Industry Revenue (billion) Forecast, by Application 2020 & 2033
- Table 28: United Kingdom Bio photonics Industry Volume (K Unit) Forecast, by Application 2020 & 2033
- Table 29: France Bio photonics Industry Revenue (billion) Forecast, by Application 2020 & 2033
- Table 30: France Bio photonics Industry Volume (K Unit) Forecast, by Application 2020 & 2033
- Table 31: Italy Bio photonics Industry Revenue (billion) Forecast, by Application 2020 & 2033
- Table 32: Italy Bio photonics Industry Volume (K Unit) Forecast, by Application 2020 & 2033
- Table 33: Spain Bio photonics Industry Revenue (billion) Forecast, by Application 2020 & 2033
- Table 34: Spain Bio photonics Industry Volume (K Unit) Forecast, by Application 2020 & 2033
- Table 35: Rest of Europe Bio photonics Industry Revenue (billion) Forecast, by Application 2020 & 2033
- Table 36: Rest of Europe Bio photonics Industry Volume (K Unit) Forecast, by Application 2020 & 2033
- Table 37: Global Bio photonics Industry Revenue billion Forecast, by Technology 2020 & 2033
- Table 38: Global Bio photonics Industry Volume K Unit Forecast, by Technology 2020 & 2033
- Table 39: Global Bio photonics Industry Revenue billion Forecast, by Application 2020 & 2033
- Table 40: Global Bio photonics Industry Volume K Unit Forecast, by Application 2020 & 2033
- Table 41: Global Bio photonics Industry Revenue billion Forecast, by Country 2020 & 2033
- Table 42: Global Bio photonics Industry Volume K Unit Forecast, by Country 2020 & 2033
- Table 43: China Bio photonics Industry Revenue (billion) Forecast, by Application 2020 & 2033
- Table 44: China Bio photonics Industry Volume (K Unit) Forecast, by Application 2020 & 2033
- Table 45: Japan Bio photonics Industry Revenue (billion) Forecast, by Application 2020 & 2033
- Table 46: Japan Bio photonics Industry Volume (K Unit) Forecast, by Application 2020 & 2033
- Table 47: India Bio photonics Industry Revenue (billion) Forecast, by Application 2020 & 2033
- Table 48: India Bio photonics Industry Volume (K Unit) Forecast, by Application 2020 & 2033
- Table 49: Australia Bio photonics Industry Revenue (billion) Forecast, by Application 2020 & 2033
- Table 50: Australia Bio photonics Industry Volume (K Unit) Forecast, by Application 2020 & 2033
- Table 51: South Korea Bio photonics Industry Revenue (billion) Forecast, by Application 2020 & 2033
- Table 52: South Korea Bio photonics Industry Volume (K Unit) Forecast, by Application 2020 & 2033
- Table 53: Rest of Asia Pacific Bio photonics Industry Revenue (billion) Forecast, by Application 2020 & 2033
- Table 54: Rest of Asia Pacific Bio photonics Industry Volume (K Unit) Forecast, by Application 2020 & 2033
- Table 55: Global Bio photonics Industry Revenue billion Forecast, by Technology 2020 & 2033
- Table 56: Global Bio photonics Industry Volume K Unit Forecast, by Technology 2020 & 2033
- Table 57: Global Bio photonics Industry Revenue billion Forecast, by Application 2020 & 2033
- Table 58: Global Bio photonics Industry Volume K Unit Forecast, by Application 2020 & 2033
- Table 59: Global Bio photonics Industry Revenue billion Forecast, by Country 2020 & 2033
- Table 60: Global Bio photonics Industry Volume K Unit Forecast, by Country 2020 & 2033
- Table 61: GCC Bio photonics Industry Revenue (billion) Forecast, by Application 2020 & 2033
- Table 62: GCC Bio photonics Industry Volume (K Unit) Forecast, by Application 2020 & 2033
- Table 63: South Africa Bio photonics Industry Revenue (billion) Forecast, by Application 2020 & 2033
- Table 64: South Africa Bio photonics Industry Volume (K Unit) Forecast, by Application 2020 & 2033
- Table 65: Rest of Middle East and Africa Bio photonics Industry Revenue (billion) Forecast, by Application 2020 & 2033
- Table 66: Rest of Middle East and Africa Bio photonics Industry Volume (K Unit) Forecast, by Application 2020 & 2033
- Table 67: Global Bio photonics Industry Revenue billion Forecast, by Technology 2020 & 2033
- Table 68: Global Bio photonics Industry Volume K Unit Forecast, by Technology 2020 & 2033
- Table 69: Global Bio photonics Industry Revenue billion Forecast, by Application 2020 & 2033
- Table 70: Global Bio photonics Industry Volume K Unit Forecast, by Application 2020 & 2033
- Table 71: Global Bio photonics Industry Revenue billion Forecast, by Country 2020 & 2033
- Table 72: Global Bio photonics Industry Volume K Unit Forecast, by Country 2020 & 2033
- Table 73: Brazil Bio photonics Industry Revenue (billion) Forecast, by Application 2020 & 2033
- Table 74: Brazil Bio photonics Industry Volume (K Unit) Forecast, by Application 2020 & 2033
- Table 75: Argentina Bio photonics Industry Revenue (billion) Forecast, by Application 2020 & 2033
- Table 76: Argentina Bio photonics Industry Volume (K Unit) Forecast, by Application 2020 & 2033
- Table 77: Rest of South America Bio photonics Industry Revenue (billion) Forecast, by Application 2020 & 2033
- Table 78: Rest of South America Bio photonics Industry Volume (K Unit) Forecast, by Application 2020 & 2033
Frequently Asked Questions
1. What is the projected Compound Annual Growth Rate (CAGR) of the Bio photonics Industry?
The projected CAGR is approximately 11.3%.
2. Which companies are prominent players in the Bio photonics Industry?
Key companies in the market include Becton Dickinson and Company, NU Skin Enterprises, PerkinElmer, Hamamatsu Photonics KK, Zenalux Biomedical Inc, Glenbrook Technologies, Oxford Instruments PLC, Carl Zeiss AG, Olympus Corporation, Thermo Fisher Scientific.
3. What are the main segments of the Bio photonics Industry?
The market segments include Technology, Application.
4. Can you provide details about the market size?
The market size is estimated to be USD 76.1 billion as of 2022.
5. What are some drivers contributing to market growth?
Growing Geriatric Population; Increasing Use of Biophotonics in Cell and Tissue Diagnostics; Emergence of Nanotechnology in Biophotonics; Development of Novel Photoacoustic Tomography (PAT) System.
6. What are the notable trends driving market growth?
Inside Imaging (Endoscopy) Segment is Expected to Witness Growth Over the Forecast Period.
7. Are there any restraints impacting market growth?
Lack of Awareness of Biophotonics Technology and Skilled Personnel; High Cost of Technology.
8. Can you provide examples of recent developments in the market?
In March 2021, Zeiss expanded its presence in North America by launching new research and development, production, sales, and customer service center in the United States with an investment of USD 180 million. The new site will incorporate the X-ray Microscopy business, along with the ZEISS Microscopy Customer Center, to provide support for the opportunities in materials research, life sciences, and industrial applications.
9. What pricing options are available for accessing the report?
Pricing options include single-user, multi-user, and enterprise licenses priced at USD 4750, USD 5250, and USD 8750 respectively.
10. Is the market size provided in terms of value or volume?
The market size is provided in terms of value, measured in billion and volume, measured in K Unit.
11. Are there any specific market keywords associated with the report?
Yes, the market keyword associated with the report is "Bio photonics Industry," which aids in identifying and referencing the specific market segment covered.
12. How do I determine which pricing option suits my needs best?
The pricing options vary based on user requirements and access needs. Individual users may opt for single-user licenses, while businesses requiring broader access may choose multi-user or enterprise licenses for cost-effective access to the report.
13. Are there any additional resources or data provided in the Bio photonics Industry report?
While the report offers comprehensive insights, it's advisable to review the specific contents or supplementary materials provided to ascertain if additional resources or data are available.
14. How can I stay updated on further developments or reports in the Bio photonics Industry?
To stay informed about further developments, trends, and reports in the Bio photonics Industry, consider subscribing to industry newsletters, following relevant companies and organizations, or regularly checking reputable industry news sources and publications.
Methodology
Step 1 - Identification of Relevant Samples Size from Population Database


Step 2 - Approaches for Defining Global Market Size (Value, Volume* & Price*)

Note*: In applicable scenarios
Step 3 - Data Sources
Primary Research
- Web Analytics
- Survey Reports
- Research Institute
- Latest Research Reports
- Opinion Leaders
Secondary Research
- Annual Reports
- White Paper
- Latest Press Release
- Industry Association
- Paid Database
- Investor Presentations

Step 4 - Data Triangulation
Involves using different sources of information in order to increase the validity of a study
These sources are likely to be stakeholders in a program - participants, other researchers, program staff, other community members, and so on.
Then we put all data in single framework & apply various statistical tools to find out the dynamic on the market.
During the analysis stage, feedback from the stakeholder groups would be compared to determine areas of agreement as well as areas of divergence