

Key Insights
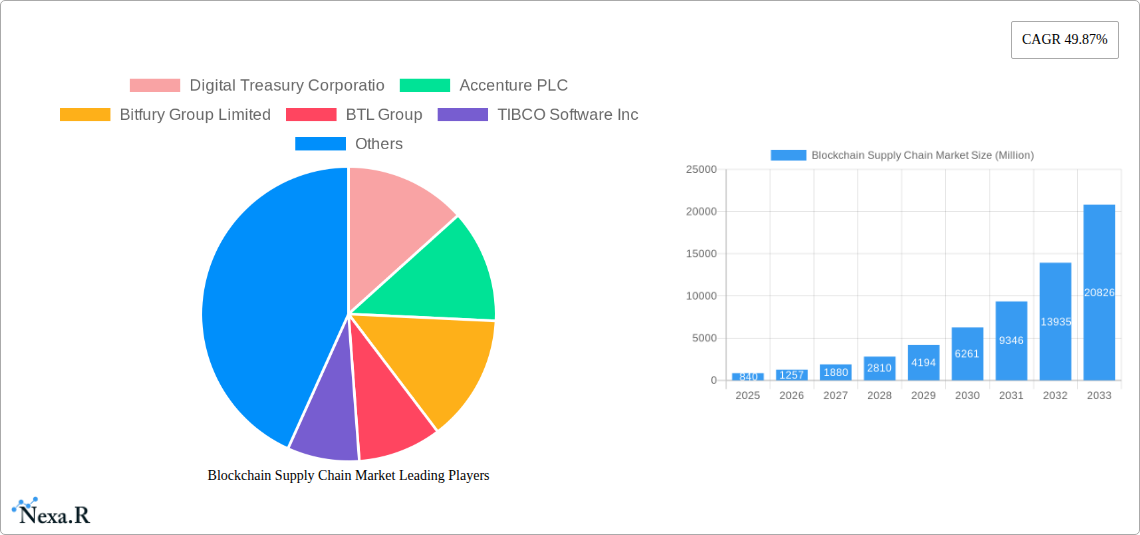
The Blockchain Supply Chain market is experiencing explosive growth, projected to reach $0.84 billion in 2025 and exhibiting a remarkable Compound Annual Growth Rate (CAGR) of 49.87%. This surge is driven by several key factors. Increased concerns over supply chain transparency and security, coupled with the rising incidence of counterfeiting and product recalls, are compelling businesses across various sectors to adopt blockchain technology. The ability of blockchain to enhance traceability, improve efficiency, and reduce operational costs is a major catalyst for adoption. Specifically, the Payment & Settlement and Product Traceability applications are leading the charge, witnessing high demand across Retail & Consumer Goods, Healthcare & Life Sciences, and Manufacturing verticals. The market's segmentation reflects its broad applicability; platform and service offerings cater to diverse needs, while industry verticals highlight the widespread adoption across various sectors. Leading players like IBM, Microsoft, and Amazon Web Services are actively investing in and developing blockchain-based supply chain solutions, further fueling market expansion.
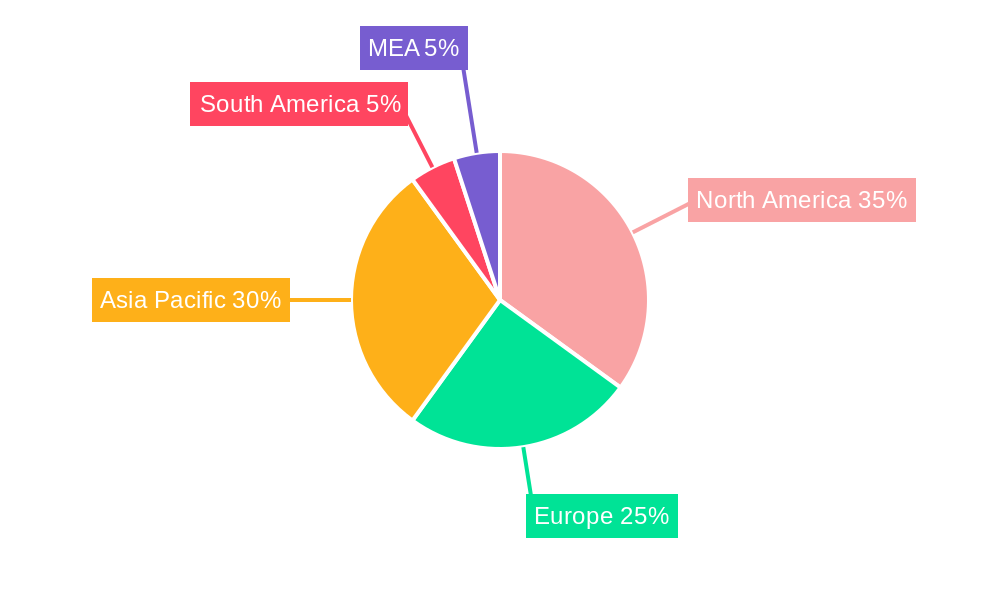
Looking ahead, the forecast period (2025-2033) promises continued strong growth. Factors such as increasing regulatory support for blockchain technology, the growing adoption of Internet of Things (IoT) devices for data integration within supply chains, and the maturation of blockchain platforms will all contribute to this expansion. However, challenges remain. High implementation costs, the complexity of integrating blockchain into existing systems, and a lack of standardization across different blockchain platforms could potentially hinder wider adoption. Nevertheless, the inherent benefits of enhanced security, transparency, and efficiency are likely to outweigh these challenges, ensuring the continued growth of the Blockchain Supply Chain market throughout the forecast period. The market's expansion is expected to be geographically diverse, with North America and Asia Pacific likely to remain leading regions due to early adoption and robust technological infrastructure.
Blockchain Supply Chain Market: A Comprehensive Report (2019-2033)
This comprehensive report provides an in-depth analysis of the Blockchain Supply Chain Market, encompassing market dynamics, growth trends, regional dominance, product landscapes, key players, and future outlooks. The study period covers 2019-2033, with 2025 as the base and estimated year. The report segments the market by component (Platform, Services), application (Payment & Settlement, Product Traceability, Counterfeit Detection, Smart Contracts, Risk & Compliance Management, Other Applications), and industry vertical (Retail & Consumer Goods, Healthcare & Life Sciences, Manufacturing, Logistics, Oil & Gas, Other Industry Verticals). The market is projected to reach xx Million by 2033, exhibiting a CAGR of xx% during the forecast period (2025-2033).
Blockchain Supply Chain Market Dynamics & Structure
The Blockchain Supply Chain Market exhibits a moderately concentrated structure, with key players like IBM, Microsoft, and SAP holding significant market share. However, the market is also characterized by a high degree of innovation, with new entrants and technological advancements constantly shaping the competitive landscape. Regulatory frameworks, while still evolving, are playing an increasingly crucial role in shaping market adoption.
- Market Concentration: The top 5 players currently hold approximately xx% of the market share in 2025. This is expected to slightly decrease to xx% by 2033 due to increased competition.
- Technological Innovation: The integration of AI, IoT, and advanced analytics with blockchain technology is driving significant innovation, leading to more efficient and secure supply chain solutions.
- Regulatory Frameworks: Governments worldwide are increasingly focusing on data privacy and security regulations, impacting blockchain adoption and implementation strategies. The increasing clarity around regulatory frameworks is a key driver for market growth.
- Competitive Product Substitutes: Traditional supply chain management systems pose a significant competitive threat, although blockchain solutions offer advantages in terms of security, transparency, and efficiency.
- End-User Demographics: Adoption is primarily driven by large enterprises across various sectors due to the higher upfront investment costs. However, increasing affordability and SaaS-based solutions are enabling smaller businesses to adopt the technology.
- M&A Trends: The past five years have witnessed xx M&A deals in the Blockchain Supply Chain Market, indicating a consolidated market with significant potential for future acquisitions. These deals primarily focused on strengthening technological capabilities and market reach.
Blockchain Supply Chain Market Growth Trends & Insights
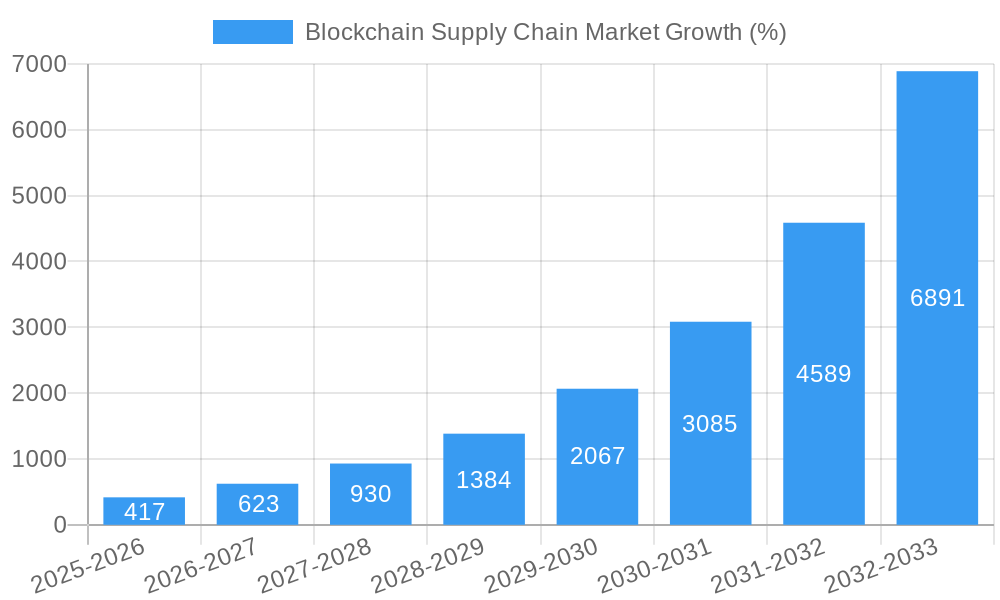
The Blockchain Supply Chain Market has witnessed significant growth over the past few years. Driven by increasing concerns regarding supply chain transparency, security, and efficiency, organizations across diverse sectors are increasingly adopting blockchain technology to optimize their operations. The market size has grown from xx Million in 2019 to an estimated xx Million in 2025, and is expected to reach xx Million by 2033. Key growth factors include rising adoption rates, technological advancements leading to cost reduction and improved scalability, and consumer demand for greater product transparency. The market experienced a CAGR of xx% from 2019 to 2024. The forecast CAGR for the period 2025-2033 is projected to be xx%. The market penetration rate is expected to increase from xx% in 2025 to xx% by 2033.
Dominant Regions, Countries, or Segments in Blockchain Supply Chain Market
North America currently dominates the Blockchain Supply Chain Market, driven by early adoption by large enterprises and robust technological infrastructure. However, the Asia-Pacific region is expected to exhibit the highest growth rate during the forecast period due to increasing government support, rising digitalization, and the presence of several large-scale manufacturing and logistics hubs.
- By Component: The Services segment holds a larger market share than the Platform segment due to the increased demand for customized solutions and ongoing support.
- By Application: Product Traceability is currently the most adopted application, followed closely by Counterfeit Detection. Payment & Settlement is expected to witness significant growth in the coming years.
- By Industry Vertical: The Retail & Consumer Goods sector represents the largest segment, driven by the demand for enhanced supply chain transparency and consumer trust. Manufacturing and Logistics also show substantial growth.
- Key Drivers: Government initiatives promoting blockchain adoption, technological advancements leading to reduced costs and enhanced scalability, and increasing consumer awareness contribute to the growth of different segments.
Blockchain Supply Chain Market Product Landscape
The Blockchain Supply Chain Market offers a variety of products and solutions, ranging from platform-based solutions to specialized services focusing on specific applications such as product traceability and payment settlement. Recent product innovations include the integration of AI and IoT, enhancing data analysis and real-time tracking capabilities. These solutions provide enhanced security, transparency, and efficiency compared to traditional supply chain management systems. Unique selling propositions include improved auditability, immutability of data, and cost reduction through automation.
Key Drivers, Barriers & Challenges in Blockchain Supply Chain Market
Key Drivers:
- Increased demand for improved supply chain visibility and transparency.
- Growing need for enhanced security and fraud prevention measures.
- Rising adoption of digital technologies and automation across industries.
Key Barriers & Challenges:
- High initial investment costs for implementing blockchain solutions.
- Lack of standardization and interoperability across different blockchain platforms.
- Regulatory uncertainties and concerns regarding data privacy and security. xx% of surveyed businesses cited regulatory uncertainty as a major barrier.
Emerging Opportunities in Blockchain Supply Chain Market
- Growing demand for sustainable and ethical supply chains.
- Expansion of blockchain technology into new industry verticals such as agriculture and pharmaceuticals.
- Development of innovative applications such as decentralized autonomous organizations (DAOs) for supply chain management.
Growth Accelerators in the Blockchain Supply Chain Market Industry
Strategic partnerships between technology providers and industry leaders are driving market growth. Technological breakthroughs in scalability, interoperability, and cost reduction are crucial. Expanding into emerging markets presents significant opportunities for expansion.
Key Players Shaping the Blockchain Supply Chain Market Market
- Accenture PLC
- IBM Corporation
- Microsoft Corporation
- Amazon Web Services Inc
- Oracle Corporation
- SAP SE
- Digital Treasury Corporatio
- Bitfury Group Limited
- BTL Group
- TIBCO Software Inc
- Huawei Technologies Co Ltd
- VeChain Foundation
- Omnichain Inc
- Guardtime Inc
- Auxesis Group
Notable Milestones in Blockchain Supply Chain Market Sector
- November 2023: MY E.G. Service’s Zetrix launches a supply chain financing project with Chinese banks.
- February 2023: The USAF invests USD 30 million in SIMBA Chain for blockchain-based supply chain management.
- August 2022: Oracle partners with InfStones to expand its blockchain product portfolio.
- March 2022: Unilever implements SAP's blockchain technology for palm oil supply chain tracking.
In-Depth Blockchain Supply Chain Market Market Outlook
The Blockchain Supply Chain Market is poised for substantial growth in the coming years. Continued technological advancements, increasing regulatory clarity, and growing enterprise adoption will drive market expansion. Strategic partnerships and the development of innovative applications will further fuel market growth, creating lucrative opportunities for both established players and new entrants. The market's future potential lies in its ability to enhance supply chain transparency, security, and efficiency across various sectors globally.
Blockchain Supply Chain Market Segmentation
-
1. Application
- 1.1. Payment & Settlement
- 1.2. Product Traceability
- 1.3. Counterfeit Detection
- 1.4. Smart Contracts
- 1.5. Risk & Compliance Management
- 1.6. Other Applications
-
2. Industry Vertical
- 2.1. Retail & Consumer Goods
- 2.2. Healthcare & Life Sciences
- 2.3. Manufacturing
- 2.4. Logistics, Oil & Gas
- 2.5. Other Industry Verticals
-
3. Component
- 3.1. Platform
- 3.2. Services
Blockchain Supply Chain Market Segmentation By Geography
-
1. North America
- 1.1. United States
- 1.2. Canada
-
2. Europe
- 2.1. Germany
- 2.2. United Kingdom
- 2.3. France
- 2.4. Spain
-
3. Asia
- 3.1. China
- 3.2. Japan
- 3.3. India
- 3.4. Australia
-
4. Latin America
- 4.1. Brazil
- 4.2. Mexico
- 4.3. Argentina
-
5. Middle East and Africa
- 5.1. United Arab Emirates
- 5.2. Saudi Arabia
- 5.3. South Africa
Blockchain Supply Chain Market REPORT HIGHLIGHTS
| Aspects | Details |
|---|---|
| Study Period | 2019-2033 |
| Base Year | 2024 |
| Estimated Year | 2025 |
| Forecast Period | 2025-2033 |
| Historical Period | 2019-2024 |
| Growth Rate | CAGR of 49.87% from 2019-2033 |
| Segmentation |
|
Table of Contents
- 1. Introduction
- 1.1. Research Scope
- 1.2. Market Segmentation
- 1.3. Research Methodology
- 1.4. Definitions and Assumptions
- 2. Executive Summary
- 2.1. Introduction
- 3. Market Dynamics
- 3.1. Introduction
- 3.2. Market Drivers
- 3.2.1. Augmented Demand for Improved Security of Supply Chain Transactions; Growing Requirement for Supply Chain Transparency; Rising use of Blockchain in Retail & Consumer Goods sector
- 3.3. Market Restrains
- 3.3.1. Absence of Awareness of the Blockchain Technology
- 3.4. Market Trends
- 3.4.1. Retail & Consumer Goods to Dominate the Market
- 4. Market Factor Analysis
- 4.1. Porters Five Forces
- 4.2. Supply/Value Chain
- 4.3. PESTEL analysis
- 4.4. Market Entropy
- 4.5. Patent/Trademark Analysis
- 5. Global Blockchain Supply Chain Market Analysis, Insights and Forecast, 2019-2031
- 5.1. Market Analysis, Insights and Forecast - by Application
- 5.1.1. Payment & Settlement
- 5.1.2. Product Traceability
- 5.1.3. Counterfeit Detection
- 5.1.4. Smart Contracts
- 5.1.5. Risk & Compliance Management
- 5.1.6. Other Applications
- 5.2. Market Analysis, Insights and Forecast - by Industry Vertical
- 5.2.1. Retail & Consumer Goods
- 5.2.2. Healthcare & Life Sciences
- 5.2.3. Manufacturing
- 5.2.4. Logistics, Oil & Gas
- 5.2.5. Other Industry Verticals
- 5.3. Market Analysis, Insights and Forecast - by Component
- 5.3.1. Platform
- 5.3.2. Services
- 5.4. Market Analysis, Insights and Forecast - by Region
- 5.4.1. North America
- 5.4.2. Europe
- 5.4.3. Asia
- 5.4.4. Latin America
- 5.4.5. Middle East and Africa
- 5.1. Market Analysis, Insights and Forecast - by Application
- 6. North America Blockchain Supply Chain Market Analysis, Insights and Forecast, 2019-2031
- 6.1. Market Analysis, Insights and Forecast - by Application
- 6.1.1. Payment & Settlement
- 6.1.2. Product Traceability
- 6.1.3. Counterfeit Detection
- 6.1.4. Smart Contracts
- 6.1.5. Risk & Compliance Management
- 6.1.6. Other Applications
- 6.2. Market Analysis, Insights and Forecast - by Industry Vertical
- 6.2.1. Retail & Consumer Goods
- 6.2.2. Healthcare & Life Sciences
- 6.2.3. Manufacturing
- 6.2.4. Logistics, Oil & Gas
- 6.2.5. Other Industry Verticals
- 6.3. Market Analysis, Insights and Forecast - by Component
- 6.3.1. Platform
- 6.3.2. Services
- 6.1. Market Analysis, Insights and Forecast - by Application
- 7. Europe Blockchain Supply Chain Market Analysis, Insights and Forecast, 2019-2031
- 7.1. Market Analysis, Insights and Forecast - by Application
- 7.1.1. Payment & Settlement
- 7.1.2. Product Traceability
- 7.1.3. Counterfeit Detection
- 7.1.4. Smart Contracts
- 7.1.5. Risk & Compliance Management
- 7.1.6. Other Applications
- 7.2. Market Analysis, Insights and Forecast - by Industry Vertical
- 7.2.1. Retail & Consumer Goods
- 7.2.2. Healthcare & Life Sciences
- 7.2.3. Manufacturing
- 7.2.4. Logistics, Oil & Gas
- 7.2.5. Other Industry Verticals
- 7.3. Market Analysis, Insights and Forecast - by Component
- 7.3.1. Platform
- 7.3.2. Services
- 7.1. Market Analysis, Insights and Forecast - by Application
- 8. Asia Blockchain Supply Chain Market Analysis, Insights and Forecast, 2019-2031
- 8.1. Market Analysis, Insights and Forecast - by Application
- 8.1.1. Payment & Settlement
- 8.1.2. Product Traceability
- 8.1.3. Counterfeit Detection
- 8.1.4. Smart Contracts
- 8.1.5. Risk & Compliance Management
- 8.1.6. Other Applications
- 8.2. Market Analysis, Insights and Forecast - by Industry Vertical
- 8.2.1. Retail & Consumer Goods
- 8.2.2. Healthcare & Life Sciences
- 8.2.3. Manufacturing
- 8.2.4. Logistics, Oil & Gas
- 8.2.5. Other Industry Verticals
- 8.3. Market Analysis, Insights and Forecast - by Component
- 8.3.1. Platform
- 8.3.2. Services
- 8.1. Market Analysis, Insights and Forecast - by Application
- 9. Latin America Blockchain Supply Chain Market Analysis, Insights and Forecast, 2019-2031
- 9.1. Market Analysis, Insights and Forecast - by Application
- 9.1.1. Payment & Settlement
- 9.1.2. Product Traceability
- 9.1.3. Counterfeit Detection
- 9.1.4. Smart Contracts
- 9.1.5. Risk & Compliance Management
- 9.1.6. Other Applications
- 9.2. Market Analysis, Insights and Forecast - by Industry Vertical
- 9.2.1. Retail & Consumer Goods
- 9.2.2. Healthcare & Life Sciences
- 9.2.3. Manufacturing
- 9.2.4. Logistics, Oil & Gas
- 9.2.5. Other Industry Verticals
- 9.3. Market Analysis, Insights and Forecast - by Component
- 9.3.1. Platform
- 9.3.2. Services
- 9.1. Market Analysis, Insights and Forecast - by Application
- 10. Middle East and Africa Blockchain Supply Chain Market Analysis, Insights and Forecast, 2019-2031
- 10.1. Market Analysis, Insights and Forecast - by Application
- 10.1.1. Payment & Settlement
- 10.1.2. Product Traceability
- 10.1.3. Counterfeit Detection
- 10.1.4. Smart Contracts
- 10.1.5. Risk & Compliance Management
- 10.1.6. Other Applications
- 10.2. Market Analysis, Insights and Forecast - by Industry Vertical
- 10.2.1. Retail & Consumer Goods
- 10.2.2. Healthcare & Life Sciences
- 10.2.3. Manufacturing
- 10.2.4. Logistics, Oil & Gas
- 10.2.5. Other Industry Verticals
- 10.3. Market Analysis, Insights and Forecast - by Component
- 10.3.1. Platform
- 10.3.2. Services
- 10.1. Market Analysis, Insights and Forecast - by Application
- 11. North America Blockchain Supply Chain Market Analysis, Insights and Forecast, 2019-2031
- 11.1. Market Analysis, Insights and Forecast - By Country/Sub-region
- 11.1.1 United States
- 11.1.2 Canada
- 11.1.3 Mexico
- 12. Europe Blockchain Supply Chain Market Analysis, Insights and Forecast, 2019-2031
- 12.1. Market Analysis, Insights and Forecast - By Country/Sub-region
- 12.1.1 Germany
- 12.1.2 United Kingdom
- 12.1.3 France
- 12.1.4 Spain
- 12.1.5 Italy
- 12.1.6 Spain
- 12.1.7 Belgium
- 12.1.8 Netherland
- 12.1.9 Nordics
- 12.1.10 Rest of Europe
- 13. Asia Pacific Blockchain Supply Chain Market Analysis, Insights and Forecast, 2019-2031
- 13.1. Market Analysis, Insights and Forecast - By Country/Sub-region
- 13.1.1 China
- 13.1.2 Japan
- 13.1.3 India
- 13.1.4 South Korea
- 13.1.5 Southeast Asia
- 13.1.6 Australia
- 13.1.7 Indonesia
- 13.1.8 Phillipes
- 13.1.9 Singapore
- 13.1.10 Thailandc
- 13.1.11 Rest of Asia Pacific
- 14. South America Blockchain Supply Chain Market Analysis, Insights and Forecast, 2019-2031
- 14.1. Market Analysis, Insights and Forecast - By Country/Sub-region
- 14.1.1 Brazil
- 14.1.2 Argentina
- 14.1.3 Peru
- 14.1.4 Chile
- 14.1.5 Colombia
- 14.1.6 Ecuador
- 14.1.7 Venezuela
- 14.1.8 Rest of South America
- 15. North America Blockchain Supply Chain Market Analysis, Insights and Forecast, 2019-2031
- 15.1. Market Analysis, Insights and Forecast - By Country/Sub-region
- 15.1.1 United States
- 15.1.2 Canada
- 15.1.3 Mexico
- 16. MEA Blockchain Supply Chain Market Analysis, Insights and Forecast, 2019-2031
- 16.1. Market Analysis, Insights and Forecast - By Country/Sub-region
- 16.1.1 United Arab Emirates
- 16.1.2 Saudi Arabia
- 16.1.3 South Africa
- 16.1.4 Rest of Middle East and Africa
- 17. Competitive Analysis
- 17.1. Global Market Share Analysis 2024
- 17.2. Company Profiles
- 17.2.1 Digital Treasury Corporatio
- 17.2.1.1. Overview
- 17.2.1.2. Products
- 17.2.1.3. SWOT Analysis
- 17.2.1.4. Recent Developments
- 17.2.1.5. Financials (Based on Availability)
- 17.2.2 Accenture PLC
- 17.2.2.1. Overview
- 17.2.2.2. Products
- 17.2.2.3. SWOT Analysis
- 17.2.2.4. Recent Developments
- 17.2.2.5. Financials (Based on Availability)
- 17.2.3 Bitfury Group Limited
- 17.2.3.1. Overview
- 17.2.3.2. Products
- 17.2.3.3. SWOT Analysis
- 17.2.3.4. Recent Developments
- 17.2.3.5. Financials (Based on Availability)
- 17.2.4 BTL Group
- 17.2.4.1. Overview
- 17.2.4.2. Products
- 17.2.4.3. SWOT Analysis
- 17.2.4.4. Recent Developments
- 17.2.4.5. Financials (Based on Availability)
- 17.2.5 TIBCO Software Inc
- 17.2.5.1. Overview
- 17.2.5.2. Products
- 17.2.5.3. SWOT Analysis
- 17.2.5.4. Recent Developments
- 17.2.5.5. Financials (Based on Availability)
- 17.2.6 IBM Corporation
- 17.2.6.1. Overview
- 17.2.6.2. Products
- 17.2.6.3. SWOT Analysis
- 17.2.6.4. Recent Developments
- 17.2.6.5. Financials (Based on Availability)
- 17.2.7 Microsoft Corporation
- 17.2.7.1. Overview
- 17.2.7.2. Products
- 17.2.7.3. SWOT Analysis
- 17.2.7.4. Recent Developments
- 17.2.7.5. Financials (Based on Availability)
- 17.2.8 Amazon Web Services Inc
- 17.2.8.1. Overview
- 17.2.8.2. Products
- 17.2.8.3. SWOT Analysis
- 17.2.8.4. Recent Developments
- 17.2.8.5. Financials (Based on Availability)
- 17.2.9 Huawei Technologies Co Ltd
- 17.2.9.1. Overview
- 17.2.9.2. Products
- 17.2.9.3. SWOT Analysis
- 17.2.9.4. Recent Developments
- 17.2.9.5. Financials (Based on Availability)
- 17.2.10 Oracle Corporation
- 17.2.10.1. Overview
- 17.2.10.2. Products
- 17.2.10.3. SWOT Analysis
- 17.2.10.4. Recent Developments
- 17.2.10.5. Financials (Based on Availability)
- 17.2.11 VeChain Foundation
- 17.2.11.1. Overview
- 17.2.11.2. Products
- 17.2.11.3. SWOT Analysis
- 17.2.11.4. Recent Developments
- 17.2.11.5. Financials (Based on Availability)
- 17.2.12 Omnichain Inc
- 17.2.12.1. Overview
- 17.2.12.2. Products
- 17.2.12.3. SWOT Analysis
- 17.2.12.4. Recent Developments
- 17.2.12.5. Financials (Based on Availability)
- 17.2.13 Guardtime Inc
- 17.2.13.1. Overview
- 17.2.13.2. Products
- 17.2.13.3. SWOT Analysis
- 17.2.13.4. Recent Developments
- 17.2.13.5. Financials (Based on Availability)
- 17.2.14 Auxesis Group
- 17.2.14.1. Overview
- 17.2.14.2. Products
- 17.2.14.3. SWOT Analysis
- 17.2.14.4. Recent Developments
- 17.2.14.5. Financials (Based on Availability)
- 17.2.15 SAP SE
- 17.2.15.1. Overview
- 17.2.15.2. Products
- 17.2.15.3. SWOT Analysis
- 17.2.15.4. Recent Developments
- 17.2.15.5. Financials (Based on Availability)
- 17.2.1 Digital Treasury Corporatio
List of Figures
- Figure 1: Global Blockchain Supply Chain Market Revenue Breakdown (Million, %) by Region 2024 & 2032
- Figure 2: North America Blockchain Supply Chain Market Revenue (Million), by Country 2024 & 2032
- Figure 3: North America Blockchain Supply Chain Market Revenue Share (%), by Country 2024 & 2032
- Figure 4: Europe Blockchain Supply Chain Market Revenue (Million), by Country 2024 & 2032
- Figure 5: Europe Blockchain Supply Chain Market Revenue Share (%), by Country 2024 & 2032
- Figure 6: Asia Pacific Blockchain Supply Chain Market Revenue (Million), by Country 2024 & 2032
- Figure 7: Asia Pacific Blockchain Supply Chain Market Revenue Share (%), by Country 2024 & 2032
- Figure 8: South America Blockchain Supply Chain Market Revenue (Million), by Country 2024 & 2032
- Figure 9: South America Blockchain Supply Chain Market Revenue Share (%), by Country 2024 & 2032
- Figure 10: North America Blockchain Supply Chain Market Revenue (Million), by Country 2024 & 2032
- Figure 11: North America Blockchain Supply Chain Market Revenue Share (%), by Country 2024 & 2032
- Figure 12: MEA Blockchain Supply Chain Market Revenue (Million), by Country 2024 & 2032
- Figure 13: MEA Blockchain Supply Chain Market Revenue Share (%), by Country 2024 & 2032
- Figure 14: North America Blockchain Supply Chain Market Revenue (Million), by Application 2024 & 2032
- Figure 15: North America Blockchain Supply Chain Market Revenue Share (%), by Application 2024 & 2032
- Figure 16: North America Blockchain Supply Chain Market Revenue (Million), by Industry Vertical 2024 & 2032
- Figure 17: North America Blockchain Supply Chain Market Revenue Share (%), by Industry Vertical 2024 & 2032
- Figure 18: North America Blockchain Supply Chain Market Revenue (Million), by Component 2024 & 2032
- Figure 19: North America Blockchain Supply Chain Market Revenue Share (%), by Component 2024 & 2032
- Figure 20: North America Blockchain Supply Chain Market Revenue (Million), by Country 2024 & 2032
- Figure 21: North America Blockchain Supply Chain Market Revenue Share (%), by Country 2024 & 2032
- Figure 22: Europe Blockchain Supply Chain Market Revenue (Million), by Application 2024 & 2032
- Figure 23: Europe Blockchain Supply Chain Market Revenue Share (%), by Application 2024 & 2032
- Figure 24: Europe Blockchain Supply Chain Market Revenue (Million), by Industry Vertical 2024 & 2032
- Figure 25: Europe Blockchain Supply Chain Market Revenue Share (%), by Industry Vertical 2024 & 2032
- Figure 26: Europe Blockchain Supply Chain Market Revenue (Million), by Component 2024 & 2032
- Figure 27: Europe Blockchain Supply Chain Market Revenue Share (%), by Component 2024 & 2032
- Figure 28: Europe Blockchain Supply Chain Market Revenue (Million), by Country 2024 & 2032
- Figure 29: Europe Blockchain Supply Chain Market Revenue Share (%), by Country 2024 & 2032
- Figure 30: Asia Blockchain Supply Chain Market Revenue (Million), by Application 2024 & 2032
- Figure 31: Asia Blockchain Supply Chain Market Revenue Share (%), by Application 2024 & 2032
- Figure 32: Asia Blockchain Supply Chain Market Revenue (Million), by Industry Vertical 2024 & 2032
- Figure 33: Asia Blockchain Supply Chain Market Revenue Share (%), by Industry Vertical 2024 & 2032
- Figure 34: Asia Blockchain Supply Chain Market Revenue (Million), by Component 2024 & 2032
- Figure 35: Asia Blockchain Supply Chain Market Revenue Share (%), by Component 2024 & 2032
- Figure 36: Asia Blockchain Supply Chain Market Revenue (Million), by Country 2024 & 2032
- Figure 37: Asia Blockchain Supply Chain Market Revenue Share (%), by Country 2024 & 2032
- Figure 38: Latin America Blockchain Supply Chain Market Revenue (Million), by Application 2024 & 2032
- Figure 39: Latin America Blockchain Supply Chain Market Revenue Share (%), by Application 2024 & 2032
- Figure 40: Latin America Blockchain Supply Chain Market Revenue (Million), by Industry Vertical 2024 & 2032
- Figure 41: Latin America Blockchain Supply Chain Market Revenue Share (%), by Industry Vertical 2024 & 2032
- Figure 42: Latin America Blockchain Supply Chain Market Revenue (Million), by Component 2024 & 2032
- Figure 43: Latin America Blockchain Supply Chain Market Revenue Share (%), by Component 2024 & 2032
- Figure 44: Latin America Blockchain Supply Chain Market Revenue (Million), by Country 2024 & 2032
- Figure 45: Latin America Blockchain Supply Chain Market Revenue Share (%), by Country 2024 & 2032
- Figure 46: Middle East and Africa Blockchain Supply Chain Market Revenue (Million), by Application 2024 & 2032
- Figure 47: Middle East and Africa Blockchain Supply Chain Market Revenue Share (%), by Application 2024 & 2032
- Figure 48: Middle East and Africa Blockchain Supply Chain Market Revenue (Million), by Industry Vertical 2024 & 2032
- Figure 49: Middle East and Africa Blockchain Supply Chain Market Revenue Share (%), by Industry Vertical 2024 & 2032
- Figure 50: Middle East and Africa Blockchain Supply Chain Market Revenue (Million), by Component 2024 & 2032
- Figure 51: Middle East and Africa Blockchain Supply Chain Market Revenue Share (%), by Component 2024 & 2032
- Figure 52: Middle East and Africa Blockchain Supply Chain Market Revenue (Million), by Country 2024 & 2032
- Figure 53: Middle East and Africa Blockchain Supply Chain Market Revenue Share (%), by Country 2024 & 2032
List of Tables
- Table 1: Global Blockchain Supply Chain Market Revenue Million Forecast, by Region 2019 & 2032
- Table 2: Global Blockchain Supply Chain Market Revenue Million Forecast, by Application 2019 & 2032
- Table 3: Global Blockchain Supply Chain Market Revenue Million Forecast, by Industry Vertical 2019 & 2032
- Table 4: Global Blockchain Supply Chain Market Revenue Million Forecast, by Component 2019 & 2032
- Table 5: Global Blockchain Supply Chain Market Revenue Million Forecast, by Region 2019 & 2032
- Table 6: Global Blockchain Supply Chain Market Revenue Million Forecast, by Country 2019 & 2032
- Table 7: United States Blockchain Supply Chain Market Revenue (Million) Forecast, by Application 2019 & 2032
- Table 8: Canada Blockchain Supply Chain Market Revenue (Million) Forecast, by Application 2019 & 2032
- Table 9: Mexico Blockchain Supply Chain Market Revenue (Million) Forecast, by Application 2019 & 2032
- Table 10: Global Blockchain Supply Chain Market Revenue Million Forecast, by Country 2019 & 2032
- Table 11: Germany Blockchain Supply Chain Market Revenue (Million) Forecast, by Application 2019 & 2032
- Table 12: United Kingdom Blockchain Supply Chain Market Revenue (Million) Forecast, by Application 2019 & 2032
- Table 13: France Blockchain Supply Chain Market Revenue (Million) Forecast, by Application 2019 & 2032
- Table 14: Spain Blockchain Supply Chain Market Revenue (Million) Forecast, by Application 2019 & 2032
- Table 15: Italy Blockchain Supply Chain Market Revenue (Million) Forecast, by Application 2019 & 2032
- Table 16: Spain Blockchain Supply Chain Market Revenue (Million) Forecast, by Application 2019 & 2032
- Table 17: Belgium Blockchain Supply Chain Market Revenue (Million) Forecast, by Application 2019 & 2032
- Table 18: Netherland Blockchain Supply Chain Market Revenue (Million) Forecast, by Application 2019 & 2032
- Table 19: Nordics Blockchain Supply Chain Market Revenue (Million) Forecast, by Application 2019 & 2032
- Table 20: Rest of Europe Blockchain Supply Chain Market Revenue (Million) Forecast, by Application 2019 & 2032
- Table 21: Global Blockchain Supply Chain Market Revenue Million Forecast, by Country 2019 & 2032
- Table 22: China Blockchain Supply Chain Market Revenue (Million) Forecast, by Application 2019 & 2032
- Table 23: Japan Blockchain Supply Chain Market Revenue (Million) Forecast, by Application 2019 & 2032
- Table 24: India Blockchain Supply Chain Market Revenue (Million) Forecast, by Application 2019 & 2032
- Table 25: South Korea Blockchain Supply Chain Market Revenue (Million) Forecast, by Application 2019 & 2032
- Table 26: Southeast Asia Blockchain Supply Chain Market Revenue (Million) Forecast, by Application 2019 & 2032
- Table 27: Australia Blockchain Supply Chain Market Revenue (Million) Forecast, by Application 2019 & 2032
- Table 28: Indonesia Blockchain Supply Chain Market Revenue (Million) Forecast, by Application 2019 & 2032
- Table 29: Phillipes Blockchain Supply Chain Market Revenue (Million) Forecast, by Application 2019 & 2032
- Table 30: Singapore Blockchain Supply Chain Market Revenue (Million) Forecast, by Application 2019 & 2032
- Table 31: Thailandc Blockchain Supply Chain Market Revenue (Million) Forecast, by Application 2019 & 2032
- Table 32: Rest of Asia Pacific Blockchain Supply Chain Market Revenue (Million) Forecast, by Application 2019 & 2032
- Table 33: Global Blockchain Supply Chain Market Revenue Million Forecast, by Country 2019 & 2032
- Table 34: Brazil Blockchain Supply Chain Market Revenue (Million) Forecast, by Application 2019 & 2032
- Table 35: Argentina Blockchain Supply Chain Market Revenue (Million) Forecast, by Application 2019 & 2032
- Table 36: Peru Blockchain Supply Chain Market Revenue (Million) Forecast, by Application 2019 & 2032
- Table 37: Chile Blockchain Supply Chain Market Revenue (Million) Forecast, by Application 2019 & 2032
- Table 38: Colombia Blockchain Supply Chain Market Revenue (Million) Forecast, by Application 2019 & 2032
- Table 39: Ecuador Blockchain Supply Chain Market Revenue (Million) Forecast, by Application 2019 & 2032
- Table 40: Venezuela Blockchain Supply Chain Market Revenue (Million) Forecast, by Application 2019 & 2032
- Table 41: Rest of South America Blockchain Supply Chain Market Revenue (Million) Forecast, by Application 2019 & 2032
- Table 42: Global Blockchain Supply Chain Market Revenue Million Forecast, by Country 2019 & 2032
- Table 43: United States Blockchain Supply Chain Market Revenue (Million) Forecast, by Application 2019 & 2032
- Table 44: Canada Blockchain Supply Chain Market Revenue (Million) Forecast, by Application 2019 & 2032
- Table 45: Mexico Blockchain Supply Chain Market Revenue (Million) Forecast, by Application 2019 & 2032
- Table 46: Global Blockchain Supply Chain Market Revenue Million Forecast, by Country 2019 & 2032
- Table 47: United Arab Emirates Blockchain Supply Chain Market Revenue (Million) Forecast, by Application 2019 & 2032
- Table 48: Saudi Arabia Blockchain Supply Chain Market Revenue (Million) Forecast, by Application 2019 & 2032
- Table 49: South Africa Blockchain Supply Chain Market Revenue (Million) Forecast, by Application 2019 & 2032
- Table 50: Rest of Middle East and Africa Blockchain Supply Chain Market Revenue (Million) Forecast, by Application 2019 & 2032
- Table 51: Global Blockchain Supply Chain Market Revenue Million Forecast, by Application 2019 & 2032
- Table 52: Global Blockchain Supply Chain Market Revenue Million Forecast, by Industry Vertical 2019 & 2032
- Table 53: Global Blockchain Supply Chain Market Revenue Million Forecast, by Component 2019 & 2032
- Table 54: Global Blockchain Supply Chain Market Revenue Million Forecast, by Country 2019 & 2032
- Table 55: United States Blockchain Supply Chain Market Revenue (Million) Forecast, by Application 2019 & 2032
- Table 56: Canada Blockchain Supply Chain Market Revenue (Million) Forecast, by Application 2019 & 2032
- Table 57: Global Blockchain Supply Chain Market Revenue Million Forecast, by Application 2019 & 2032
- Table 58: Global Blockchain Supply Chain Market Revenue Million Forecast, by Industry Vertical 2019 & 2032
- Table 59: Global Blockchain Supply Chain Market Revenue Million Forecast, by Component 2019 & 2032
- Table 60: Global Blockchain Supply Chain Market Revenue Million Forecast, by Country 2019 & 2032
- Table 61: Germany Blockchain Supply Chain Market Revenue (Million) Forecast, by Application 2019 & 2032
- Table 62: United Kingdom Blockchain Supply Chain Market Revenue (Million) Forecast, by Application 2019 & 2032
- Table 63: France Blockchain Supply Chain Market Revenue (Million) Forecast, by Application 2019 & 2032
- Table 64: Spain Blockchain Supply Chain Market Revenue (Million) Forecast, by Application 2019 & 2032
- Table 65: Global Blockchain Supply Chain Market Revenue Million Forecast, by Application 2019 & 2032
- Table 66: Global Blockchain Supply Chain Market Revenue Million Forecast, by Industry Vertical 2019 & 2032
- Table 67: Global Blockchain Supply Chain Market Revenue Million Forecast, by Component 2019 & 2032
- Table 68: Global Blockchain Supply Chain Market Revenue Million Forecast, by Country 2019 & 2032
- Table 69: China Blockchain Supply Chain Market Revenue (Million) Forecast, by Application 2019 & 2032
- Table 70: Japan Blockchain Supply Chain Market Revenue (Million) Forecast, by Application 2019 & 2032
- Table 71: India Blockchain Supply Chain Market Revenue (Million) Forecast, by Application 2019 & 2032
- Table 72: Australia Blockchain Supply Chain Market Revenue (Million) Forecast, by Application 2019 & 2032
- Table 73: Global Blockchain Supply Chain Market Revenue Million Forecast, by Application 2019 & 2032
- Table 74: Global Blockchain Supply Chain Market Revenue Million Forecast, by Industry Vertical 2019 & 2032
- Table 75: Global Blockchain Supply Chain Market Revenue Million Forecast, by Component 2019 & 2032
- Table 76: Global Blockchain Supply Chain Market Revenue Million Forecast, by Country 2019 & 2032
- Table 77: Brazil Blockchain Supply Chain Market Revenue (Million) Forecast, by Application 2019 & 2032
- Table 78: Mexico Blockchain Supply Chain Market Revenue (Million) Forecast, by Application 2019 & 2032
- Table 79: Argentina Blockchain Supply Chain Market Revenue (Million) Forecast, by Application 2019 & 2032
- Table 80: Global Blockchain Supply Chain Market Revenue Million Forecast, by Application 2019 & 2032
- Table 81: Global Blockchain Supply Chain Market Revenue Million Forecast, by Industry Vertical 2019 & 2032
- Table 82: Global Blockchain Supply Chain Market Revenue Million Forecast, by Component 2019 & 2032
- Table 83: Global Blockchain Supply Chain Market Revenue Million Forecast, by Country 2019 & 2032
- Table 84: United Arab Emirates Blockchain Supply Chain Market Revenue (Million) Forecast, by Application 2019 & 2032
- Table 85: Saudi Arabia Blockchain Supply Chain Market Revenue (Million) Forecast, by Application 2019 & 2032
- Table 86: South Africa Blockchain Supply Chain Market Revenue (Million) Forecast, by Application 2019 & 2032
Frequently Asked Questions
1. What is the projected Compound Annual Growth Rate (CAGR) of the Blockchain Supply Chain Market?
The projected CAGR is approximately 49.87%.
2. Which companies are prominent players in the Blockchain Supply Chain Market?
Key companies in the market include Digital Treasury Corporatio, Accenture PLC, Bitfury Group Limited, BTL Group, TIBCO Software Inc, IBM Corporation, Microsoft Corporation, Amazon Web Services Inc, Huawei Technologies Co Ltd, Oracle Corporation, VeChain Foundation, Omnichain Inc, Guardtime Inc, Auxesis Group, SAP SE.
3. What are the main segments of the Blockchain Supply Chain Market?
The market segments include Application , Industry Vertical , Component.
4. Can you provide details about the market size?
The market size is estimated to be USD 0.84 Million as of 2022.
5. What are some drivers contributing to market growth?
Augmented Demand for Improved Security of Supply Chain Transactions; Growing Requirement for Supply Chain Transparency; Rising use of Blockchain in Retail & Consumer Goods sector.
6. What are the notable trends driving market growth?
Retail & Consumer Goods to Dominate the Market.
7. Are there any restraints impacting market growth?
Absence of Awareness of the Blockchain Technology.
8. Can you provide examples of recent developments in the market?
November 2023, MY E.G. Service’s blockchain unit in Malaysia, Zetrix, made an announcement regarding the commencement of an initial project to offer supply chain bankrolling products in conjunction with Chinese banks for international importers in addition to exporters.
9. What pricing options are available for accessing the report?
Pricing options include single-user, multi-user, and enterprise licenses priced at USD 4750, USD 5250, and USD 8750 respectively.
10. Is the market size provided in terms of value or volume?
The market size is provided in terms of value, measured in Million.
11. Are there any specific market keywords associated with the report?
Yes, the market keyword associated with the report is "Blockchain Supply Chain Market," which aids in identifying and referencing the specific market segment covered.
12. How do I determine which pricing option suits my needs best?
The pricing options vary based on user requirements and access needs. Individual users may opt for single-user licenses, while businesses requiring broader access may choose multi-user or enterprise licenses for cost-effective access to the report.
13. Are there any additional resources or data provided in the Blockchain Supply Chain Market report?
While the report offers comprehensive insights, it's advisable to review the specific contents or supplementary materials provided to ascertain if additional resources or data are available.
14. How can I stay updated on further developments or reports in the Blockchain Supply Chain Market?
To stay informed about further developments, trends, and reports in the Blockchain Supply Chain Market, consider subscribing to industry newsletters, following relevant companies and organizations, or regularly checking reputable industry news sources and publications.
Methodology
Step 1 - Identification of Relevant Samples Size from Population Database


Step 2 - Approaches for Defining Global Market Size (Value, Volume* & Price*)

Note*: In applicable scenarios
Step 3 - Data Sources
Primary Research
- Web Analytics
- Survey Reports
- Research Institute
- Latest Research Reports
- Opinion Leaders
Secondary Research
- Annual Reports
- White Paper
- Latest Press Release
- Industry Association
- Paid Database
- Investor Presentations

Step 4 - Data Triangulation
Involves using different sources of information in order to increase the validity of a study
These sources are likely to be stakeholders in a program - participants, other researchers, program staff, other community members, and so on.
Then we put all data in single framework & apply various statistical tools to find out the dynamic on the market.
During the analysis stage, feedback from the stakeholder groups would be compared to determine areas of agreement as well as areas of divergence
