

Key Insights
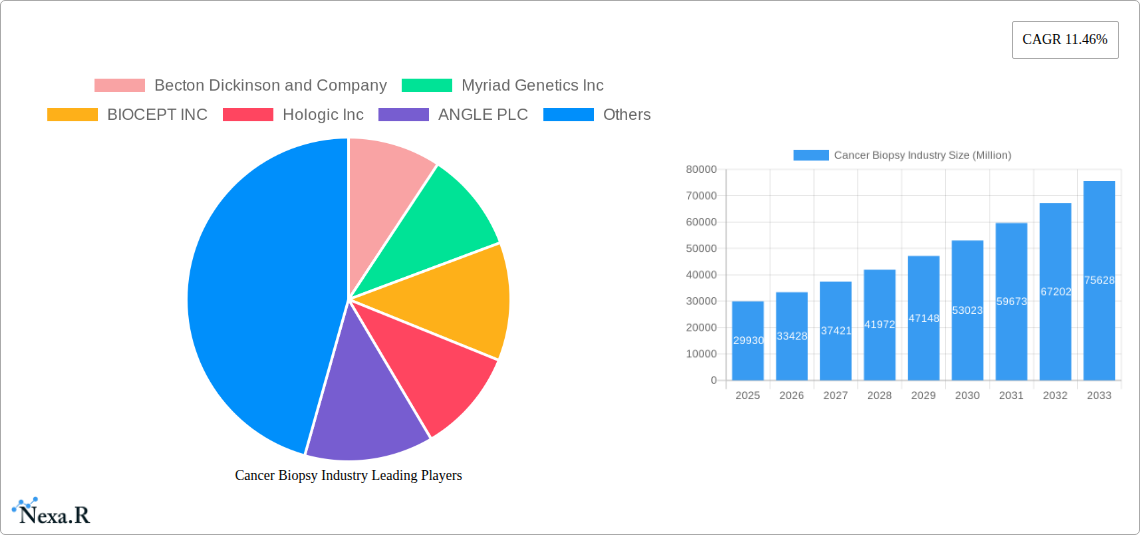
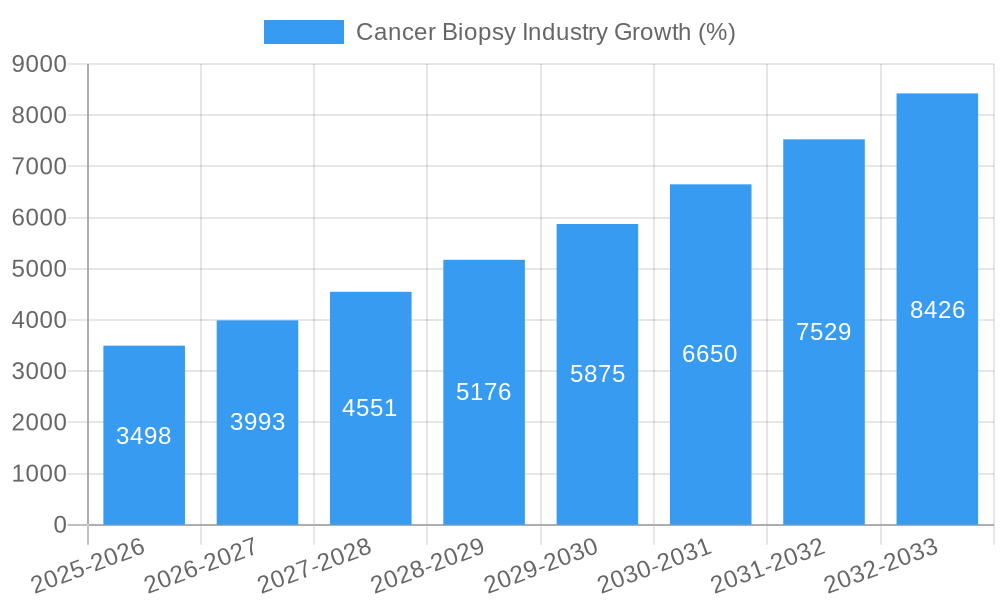
The global cancer biopsy market, valued at $29.93 billion in 2025, is projected to experience robust growth, driven by rising cancer incidence rates worldwide, advancements in biopsy techniques (minimally invasive procedures, liquid biopsies), and increasing demand for early and accurate cancer diagnostics. The market's Compound Annual Growth Rate (CAGR) of 11.46% from 2019-2033 indicates substantial expansion. Key growth drivers include the increasing adoption of advanced imaging technologies for precise biopsy targeting, growing awareness about early cancer detection, and the development of innovative biopsy devices and kits that enhance diagnostic accuracy and minimize patient discomfort. The market segmentation reveals significant opportunities across various application areas, with breast, colorectal, cervical, and lung cancers representing major segments. Hospitals and diagnostic laboratories are the primary end-users, benefiting from the rising demand for precise biopsy services and analysis. Technological advancements, particularly in liquid biopsy, which analyzes circulating tumor cells and DNA, are expected to fuel further market growth. The competitive landscape features established players like Becton Dickinson, Myriad Genetics, and Hologic, alongside emerging companies focusing on innovative biopsy technologies and diagnostics. While regulatory hurdles and high costs associated with advanced biopsy procedures may pose some challenges, the overall market outlook remains highly positive, projecting continued expansion throughout the forecast period.
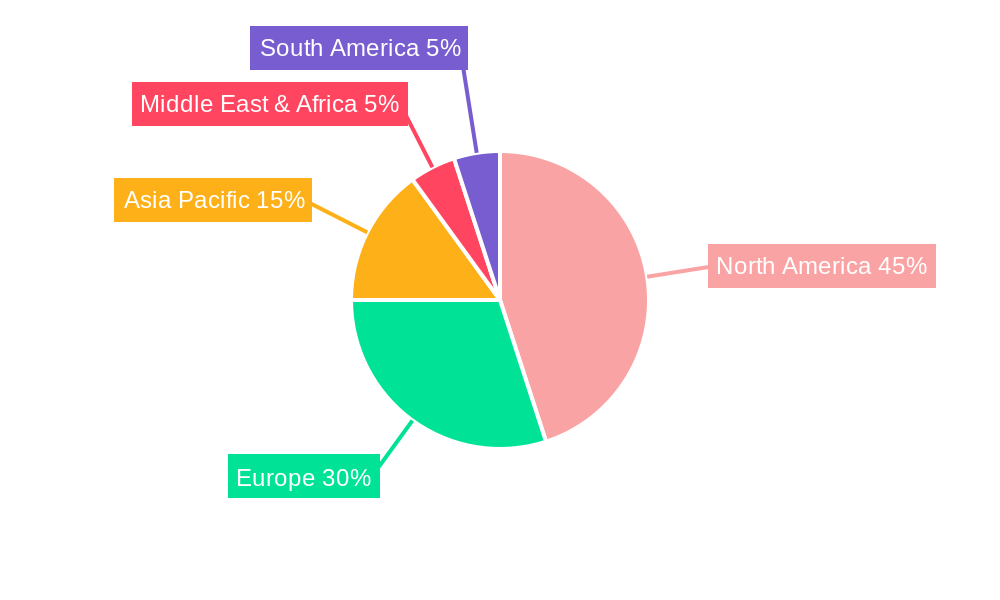
Geographic distribution showcases strong market presence in North America and Europe, driven by established healthcare infrastructure and high adoption rates of advanced diagnostic technologies. However, the Asia-Pacific region is anticipated to witness significant growth, fueled by rising healthcare expenditure, increasing awareness of cancer, and growing adoption of advanced biopsy methods. The ongoing development of minimally invasive biopsy techniques, along with advancements in personalized medicine and targeted therapies, are creating new opportunities for market expansion. Future market growth will likely depend on continued technological innovation, regulatory approvals for new biopsy technologies, and government initiatives aimed at improving cancer screening and early detection programs. The market's success will also hinge on the increasing affordability and accessibility of these advanced diagnostic procedures globally.
This comprehensive report provides an in-depth analysis of the Cancer Biopsy Industry, encompassing market dynamics, growth trends, regional dominance, product landscape, key players, and future outlook. The study period covers 2019-2033, with 2025 as the base and estimated year. The report segments the market by application (Breast Cancer, Colorectal Cancer, Cervical Cancers, Lung Cancers, Other Applications), end-user (Hospitals, Diagnostic Laboratories, Other End Users), product (Instruments, Kits and Consumables, Services), and type (Tissue Biopsy, Surgical Biopsy, Liquid Biopsy, Other Types). The global market is projected to reach xx Million by 2033.
Cancer Biopsy Industry Market Dynamics & Structure
The Cancer Biopsy market is characterized by a moderately consolidated structure with key players holding significant market share. Technological innovation, particularly in liquid biopsy, is a major driver, while regulatory approvals and reimbursement policies significantly impact market growth. The market faces competition from alternative diagnostic methods, necessitating continuous innovation. M&A activity remains a key strategic tool for expansion and diversification.
- Market Concentration: The top 5 players hold approximately xx% of the global market share in 2025.
- Technological Innovation: Advancements in liquid biopsy, AI-powered diagnostics, and minimally invasive techniques are key drivers.
- Regulatory Landscape: FDA approvals and international regulatory clearances are crucial for market entry and expansion. Stringent regulations can pose challenges.
- Competitive Substitutes: Imaging techniques and other diagnostic methods compete with biopsy procedures.
- End-User Demographics: The aging global population and rising cancer incidence rates fuel market demand.
- M&A Trends: The past five years have seen xx M&A deals, with a focus on enhancing technology portfolios and expanding geographic reach. The average deal size was approximately xx Million.
Cancer Biopsy Industry Growth Trends & Insights
The Cancer Biopsy market experienced robust growth during the historical period (2019-2024), with a CAGR of xx%. This growth is projected to continue throughout the forecast period (2025-2033), driven by technological advancements, increasing cancer prevalence, and rising demand for early and accurate diagnosis. The adoption rate of liquid biopsies is increasing rapidly, leading to significant market disruption. Consumer behavior is shifting toward minimally invasive procedures and personalized medicine approaches.
The market size is estimated to be xx Million in 2025 and is projected to reach xx Million by 2033, exhibiting a CAGR of xx% during the forecast period. Market penetration of liquid biopsy is estimated at xx% in 2025, and is expected to reach xx% by 2033. This shift is driven by increased accuracy, reduced invasiveness, and potential for early detection. The increasing adoption of advanced diagnostic technologies and the growing preference for personalized medicine are contributing to the market expansion. The growing awareness among healthcare professionals and patients regarding the advantages of biopsy procedures, coupled with technological advancements and increasing healthcare expenditure are also expected to contribute significantly to the market's growth.
Dominant Regions, Countries, or Segments in Cancer Biopsy Industry
North America currently holds the largest market share, driven by high healthcare expenditure, advanced infrastructure, and a high prevalence of cancer. Within this region, the United States dominates due to its robust healthcare system and extensive research activities. Europe follows as a significant market, with Western European countries leading the way. The segments driving market growth include:
- By Application: Breast cancer testing leads the way, followed by colorectal and lung cancers. Liquid biopsies represent the fastest-growing segment, with a projected CAGR of xx%.
- By End-User: Hospitals represent the largest end-user segment, driven by their crucial role in cancer diagnosis and treatment. Diagnostic laboratories are also significant consumers of biopsy services and products.
- By Product: Kits and consumables constitute the largest market share due to the high volume of tests performed. Instruments are a significant segment, driven by technological advancements in imaging and analysis. Services contribute to market revenue through specialized analysis and interpretation.
- By Type: Tissue biopsies still dominate, but liquid biopsies show the highest growth potential due to minimally invasive procedures and early cancer detection capabilities.
Key drivers in these regions include robust healthcare infrastructure, favorable government policies, and a high prevalence of cancer. The growth potential is especially high in Asia-Pacific due to increasing healthcare spending, rising awareness, and a rapidly growing population.
Cancer Biopsy Industry Product Landscape
The Cancer Biopsy product landscape is evolving rapidly, driven by technological advancements in instrument precision, faster turnaround times for results, and the development of more sensitive and specific tests. Liquid biopsy technologies, including circulating tumor DNA (ctDNA) and circulating tumor cells (CTCs) analysis, represent a significant innovation. These technologies offer minimally invasive alternatives to traditional biopsy methods, offering increased patient comfort, reduced invasiveness, and potential for early detection and monitoring of cancer recurrence. Manufacturers are focusing on developing integrated systems combining sample preparation, analysis, and data interpretation to improve efficiency and accuracy. The emphasis is on improving sensitivity and specificity to minimize false positives and negatives, leading to better clinical outcomes.
Key Drivers, Barriers & Challenges in Cancer Biopsy Industry
Key Drivers:
- Rising cancer incidence rates globally.
- Technological advancements in liquid biopsy and minimally invasive techniques.
- Increased demand for early cancer detection and personalized medicine.
- Growing healthcare expenditure and investments in healthcare infrastructure.
Key Challenges and Restraints:
- High costs associated with advanced biopsy procedures and technologies.
- Regulatory hurdles and reimbursement challenges for new technologies.
- Competition from alternative diagnostic methods.
- Potential for false positives and negatives with certain technologies, especially liquid biopsies.
- Supply chain disruptions impacting the availability of consumables and reagents.
Emerging Opportunities in Cancer Biopsy Industry
- Expansion into emerging markets with high cancer prevalence and growing healthcare spending.
- Development of point-of-care diagnostic tools for rapid and convenient testing.
- Integration of artificial intelligence and machine learning for improved diagnostic accuracy and efficiency.
- Focus on developing liquid biopsy tests for early cancer detection and monitoring.
Growth Accelerators in the Cancer Biopsy Industry
Technological breakthroughs in liquid biopsy, particularly in the development of highly sensitive and specific assays, are accelerating market growth. Strategic partnerships between diagnostic companies and pharmaceutical companies to co-develop companion diagnostic tests are also fueling expansion. Market expansion into underserved regions, with increased adoption of advanced diagnostic technologies in these areas, further contributes to industry growth.
Key Players Shaping the Cancer Biopsy Industry Market
- Becton Dickinson and Company
- Myriad Genetics Inc
- BIOCEPT INC
- Hologic Inc
- ANGLE PLC
- Danaher Corporation
- Agilent Technologies Inc
- Lucence Diagnostics Pte Ltd
- Sysmex Corporation
- MDx Health
- Illumina Inc
- Thermo Fisher Scientific
- QIAGEN
Notable Milestones in Cancer Biopsy Industry Sector
- August 2022: Guardant Health received US FDA approval for its Guardant360 CDx liquid biopsy test for HER2-mutant NSCLC.
- May 2022: Delfi Diagnostics presented trial updates on its next-generation liquid biopsy platform for lung cancer detection.
In-Depth Cancer Biopsy Industry Market Outlook
The Cancer Biopsy market exhibits significant long-term growth potential, driven by continuous technological advancements, increasing awareness of early cancer detection, and rising healthcare spending. Strategic partnerships, expansion into untapped markets, and the development of innovative diagnostic tools will be key to capturing this potential. The focus on personalized medicine, driven by liquid biopsies, will also shape the future of the industry, requiring ongoing investment in R&D and regulatory approvals to support successful market entry and expansion.
Cancer Biopsy Industry Segmentation
-
1. Product
- 1.1. Instruments
- 1.2. Kits and Consumables
- 1.3. Services
-
2. Type
- 2.1. Tissue Biopsy
- 2.2. Surgical Biopsy
- 2.3. Liquid Biopsy
- 2.4. Other Types
-
3. Application
- 3.1. Breast Cancer
- 3.2. Colorectal Cancer
- 3.3. Cervical Cancers
- 3.4. Lung Cancers
- 3.5. Other Applications
-
4. End User
- 4.1. Hospitals
- 4.2. Diagnostic Laboratories
- 4.3. Other End Users
Cancer Biopsy Industry Segmentation By Geography
-
1. North America
- 1.1. United States
- 1.2. Canada
- 1.3. Mexico
-
2. Europe
- 2.1. Germany
- 2.2. United Kingdom
- 2.3. France
- 2.4. Italy
- 2.5. Spain
- 2.6. Rest of Europe
-
3. Asia Pacific
- 3.1. China
- 3.2. Japan
- 3.3. India
- 3.4. Australia
- 3.5. South Korea
- 3.6. Rest of Asia Pacific
-
4. Middle East and Africa
- 4.1. GCC
- 4.2. South Africa
- 4.3. Rest of Middle East and Africa
-
5. South America
- 5.1. Brazil
- 5.2. Argentina
- 5.3. Rest of South America
Cancer Biopsy Industry REPORT HIGHLIGHTS
| Aspects | Details |
|---|---|
| Study Period | 2019-2033 |
| Base Year | 2024 |
| Estimated Year | 2025 |
| Forecast Period | 2025-2033 |
| Historical Period | 2019-2024 |
| Growth Rate | CAGR of 11.46% from 2019-2033 |
| Segmentation |
|
Table of Contents
- 1. Introduction
- 1.1. Research Scope
- 1.2. Market Segmentation
- 1.3. Research Methodology
- 1.4. Definitions and Assumptions
- 2. Executive Summary
- 2.1. Introduction
- 3. Market Dynamics
- 3.1. Introduction
- 3.2. Market Drivers
- 3.2.1. Rising Burden of Oncology Disorders and Increase in Adoption of Liquid Biopsies; Advancement in Technologies; Rising Awareness on Inherited Oncology Disorders and Genetic Testing
- 3.3. Market Restrains
- 3.3.1. Associated Risks with Biopsy Procedures
- 3.4. Market Trends
- 3.4.1. Breast Cancer Segment is Expected to Grow During the Forecast Period
- 4. Market Factor Analysis
- 4.1. Porters Five Forces
- 4.2. Supply/Value Chain
- 4.3. PESTEL analysis
- 4.4. Market Entropy
- 4.5. Patent/Trademark Analysis
- 5. Global Cancer Biopsy Industry Analysis, Insights and Forecast, 2019-2031
- 5.1. Market Analysis, Insights and Forecast - by Product
- 5.1.1. Instruments
- 5.1.2. Kits and Consumables
- 5.1.3. Services
- 5.2. Market Analysis, Insights and Forecast - by Type
- 5.2.1. Tissue Biopsy
- 5.2.2. Surgical Biopsy
- 5.2.3. Liquid Biopsy
- 5.2.4. Other Types
- 5.3. Market Analysis, Insights and Forecast - by Application
- 5.3.1. Breast Cancer
- 5.3.2. Colorectal Cancer
- 5.3.3. Cervical Cancers
- 5.3.4. Lung Cancers
- 5.3.5. Other Applications
- 5.4. Market Analysis, Insights and Forecast - by End User
- 5.4.1. Hospitals
- 5.4.2. Diagnostic Laboratories
- 5.4.3. Other End Users
- 5.5. Market Analysis, Insights and Forecast - by Region
- 5.5.1. North America
- 5.5.2. Europe
- 5.5.3. Asia Pacific
- 5.5.4. Middle East and Africa
- 5.5.5. South America
- 5.1. Market Analysis, Insights and Forecast - by Product
- 6. North America Cancer Biopsy Industry Analysis, Insights and Forecast, 2019-2031
- 6.1. Market Analysis, Insights and Forecast - by Product
- 6.1.1. Instruments
- 6.1.2. Kits and Consumables
- 6.1.3. Services
- 6.2. Market Analysis, Insights and Forecast - by Type
- 6.2.1. Tissue Biopsy
- 6.2.2. Surgical Biopsy
- 6.2.3. Liquid Biopsy
- 6.2.4. Other Types
- 6.3. Market Analysis, Insights and Forecast - by Application
- 6.3.1. Breast Cancer
- 6.3.2. Colorectal Cancer
- 6.3.3. Cervical Cancers
- 6.3.4. Lung Cancers
- 6.3.5. Other Applications
- 6.4. Market Analysis, Insights and Forecast - by End User
- 6.4.1. Hospitals
- 6.4.2. Diagnostic Laboratories
- 6.4.3. Other End Users
- 6.1. Market Analysis, Insights and Forecast - by Product
- 7. Europe Cancer Biopsy Industry Analysis, Insights and Forecast, 2019-2031
- 7.1. Market Analysis, Insights and Forecast - by Product
- 7.1.1. Instruments
- 7.1.2. Kits and Consumables
- 7.1.3. Services
- 7.2. Market Analysis, Insights and Forecast - by Type
- 7.2.1. Tissue Biopsy
- 7.2.2. Surgical Biopsy
- 7.2.3. Liquid Biopsy
- 7.2.4. Other Types
- 7.3. Market Analysis, Insights and Forecast - by Application
- 7.3.1. Breast Cancer
- 7.3.2. Colorectal Cancer
- 7.3.3. Cervical Cancers
- 7.3.4. Lung Cancers
- 7.3.5. Other Applications
- 7.4. Market Analysis, Insights and Forecast - by End User
- 7.4.1. Hospitals
- 7.4.2. Diagnostic Laboratories
- 7.4.3. Other End Users
- 7.1. Market Analysis, Insights and Forecast - by Product
- 8. Asia Pacific Cancer Biopsy Industry Analysis, Insights and Forecast, 2019-2031
- 8.1. Market Analysis, Insights and Forecast - by Product
- 8.1.1. Instruments
- 8.1.2. Kits and Consumables
- 8.1.3. Services
- 8.2. Market Analysis, Insights and Forecast - by Type
- 8.2.1. Tissue Biopsy
- 8.2.2. Surgical Biopsy
- 8.2.3. Liquid Biopsy
- 8.2.4. Other Types
- 8.3. Market Analysis, Insights and Forecast - by Application
- 8.3.1. Breast Cancer
- 8.3.2. Colorectal Cancer
- 8.3.3. Cervical Cancers
- 8.3.4. Lung Cancers
- 8.3.5. Other Applications
- 8.4. Market Analysis, Insights and Forecast - by End User
- 8.4.1. Hospitals
- 8.4.2. Diagnostic Laboratories
- 8.4.3. Other End Users
- 8.1. Market Analysis, Insights and Forecast - by Product
- 9. Middle East and Africa Cancer Biopsy Industry Analysis, Insights and Forecast, 2019-2031
- 9.1. Market Analysis, Insights and Forecast - by Product
- 9.1.1. Instruments
- 9.1.2. Kits and Consumables
- 9.1.3. Services
- 9.2. Market Analysis, Insights and Forecast - by Type
- 9.2.1. Tissue Biopsy
- 9.2.2. Surgical Biopsy
- 9.2.3. Liquid Biopsy
- 9.2.4. Other Types
- 9.3. Market Analysis, Insights and Forecast - by Application
- 9.3.1. Breast Cancer
- 9.3.2. Colorectal Cancer
- 9.3.3. Cervical Cancers
- 9.3.4. Lung Cancers
- 9.3.5. Other Applications
- 9.4. Market Analysis, Insights and Forecast - by End User
- 9.4.1. Hospitals
- 9.4.2. Diagnostic Laboratories
- 9.4.3. Other End Users
- 9.1. Market Analysis, Insights and Forecast - by Product
- 10. South America Cancer Biopsy Industry Analysis, Insights and Forecast, 2019-2031
- 10.1. Market Analysis, Insights and Forecast - by Product
- 10.1.1. Instruments
- 10.1.2. Kits and Consumables
- 10.1.3. Services
- 10.2. Market Analysis, Insights and Forecast - by Type
- 10.2.1. Tissue Biopsy
- 10.2.2. Surgical Biopsy
- 10.2.3. Liquid Biopsy
- 10.2.4. Other Types
- 10.3. Market Analysis, Insights and Forecast - by Application
- 10.3.1. Breast Cancer
- 10.3.2. Colorectal Cancer
- 10.3.3. Cervical Cancers
- 10.3.4. Lung Cancers
- 10.3.5. Other Applications
- 10.4. Market Analysis, Insights and Forecast - by End User
- 10.4.1. Hospitals
- 10.4.2. Diagnostic Laboratories
- 10.4.3. Other End Users
- 10.1. Market Analysis, Insights and Forecast - by Product
- 11. North America Cancer Biopsy Industry Analysis, Insights and Forecast, 2019-2031
- 11.1. Market Analysis, Insights and Forecast - By Country/Sub-region
- 11.1.1 United States
- 11.1.2 Canada
- 11.1.3 Mexico
- 12. Europe Cancer Biopsy Industry Analysis, Insights and Forecast, 2019-2031
- 12.1. Market Analysis, Insights and Forecast - By Country/Sub-region
- 12.1.1 Germany
- 12.1.2 United Kingdom
- 12.1.3 France
- 12.1.4 Italy
- 12.1.5 Spain
- 12.1.6 Rest of Europe
- 13. Asia Pacific Cancer Biopsy Industry Analysis, Insights and Forecast, 2019-2031
- 13.1. Market Analysis, Insights and Forecast - By Country/Sub-region
- 13.1.1 China
- 13.1.2 Japan
- 13.1.3 India
- 13.1.4 Australia
- 13.1.5 South Korea
- 13.1.6 Rest of Asia Pacific
- 14. Middle East and Africa Cancer Biopsy Industry Analysis, Insights and Forecast, 2019-2031
- 14.1. Market Analysis, Insights and Forecast - By Country/Sub-region
- 14.1.1 GCC
- 14.1.2 South Africa
- 14.1.3 Rest of Middle East and Africa
- 15. South America Cancer Biopsy Industry Analysis, Insights and Forecast, 2019-2031
- 15.1. Market Analysis, Insights and Forecast - By Country/Sub-region
- 15.1.1 Brazil
- 15.1.2 Argentina
- 15.1.3 Rest of South America
- 16. Competitive Analysis
- 16.1. Global Market Share Analysis 2024
- 16.2. Company Profiles
- 16.2.1 Becton Dickinson and Company
- 16.2.1.1. Overview
- 16.2.1.2. Products
- 16.2.1.3. SWOT Analysis
- 16.2.1.4. Recent Developments
- 16.2.1.5. Financials (Based on Availability)
- 16.2.2 Myriad Genetics Inc
- 16.2.2.1. Overview
- 16.2.2.2. Products
- 16.2.2.3. SWOT Analysis
- 16.2.2.4. Recent Developments
- 16.2.2.5. Financials (Based on Availability)
- 16.2.3 BIOCEPT INC
- 16.2.3.1. Overview
- 16.2.3.2. Products
- 16.2.3.3. SWOT Analysis
- 16.2.3.4. Recent Developments
- 16.2.3.5. Financials (Based on Availability)
- 16.2.4 Hologic Inc
- 16.2.4.1. Overview
- 16.2.4.2. Products
- 16.2.4.3. SWOT Analysis
- 16.2.4.4. Recent Developments
- 16.2.4.5. Financials (Based on Availability)
- 16.2.5 ANGLE PLC
- 16.2.5.1. Overview
- 16.2.5.2. Products
- 16.2.5.3. SWOT Analysis
- 16.2.5.4. Recent Developments
- 16.2.5.5. Financials (Based on Availability)
- 16.2.6 Danaher Corporation
- 16.2.6.1. Overview
- 16.2.6.2. Products
- 16.2.6.3. SWOT Analysis
- 16.2.6.4. Recent Developments
- 16.2.6.5. Financials (Based on Availability)
- 16.2.7 Agilent Technologies Inc
- 16.2.7.1. Overview
- 16.2.7.2. Products
- 16.2.7.3. SWOT Analysis
- 16.2.7.4. Recent Developments
- 16.2.7.5. Financials (Based on Availability)
- 16.2.8 Lucence Diagnostics Pte Ltd
- 16.2.8.1. Overview
- 16.2.8.2. Products
- 16.2.8.3. SWOT Analysis
- 16.2.8.4. Recent Developments
- 16.2.8.5. Financials (Based on Availability)
- 16.2.9 Sysmex Corporation
- 16.2.9.1. Overview
- 16.2.9.2. Products
- 16.2.9.3. SWOT Analysis
- 16.2.9.4. Recent Developments
- 16.2.9.5. Financials (Based on Availability)
- 16.2.10 MDx Health
- 16.2.10.1. Overview
- 16.2.10.2. Products
- 16.2.10.3. SWOT Analysis
- 16.2.10.4. Recent Developments
- 16.2.10.5. Financials (Based on Availability)
- 16.2.11 Illumina Inc
- 16.2.11.1. Overview
- 16.2.11.2. Products
- 16.2.11.3. SWOT Analysis
- 16.2.11.4. Recent Developments
- 16.2.11.5. Financials (Based on Availability)
- 16.2.12 Thermo Fisher Scientific
- 16.2.12.1. Overview
- 16.2.12.2. Products
- 16.2.12.3. SWOT Analysis
- 16.2.12.4. Recent Developments
- 16.2.12.5. Financials (Based on Availability)
- 16.2.13 QIAGEN
- 16.2.13.1. Overview
- 16.2.13.2. Products
- 16.2.13.3. SWOT Analysis
- 16.2.13.4. Recent Developments
- 16.2.13.5. Financials (Based on Availability)
- 16.2.1 Becton Dickinson and Company
List of Figures
- Figure 1: Global Cancer Biopsy Industry Revenue Breakdown (Million, %) by Region 2024 & 2032
- Figure 2: Global Cancer Biopsy Industry Volume Breakdown (K Unit, %) by Region 2024 & 2032
- Figure 3: North America Cancer Biopsy Industry Revenue (Million), by Country 2024 & 2032
- Figure 4: North America Cancer Biopsy Industry Volume (K Unit), by Country 2024 & 2032
- Figure 5: North America Cancer Biopsy Industry Revenue Share (%), by Country 2024 & 2032
- Figure 6: North America Cancer Biopsy Industry Volume Share (%), by Country 2024 & 2032
- Figure 7: Europe Cancer Biopsy Industry Revenue (Million), by Country 2024 & 2032
- Figure 8: Europe Cancer Biopsy Industry Volume (K Unit), by Country 2024 & 2032
- Figure 9: Europe Cancer Biopsy Industry Revenue Share (%), by Country 2024 & 2032
- Figure 10: Europe Cancer Biopsy Industry Volume Share (%), by Country 2024 & 2032
- Figure 11: Asia Pacific Cancer Biopsy Industry Revenue (Million), by Country 2024 & 2032
- Figure 12: Asia Pacific Cancer Biopsy Industry Volume (K Unit), by Country 2024 & 2032
- Figure 13: Asia Pacific Cancer Biopsy Industry Revenue Share (%), by Country 2024 & 2032
- Figure 14: Asia Pacific Cancer Biopsy Industry Volume Share (%), by Country 2024 & 2032
- Figure 15: Middle East and Africa Cancer Biopsy Industry Revenue (Million), by Country 2024 & 2032
- Figure 16: Middle East and Africa Cancer Biopsy Industry Volume (K Unit), by Country 2024 & 2032
- Figure 17: Middle East and Africa Cancer Biopsy Industry Revenue Share (%), by Country 2024 & 2032
- Figure 18: Middle East and Africa Cancer Biopsy Industry Volume Share (%), by Country 2024 & 2032
- Figure 19: South America Cancer Biopsy Industry Revenue (Million), by Country 2024 & 2032
- Figure 20: South America Cancer Biopsy Industry Volume (K Unit), by Country 2024 & 2032
- Figure 21: South America Cancer Biopsy Industry Revenue Share (%), by Country 2024 & 2032
- Figure 22: South America Cancer Biopsy Industry Volume Share (%), by Country 2024 & 2032
- Figure 23: North America Cancer Biopsy Industry Revenue (Million), by Product 2024 & 2032
- Figure 24: North America Cancer Biopsy Industry Volume (K Unit), by Product 2024 & 2032
- Figure 25: North America Cancer Biopsy Industry Revenue Share (%), by Product 2024 & 2032
- Figure 26: North America Cancer Biopsy Industry Volume Share (%), by Product 2024 & 2032
- Figure 27: North America Cancer Biopsy Industry Revenue (Million), by Type 2024 & 2032
- Figure 28: North America Cancer Biopsy Industry Volume (K Unit), by Type 2024 & 2032
- Figure 29: North America Cancer Biopsy Industry Revenue Share (%), by Type 2024 & 2032
- Figure 30: North America Cancer Biopsy Industry Volume Share (%), by Type 2024 & 2032
- Figure 31: North America Cancer Biopsy Industry Revenue (Million), by Application 2024 & 2032
- Figure 32: North America Cancer Biopsy Industry Volume (K Unit), by Application 2024 & 2032
- Figure 33: North America Cancer Biopsy Industry Revenue Share (%), by Application 2024 & 2032
- Figure 34: North America Cancer Biopsy Industry Volume Share (%), by Application 2024 & 2032
- Figure 35: North America Cancer Biopsy Industry Revenue (Million), by End User 2024 & 2032
- Figure 36: North America Cancer Biopsy Industry Volume (K Unit), by End User 2024 & 2032
- Figure 37: North America Cancer Biopsy Industry Revenue Share (%), by End User 2024 & 2032
- Figure 38: North America Cancer Biopsy Industry Volume Share (%), by End User 2024 & 2032
- Figure 39: North America Cancer Biopsy Industry Revenue (Million), by Country 2024 & 2032
- Figure 40: North America Cancer Biopsy Industry Volume (K Unit), by Country 2024 & 2032
- Figure 41: North America Cancer Biopsy Industry Revenue Share (%), by Country 2024 & 2032
- Figure 42: North America Cancer Biopsy Industry Volume Share (%), by Country 2024 & 2032
- Figure 43: Europe Cancer Biopsy Industry Revenue (Million), by Product 2024 & 2032
- Figure 44: Europe Cancer Biopsy Industry Volume (K Unit), by Product 2024 & 2032
- Figure 45: Europe Cancer Biopsy Industry Revenue Share (%), by Product 2024 & 2032
- Figure 46: Europe Cancer Biopsy Industry Volume Share (%), by Product 2024 & 2032
- Figure 47: Europe Cancer Biopsy Industry Revenue (Million), by Type 2024 & 2032
- Figure 48: Europe Cancer Biopsy Industry Volume (K Unit), by Type 2024 & 2032
- Figure 49: Europe Cancer Biopsy Industry Revenue Share (%), by Type 2024 & 2032
- Figure 50: Europe Cancer Biopsy Industry Volume Share (%), by Type 2024 & 2032
- Figure 51: Europe Cancer Biopsy Industry Revenue (Million), by Application 2024 & 2032
- Figure 52: Europe Cancer Biopsy Industry Volume (K Unit), by Application 2024 & 2032
- Figure 53: Europe Cancer Biopsy Industry Revenue Share (%), by Application 2024 & 2032
- Figure 54: Europe Cancer Biopsy Industry Volume Share (%), by Application 2024 & 2032
- Figure 55: Europe Cancer Biopsy Industry Revenue (Million), by End User 2024 & 2032
- Figure 56: Europe Cancer Biopsy Industry Volume (K Unit), by End User 2024 & 2032
- Figure 57: Europe Cancer Biopsy Industry Revenue Share (%), by End User 2024 & 2032
- Figure 58: Europe Cancer Biopsy Industry Volume Share (%), by End User 2024 & 2032
- Figure 59: Europe Cancer Biopsy Industry Revenue (Million), by Country 2024 & 2032
- Figure 60: Europe Cancer Biopsy Industry Volume (K Unit), by Country 2024 & 2032
- Figure 61: Europe Cancer Biopsy Industry Revenue Share (%), by Country 2024 & 2032
- Figure 62: Europe Cancer Biopsy Industry Volume Share (%), by Country 2024 & 2032
- Figure 63: Asia Pacific Cancer Biopsy Industry Revenue (Million), by Product 2024 & 2032
- Figure 64: Asia Pacific Cancer Biopsy Industry Volume (K Unit), by Product 2024 & 2032
- Figure 65: Asia Pacific Cancer Biopsy Industry Revenue Share (%), by Product 2024 & 2032
- Figure 66: Asia Pacific Cancer Biopsy Industry Volume Share (%), by Product 2024 & 2032
- Figure 67: Asia Pacific Cancer Biopsy Industry Revenue (Million), by Type 2024 & 2032
- Figure 68: Asia Pacific Cancer Biopsy Industry Volume (K Unit), by Type 2024 & 2032
- Figure 69: Asia Pacific Cancer Biopsy Industry Revenue Share (%), by Type 2024 & 2032
- Figure 70: Asia Pacific Cancer Biopsy Industry Volume Share (%), by Type 2024 & 2032
- Figure 71: Asia Pacific Cancer Biopsy Industry Revenue (Million), by Application 2024 & 2032
- Figure 72: Asia Pacific Cancer Biopsy Industry Volume (K Unit), by Application 2024 & 2032
- Figure 73: Asia Pacific Cancer Biopsy Industry Revenue Share (%), by Application 2024 & 2032
- Figure 74: Asia Pacific Cancer Biopsy Industry Volume Share (%), by Application 2024 & 2032
- Figure 75: Asia Pacific Cancer Biopsy Industry Revenue (Million), by End User 2024 & 2032
- Figure 76: Asia Pacific Cancer Biopsy Industry Volume (K Unit), by End User 2024 & 2032
- Figure 77: Asia Pacific Cancer Biopsy Industry Revenue Share (%), by End User 2024 & 2032
- Figure 78: Asia Pacific Cancer Biopsy Industry Volume Share (%), by End User 2024 & 2032
- Figure 79: Asia Pacific Cancer Biopsy Industry Revenue (Million), by Country 2024 & 2032
- Figure 80: Asia Pacific Cancer Biopsy Industry Volume (K Unit), by Country 2024 & 2032
- Figure 81: Asia Pacific Cancer Biopsy Industry Revenue Share (%), by Country 2024 & 2032
- Figure 82: Asia Pacific Cancer Biopsy Industry Volume Share (%), by Country 2024 & 2032
- Figure 83: Middle East and Africa Cancer Biopsy Industry Revenue (Million), by Product 2024 & 2032
- Figure 84: Middle East and Africa Cancer Biopsy Industry Volume (K Unit), by Product 2024 & 2032
- Figure 85: Middle East and Africa Cancer Biopsy Industry Revenue Share (%), by Product 2024 & 2032
- Figure 86: Middle East and Africa Cancer Biopsy Industry Volume Share (%), by Product 2024 & 2032
- Figure 87: Middle East and Africa Cancer Biopsy Industry Revenue (Million), by Type 2024 & 2032
- Figure 88: Middle East and Africa Cancer Biopsy Industry Volume (K Unit), by Type 2024 & 2032
- Figure 89: Middle East and Africa Cancer Biopsy Industry Revenue Share (%), by Type 2024 & 2032
- Figure 90: Middle East and Africa Cancer Biopsy Industry Volume Share (%), by Type 2024 & 2032
- Figure 91: Middle East and Africa Cancer Biopsy Industry Revenue (Million), by Application 2024 & 2032
- Figure 92: Middle East and Africa Cancer Biopsy Industry Volume (K Unit), by Application 2024 & 2032
- Figure 93: Middle East and Africa Cancer Biopsy Industry Revenue Share (%), by Application 2024 & 2032
- Figure 94: Middle East and Africa Cancer Biopsy Industry Volume Share (%), by Application 2024 & 2032
- Figure 95: Middle East and Africa Cancer Biopsy Industry Revenue (Million), by End User 2024 & 2032
- Figure 96: Middle East and Africa Cancer Biopsy Industry Volume (K Unit), by End User 2024 & 2032
- Figure 97: Middle East and Africa Cancer Biopsy Industry Revenue Share (%), by End User 2024 & 2032
- Figure 98: Middle East and Africa Cancer Biopsy Industry Volume Share (%), by End User 2024 & 2032
- Figure 99: Middle East and Africa Cancer Biopsy Industry Revenue (Million), by Country 2024 & 2032
- Figure 100: Middle East and Africa Cancer Biopsy Industry Volume (K Unit), by Country 2024 & 2032
- Figure 101: Middle East and Africa Cancer Biopsy Industry Revenue Share (%), by Country 2024 & 2032
- Figure 102: Middle East and Africa Cancer Biopsy Industry Volume Share (%), by Country 2024 & 2032
- Figure 103: South America Cancer Biopsy Industry Revenue (Million), by Product 2024 & 2032
- Figure 104: South America Cancer Biopsy Industry Volume (K Unit), by Product 2024 & 2032
- Figure 105: South America Cancer Biopsy Industry Revenue Share (%), by Product 2024 & 2032
- Figure 106: South America Cancer Biopsy Industry Volume Share (%), by Product 2024 & 2032
- Figure 107: South America Cancer Biopsy Industry Revenue (Million), by Type 2024 & 2032
- Figure 108: South America Cancer Biopsy Industry Volume (K Unit), by Type 2024 & 2032
- Figure 109: South America Cancer Biopsy Industry Revenue Share (%), by Type 2024 & 2032
- Figure 110: South America Cancer Biopsy Industry Volume Share (%), by Type 2024 & 2032
- Figure 111: South America Cancer Biopsy Industry Revenue (Million), by Application 2024 & 2032
- Figure 112: South America Cancer Biopsy Industry Volume (K Unit), by Application 2024 & 2032
- Figure 113: South America Cancer Biopsy Industry Revenue Share (%), by Application 2024 & 2032
- Figure 114: South America Cancer Biopsy Industry Volume Share (%), by Application 2024 & 2032
- Figure 115: South America Cancer Biopsy Industry Revenue (Million), by End User 2024 & 2032
- Figure 116: South America Cancer Biopsy Industry Volume (K Unit), by End User 2024 & 2032
- Figure 117: South America Cancer Biopsy Industry Revenue Share (%), by End User 2024 & 2032
- Figure 118: South America Cancer Biopsy Industry Volume Share (%), by End User 2024 & 2032
- Figure 119: South America Cancer Biopsy Industry Revenue (Million), by Country 2024 & 2032
- Figure 120: South America Cancer Biopsy Industry Volume (K Unit), by Country 2024 & 2032
- Figure 121: South America Cancer Biopsy Industry Revenue Share (%), by Country 2024 & 2032
- Figure 122: South America Cancer Biopsy Industry Volume Share (%), by Country 2024 & 2032
List of Tables
- Table 1: Global Cancer Biopsy Industry Revenue Million Forecast, by Region 2019 & 2032
- Table 2: Global Cancer Biopsy Industry Volume K Unit Forecast, by Region 2019 & 2032
- Table 3: Global Cancer Biopsy Industry Revenue Million Forecast, by Product 2019 & 2032
- Table 4: Global Cancer Biopsy Industry Volume K Unit Forecast, by Product 2019 & 2032
- Table 5: Global Cancer Biopsy Industry Revenue Million Forecast, by Type 2019 & 2032
- Table 6: Global Cancer Biopsy Industry Volume K Unit Forecast, by Type 2019 & 2032
- Table 7: Global Cancer Biopsy Industry Revenue Million Forecast, by Application 2019 & 2032
- Table 8: Global Cancer Biopsy Industry Volume K Unit Forecast, by Application 2019 & 2032
- Table 9: Global Cancer Biopsy Industry Revenue Million Forecast, by End User 2019 & 2032
- Table 10: Global Cancer Biopsy Industry Volume K Unit Forecast, by End User 2019 & 2032
- Table 11: Global Cancer Biopsy Industry Revenue Million Forecast, by Region 2019 & 2032
- Table 12: Global Cancer Biopsy Industry Volume K Unit Forecast, by Region 2019 & 2032
- Table 13: Global Cancer Biopsy Industry Revenue Million Forecast, by Country 2019 & 2032
- Table 14: Global Cancer Biopsy Industry Volume K Unit Forecast, by Country 2019 & 2032
- Table 15: United States Cancer Biopsy Industry Revenue (Million) Forecast, by Application 2019 & 2032
- Table 16: United States Cancer Biopsy Industry Volume (K Unit) Forecast, by Application 2019 & 2032
- Table 17: Canada Cancer Biopsy Industry Revenue (Million) Forecast, by Application 2019 & 2032
- Table 18: Canada Cancer Biopsy Industry Volume (K Unit) Forecast, by Application 2019 & 2032
- Table 19: Mexico Cancer Biopsy Industry Revenue (Million) Forecast, by Application 2019 & 2032
- Table 20: Mexico Cancer Biopsy Industry Volume (K Unit) Forecast, by Application 2019 & 2032
- Table 21: Global Cancer Biopsy Industry Revenue Million Forecast, by Country 2019 & 2032
- Table 22: Global Cancer Biopsy Industry Volume K Unit Forecast, by Country 2019 & 2032
- Table 23: Germany Cancer Biopsy Industry Revenue (Million) Forecast, by Application 2019 & 2032
- Table 24: Germany Cancer Biopsy Industry Volume (K Unit) Forecast, by Application 2019 & 2032
- Table 25: United Kingdom Cancer Biopsy Industry Revenue (Million) Forecast, by Application 2019 & 2032
- Table 26: United Kingdom Cancer Biopsy Industry Volume (K Unit) Forecast, by Application 2019 & 2032
- Table 27: France Cancer Biopsy Industry Revenue (Million) Forecast, by Application 2019 & 2032
- Table 28: France Cancer Biopsy Industry Volume (K Unit) Forecast, by Application 2019 & 2032
- Table 29: Italy Cancer Biopsy Industry Revenue (Million) Forecast, by Application 2019 & 2032
- Table 30: Italy Cancer Biopsy Industry Volume (K Unit) Forecast, by Application 2019 & 2032
- Table 31: Spain Cancer Biopsy Industry Revenue (Million) Forecast, by Application 2019 & 2032
- Table 32: Spain Cancer Biopsy Industry Volume (K Unit) Forecast, by Application 2019 & 2032
- Table 33: Rest of Europe Cancer Biopsy Industry Revenue (Million) Forecast, by Application 2019 & 2032
- Table 34: Rest of Europe Cancer Biopsy Industry Volume (K Unit) Forecast, by Application 2019 & 2032
- Table 35: Global Cancer Biopsy Industry Revenue Million Forecast, by Country 2019 & 2032
- Table 36: Global Cancer Biopsy Industry Volume K Unit Forecast, by Country 2019 & 2032
- Table 37: China Cancer Biopsy Industry Revenue (Million) Forecast, by Application 2019 & 2032
- Table 38: China Cancer Biopsy Industry Volume (K Unit) Forecast, by Application 2019 & 2032
- Table 39: Japan Cancer Biopsy Industry Revenue (Million) Forecast, by Application 2019 & 2032
- Table 40: Japan Cancer Biopsy Industry Volume (K Unit) Forecast, by Application 2019 & 2032
- Table 41: India Cancer Biopsy Industry Revenue (Million) Forecast, by Application 2019 & 2032
- Table 42: India Cancer Biopsy Industry Volume (K Unit) Forecast, by Application 2019 & 2032
- Table 43: Australia Cancer Biopsy Industry Revenue (Million) Forecast, by Application 2019 & 2032
- Table 44: Australia Cancer Biopsy Industry Volume (K Unit) Forecast, by Application 2019 & 2032
- Table 45: South Korea Cancer Biopsy Industry Revenue (Million) Forecast, by Application 2019 & 2032
- Table 46: South Korea Cancer Biopsy Industry Volume (K Unit) Forecast, by Application 2019 & 2032
- Table 47: Rest of Asia Pacific Cancer Biopsy Industry Revenue (Million) Forecast, by Application 2019 & 2032
- Table 48: Rest of Asia Pacific Cancer Biopsy Industry Volume (K Unit) Forecast, by Application 2019 & 2032
- Table 49: Global Cancer Biopsy Industry Revenue Million Forecast, by Country 2019 & 2032
- Table 50: Global Cancer Biopsy Industry Volume K Unit Forecast, by Country 2019 & 2032
- Table 51: GCC Cancer Biopsy Industry Revenue (Million) Forecast, by Application 2019 & 2032
- Table 52: GCC Cancer Biopsy Industry Volume (K Unit) Forecast, by Application 2019 & 2032
- Table 53: South Africa Cancer Biopsy Industry Revenue (Million) Forecast, by Application 2019 & 2032
- Table 54: South Africa Cancer Biopsy Industry Volume (K Unit) Forecast, by Application 2019 & 2032
- Table 55: Rest of Middle East and Africa Cancer Biopsy Industry Revenue (Million) Forecast, by Application 2019 & 2032
- Table 56: Rest of Middle East and Africa Cancer Biopsy Industry Volume (K Unit) Forecast, by Application 2019 & 2032
- Table 57: Global Cancer Biopsy Industry Revenue Million Forecast, by Country 2019 & 2032
- Table 58: Global Cancer Biopsy Industry Volume K Unit Forecast, by Country 2019 & 2032
- Table 59: Brazil Cancer Biopsy Industry Revenue (Million) Forecast, by Application 2019 & 2032
- Table 60: Brazil Cancer Biopsy Industry Volume (K Unit) Forecast, by Application 2019 & 2032
- Table 61: Argentina Cancer Biopsy Industry Revenue (Million) Forecast, by Application 2019 & 2032
- Table 62: Argentina Cancer Biopsy Industry Volume (K Unit) Forecast, by Application 2019 & 2032
- Table 63: Rest of South America Cancer Biopsy Industry Revenue (Million) Forecast, by Application 2019 & 2032
- Table 64: Rest of South America Cancer Biopsy Industry Volume (K Unit) Forecast, by Application 2019 & 2032
- Table 65: Global Cancer Biopsy Industry Revenue Million Forecast, by Product 2019 & 2032
- Table 66: Global Cancer Biopsy Industry Volume K Unit Forecast, by Product 2019 & 2032
- Table 67: Global Cancer Biopsy Industry Revenue Million Forecast, by Type 2019 & 2032
- Table 68: Global Cancer Biopsy Industry Volume K Unit Forecast, by Type 2019 & 2032
- Table 69: Global Cancer Biopsy Industry Revenue Million Forecast, by Application 2019 & 2032
- Table 70: Global Cancer Biopsy Industry Volume K Unit Forecast, by Application 2019 & 2032
- Table 71: Global Cancer Biopsy Industry Revenue Million Forecast, by End User 2019 & 2032
- Table 72: Global Cancer Biopsy Industry Volume K Unit Forecast, by End User 2019 & 2032
- Table 73: Global Cancer Biopsy Industry Revenue Million Forecast, by Country 2019 & 2032
- Table 74: Global Cancer Biopsy Industry Volume K Unit Forecast, by Country 2019 & 2032
- Table 75: United States Cancer Biopsy Industry Revenue (Million) Forecast, by Application 2019 & 2032
- Table 76: United States Cancer Biopsy Industry Volume (K Unit) Forecast, by Application 2019 & 2032
- Table 77: Canada Cancer Biopsy Industry Revenue (Million) Forecast, by Application 2019 & 2032
- Table 78: Canada Cancer Biopsy Industry Volume (K Unit) Forecast, by Application 2019 & 2032
- Table 79: Mexico Cancer Biopsy Industry Revenue (Million) Forecast, by Application 2019 & 2032
- Table 80: Mexico Cancer Biopsy Industry Volume (K Unit) Forecast, by Application 2019 & 2032
- Table 81: Global Cancer Biopsy Industry Revenue Million Forecast, by Product 2019 & 2032
- Table 82: Global Cancer Biopsy Industry Volume K Unit Forecast, by Product 2019 & 2032
- Table 83: Global Cancer Biopsy Industry Revenue Million Forecast, by Type 2019 & 2032
- Table 84: Global Cancer Biopsy Industry Volume K Unit Forecast, by Type 2019 & 2032
- Table 85: Global Cancer Biopsy Industry Revenue Million Forecast, by Application 2019 & 2032
- Table 86: Global Cancer Biopsy Industry Volume K Unit Forecast, by Application 2019 & 2032
- Table 87: Global Cancer Biopsy Industry Revenue Million Forecast, by End User 2019 & 2032
- Table 88: Global Cancer Biopsy Industry Volume K Unit Forecast, by End User 2019 & 2032
- Table 89: Global Cancer Biopsy Industry Revenue Million Forecast, by Country 2019 & 2032
- Table 90: Global Cancer Biopsy Industry Volume K Unit Forecast, by Country 2019 & 2032
- Table 91: Germany Cancer Biopsy Industry Revenue (Million) Forecast, by Application 2019 & 2032
- Table 92: Germany Cancer Biopsy Industry Volume (K Unit) Forecast, by Application 2019 & 2032
- Table 93: United Kingdom Cancer Biopsy Industry Revenue (Million) Forecast, by Application 2019 & 2032
- Table 94: United Kingdom Cancer Biopsy Industry Volume (K Unit) Forecast, by Application 2019 & 2032
- Table 95: France Cancer Biopsy Industry Revenue (Million) Forecast, by Application 2019 & 2032
- Table 96: France Cancer Biopsy Industry Volume (K Unit) Forecast, by Application 2019 & 2032
- Table 97: Italy Cancer Biopsy Industry Revenue (Million) Forecast, by Application 2019 & 2032
- Table 98: Italy Cancer Biopsy Industry Volume (K Unit) Forecast, by Application 2019 & 2032
- Table 99: Spain Cancer Biopsy Industry Revenue (Million) Forecast, by Application 2019 & 2032
- Table 100: Spain Cancer Biopsy Industry Volume (K Unit) Forecast, by Application 2019 & 2032
- Table 101: Rest of Europe Cancer Biopsy Industry Revenue (Million) Forecast, by Application 2019 & 2032
- Table 102: Rest of Europe Cancer Biopsy Industry Volume (K Unit) Forecast, by Application 2019 & 2032
- Table 103: Global Cancer Biopsy Industry Revenue Million Forecast, by Product 2019 & 2032
- Table 104: Global Cancer Biopsy Industry Volume K Unit Forecast, by Product 2019 & 2032
- Table 105: Global Cancer Biopsy Industry Revenue Million Forecast, by Type 2019 & 2032
- Table 106: Global Cancer Biopsy Industry Volume K Unit Forecast, by Type 2019 & 2032
- Table 107: Global Cancer Biopsy Industry Revenue Million Forecast, by Application 2019 & 2032
- Table 108: Global Cancer Biopsy Industry Volume K Unit Forecast, by Application 2019 & 2032
- Table 109: Global Cancer Biopsy Industry Revenue Million Forecast, by End User 2019 & 2032
- Table 110: Global Cancer Biopsy Industry Volume K Unit Forecast, by End User 2019 & 2032
- Table 111: Global Cancer Biopsy Industry Revenue Million Forecast, by Country 2019 & 2032
- Table 112: Global Cancer Biopsy Industry Volume K Unit Forecast, by Country 2019 & 2032
- Table 113: China Cancer Biopsy Industry Revenue (Million) Forecast, by Application 2019 & 2032
- Table 114: China Cancer Biopsy Industry Volume (K Unit) Forecast, by Application 2019 & 2032
- Table 115: Japan Cancer Biopsy Industry Revenue (Million) Forecast, by Application 2019 & 2032
- Table 116: Japan Cancer Biopsy Industry Volume (K Unit) Forecast, by Application 2019 & 2032
- Table 117: India Cancer Biopsy Industry Revenue (Million) Forecast, by Application 2019 & 2032
- Table 118: India Cancer Biopsy Industry Volume (K Unit) Forecast, by Application 2019 & 2032
- Table 119: Australia Cancer Biopsy Industry Revenue (Million) Forecast, by Application 2019 & 2032
- Table 120: Australia Cancer Biopsy Industry Volume (K Unit) Forecast, by Application 2019 & 2032
- Table 121: South Korea Cancer Biopsy Industry Revenue (Million) Forecast, by Application 2019 & 2032
- Table 122: South Korea Cancer Biopsy Industry Volume (K Unit) Forecast, by Application 2019 & 2032
- Table 123: Rest of Asia Pacific Cancer Biopsy Industry Revenue (Million) Forecast, by Application 2019 & 2032
- Table 124: Rest of Asia Pacific Cancer Biopsy Industry Volume (K Unit) Forecast, by Application 2019 & 2032
- Table 125: Global Cancer Biopsy Industry Revenue Million Forecast, by Product 2019 & 2032
- Table 126: Global Cancer Biopsy Industry Volume K Unit Forecast, by Product 2019 & 2032
- Table 127: Global Cancer Biopsy Industry Revenue Million Forecast, by Type 2019 & 2032
- Table 128: Global Cancer Biopsy Industry Volume K Unit Forecast, by Type 2019 & 2032
- Table 129: Global Cancer Biopsy Industry Revenue Million Forecast, by Application 2019 & 2032
- Table 130: Global Cancer Biopsy Industry Volume K Unit Forecast, by Application 2019 & 2032
- Table 131: Global Cancer Biopsy Industry Revenue Million Forecast, by End User 2019 & 2032
- Table 132: Global Cancer Biopsy Industry Volume K Unit Forecast, by End User 2019 & 2032
- Table 133: Global Cancer Biopsy Industry Revenue Million Forecast, by Country 2019 & 2032
- Table 134: Global Cancer Biopsy Industry Volume K Unit Forecast, by Country 2019 & 2032
- Table 135: GCC Cancer Biopsy Industry Revenue (Million) Forecast, by Application 2019 & 2032
- Table 136: GCC Cancer Biopsy Industry Volume (K Unit) Forecast, by Application 2019 & 2032
- Table 137: South Africa Cancer Biopsy Industry Revenue (Million) Forecast, by Application 2019 & 2032
- Table 138: South Africa Cancer Biopsy Industry Volume (K Unit) Forecast, by Application 2019 & 2032
- Table 139: Rest of Middle East and Africa Cancer Biopsy Industry Revenue (Million) Forecast, by Application 2019 & 2032
- Table 140: Rest of Middle East and Africa Cancer Biopsy Industry Volume (K Unit) Forecast, by Application 2019 & 2032
- Table 141: Global Cancer Biopsy Industry Revenue Million Forecast, by Product 2019 & 2032
- Table 142: Global Cancer Biopsy Industry Volume K Unit Forecast, by Product 2019 & 2032
- Table 143: Global Cancer Biopsy Industry Revenue Million Forecast, by Type 2019 & 2032
- Table 144: Global Cancer Biopsy Industry Volume K Unit Forecast, by Type 2019 & 2032
- Table 145: Global Cancer Biopsy Industry Revenue Million Forecast, by Application 2019 & 2032
- Table 146: Global Cancer Biopsy Industry Volume K Unit Forecast, by Application 2019 & 2032
- Table 147: Global Cancer Biopsy Industry Revenue Million Forecast, by End User 2019 & 2032
- Table 148: Global Cancer Biopsy Industry Volume K Unit Forecast, by End User 2019 & 2032
- Table 149: Global Cancer Biopsy Industry Revenue Million Forecast, by Country 2019 & 2032
- Table 150: Global Cancer Biopsy Industry Volume K Unit Forecast, by Country 2019 & 2032
- Table 151: Brazil Cancer Biopsy Industry Revenue (Million) Forecast, by Application 2019 & 2032
- Table 152: Brazil Cancer Biopsy Industry Volume (K Unit) Forecast, by Application 2019 & 2032
- Table 153: Argentina Cancer Biopsy Industry Revenue (Million) Forecast, by Application 2019 & 2032
- Table 154: Argentina Cancer Biopsy Industry Volume (K Unit) Forecast, by Application 2019 & 2032
- Table 155: Rest of South America Cancer Biopsy Industry Revenue (Million) Forecast, by Application 2019 & 2032
- Table 156: Rest of South America Cancer Biopsy Industry Volume (K Unit) Forecast, by Application 2019 & 2032
Frequently Asked Questions
1. What is the projected Compound Annual Growth Rate (CAGR) of the Cancer Biopsy Industry?
The projected CAGR is approximately 11.46%.
2. Which companies are prominent players in the Cancer Biopsy Industry?
Key companies in the market include Becton Dickinson and Company, Myriad Genetics Inc, BIOCEPT INC, Hologic Inc, ANGLE PLC, Danaher Corporation, Agilent Technologies Inc, Lucence Diagnostics Pte Ltd, Sysmex Corporation, MDx Health, Illumina Inc, Thermo Fisher Scientific, QIAGEN.
3. What are the main segments of the Cancer Biopsy Industry?
The market segments include Product, Type, Application, End User.
4. Can you provide details about the market size?
The market size is estimated to be USD 29.93 Million as of 2022.
5. What are some drivers contributing to market growth?
Rising Burden of Oncology Disorders and Increase in Adoption of Liquid Biopsies; Advancement in Technologies; Rising Awareness on Inherited Oncology Disorders and Genetic Testing.
6. What are the notable trends driving market growth?
Breast Cancer Segment is Expected to Grow During the Forecast Period.
7. Are there any restraints impacting market growth?
Associated Risks with Biopsy Procedures.
8. Can you provide examples of recent developments in the market?
In August 2022, Guardant Health gained US FDA approval for its Guardant360 CDx liquid biopsy test as a companion diagnostic (CDx) to choose patients with unresectable or metastatic HER2-mutant non-small cell lung cancer (NSCLC) with tumors that have activating HER2 (ERBB2) mutations for treatment with ENHERTU (fam-trastuzumab deruxtecan-nxki).
9. What pricing options are available for accessing the report?
Pricing options include single-user, multi-user, and enterprise licenses priced at USD 4750, USD 5250, and USD 8750 respectively.
10. Is the market size provided in terms of value or volume?
The market size is provided in terms of value, measured in Million and volume, measured in K Unit.
11. Are there any specific market keywords associated with the report?
Yes, the market keyword associated with the report is "Cancer Biopsy Industry," which aids in identifying and referencing the specific market segment covered.
12. How do I determine which pricing option suits my needs best?
The pricing options vary based on user requirements and access needs. Individual users may opt for single-user licenses, while businesses requiring broader access may choose multi-user or enterprise licenses for cost-effective access to the report.
13. Are there any additional resources or data provided in the Cancer Biopsy Industry report?
While the report offers comprehensive insights, it's advisable to review the specific contents or supplementary materials provided to ascertain if additional resources or data are available.
14. How can I stay updated on further developments or reports in the Cancer Biopsy Industry?
To stay informed about further developments, trends, and reports in the Cancer Biopsy Industry, consider subscribing to industry newsletters, following relevant companies and organizations, or regularly checking reputable industry news sources and publications.
Methodology
Step 1 - Identification of Relevant Samples Size from Population Database


Step 2 - Approaches for Defining Global Market Size (Value, Volume* & Price*)

Note*: In applicable scenarios
Step 3 - Data Sources
Primary Research
- Web Analytics
- Survey Reports
- Research Institute
- Latest Research Reports
- Opinion Leaders
Secondary Research
- Annual Reports
- White Paper
- Latest Press Release
- Industry Association
- Paid Database
- Investor Presentations

Step 4 - Data Triangulation
Involves using different sources of information in order to increase the validity of a study
These sources are likely to be stakeholders in a program - participants, other researchers, program staff, other community members, and so on.
Then we put all data in single framework & apply various statistical tools to find out the dynamic on the market.
During the analysis stage, feedback from the stakeholder groups would be compared to determine areas of agreement as well as areas of divergence
