

Key Insights
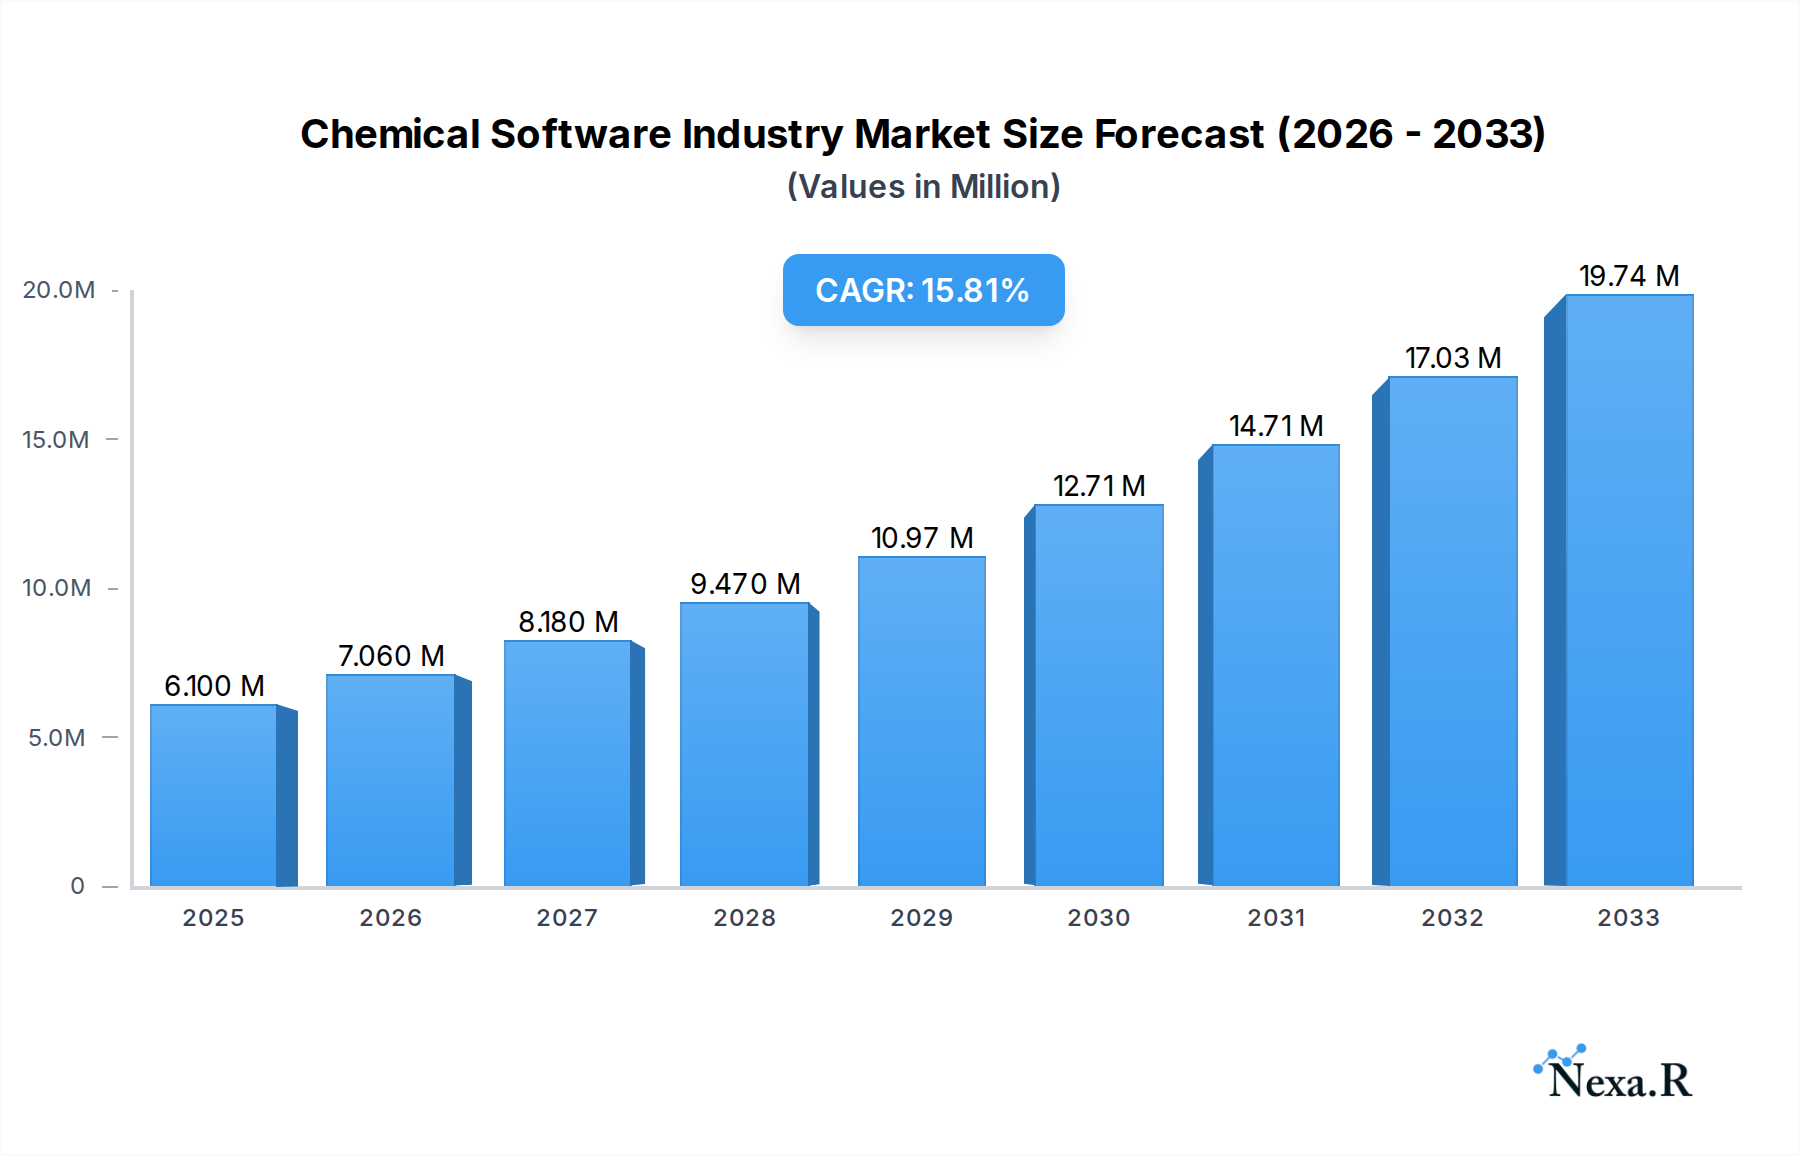
The global Chemical Software industry is poised for substantial expansion, with a projected market size of USD 6.10 Million and a robust CAGR of 15.50% from 2025 to 2033. This significant growth is fueled by an increasing demand for advanced computational tools in chemical analysis, drug discovery, and virtual screening. The burgeoning need for sophisticated chemical databases, precise chemometrics, and accurate molecular modeling is driving innovation and adoption of these software solutions. Furthermore, the pharmaceutical and biotechnology sectors are heavily investing in these technologies to accelerate the drug discovery and validation processes, leading to a greater reliance on chemical software for identifying potential drug candidates and predicting their efficacy and safety. The expansion of virtual screening capabilities, which allows for the rapid in-silico evaluation of vast compound libraries, also presents a key growth avenue.

Chemical Software Industry Market Size (In Million)
Several factors are contributing to this upward trajectory. The relentless pursuit of novel therapeutics and advanced materials necessitates more efficient and accurate computational approaches. As researchers aim to reduce the time and cost associated with traditional R&D methods, the adoption of chemical software becomes imperative. While the market demonstrates strong growth, certain restraints may emerge, such as the high initial investment costs for sophisticated software packages and the need for specialized expertise to operate them effectively. However, the continuous development of user-friendly interfaces and cloud-based solutions is expected to mitigate these challenges. Geographically, North America and Europe are likely to lead the market, driven by established research infrastructure and significant R&D spending in the life sciences and chemical industries. The Asia Pacific region, particularly China and India, is expected to witness rapid growth due to increasing investments in research and development and a growing pharmaceutical manufacturing base.
Chemical Software Industry Company Market Share
Unlocking Innovation: The Definitive Chemical Software Industry Report 2024-2033
This comprehensive report provides an in-depth analysis of the global Chemical Software Industry, a rapidly evolving sector critical for advancements in drug discovery, chemical analysis, and virtual screening. Dive into market dynamics, growth trends, regional dominance, and the product landscape, with a focus on key applications like chemical databases, chemometrics, and molecular modelling. We explore the intricate interplay of parent and child markets, revealing opportunities for strategic growth and investment across the 2019-2033 study period, with a base and estimated year of 2025 and a forecast period of 2025-2033.
Chemical Software Industry Market Dynamics & Structure
The chemical software market exhibits a moderate to high concentration, driven by a handful of dominant players and specialized niche providers. Technological innovation is the primary catalyst, fueled by advancements in artificial intelligence (AI), machine learning (ML), and high-performance computing (HPC), accelerating drug discovery and validation and enhancing chemical analysis. Regulatory frameworks, particularly in pharmaceuticals and environmental monitoring, play a crucial role in shaping software development and adoption. Competitive product substitutes, such as in-house developed tools or more generalized scientific software, exist but are often outpaced by specialized cheminformatics and computational chemistry solutions. End-user demographics span academic institutions, pharmaceutical and biotechnology companies, and chemical manufacturers, each with unique needs and purchasing behaviors. Mergers and acquisitions (M&A) are a significant trend, consolidating market share and fostering innovation. For instance, the strategic acquisition of OpenEye Scientific Software by Cadence Design Systems Inc. in 2021 (estimated deal value in millions of USD: $xx) underscores this consolidation. Innovation barriers include the high cost of R&D for cutting-edge algorithms and the complexity of integrating new software with existing legacy systems.
Chemical Software Industry Growth Trends & Insights
The chemical software industry is poised for robust growth, projected to expand at a significant Compound Annual Growth Rate (CAGR) of ~12.5% from 2025 to 2033, reaching an estimated market size of $18,500 million by 2033. This expansion is fueled by increasing investments in drug discovery and validation, where molecular modeling and virtual screening software are indispensable for identifying novel drug candidates and optimizing their efficacy. The adoption rates for advanced computational chemistry software are accelerating, driven by the need for faster, more efficient research and development cycles. Technological disruptions, such as the integration of AI and ML into predictive analytics for chemical reactions and material properties, are fundamentally reshaping the industry. Consumer behavior is shifting towards cloud-based solutions for enhanced accessibility, scalability, and collaboration, particularly within the chemical databases and chemometrics segments. Market penetration is deepest in North America and Europe due to strong pharmaceutical R&D ecosystems and government funding for scientific research. Emerging economies are also showing increased adoption, driven by a growing focus on localized pharmaceutical manufacturing and material science innovation. The shift towards data-driven research methodologies further solidifies the demand for sophisticated chemical software solutions.
Dominant Regions, Countries, or Segments in Chemical Software Industry
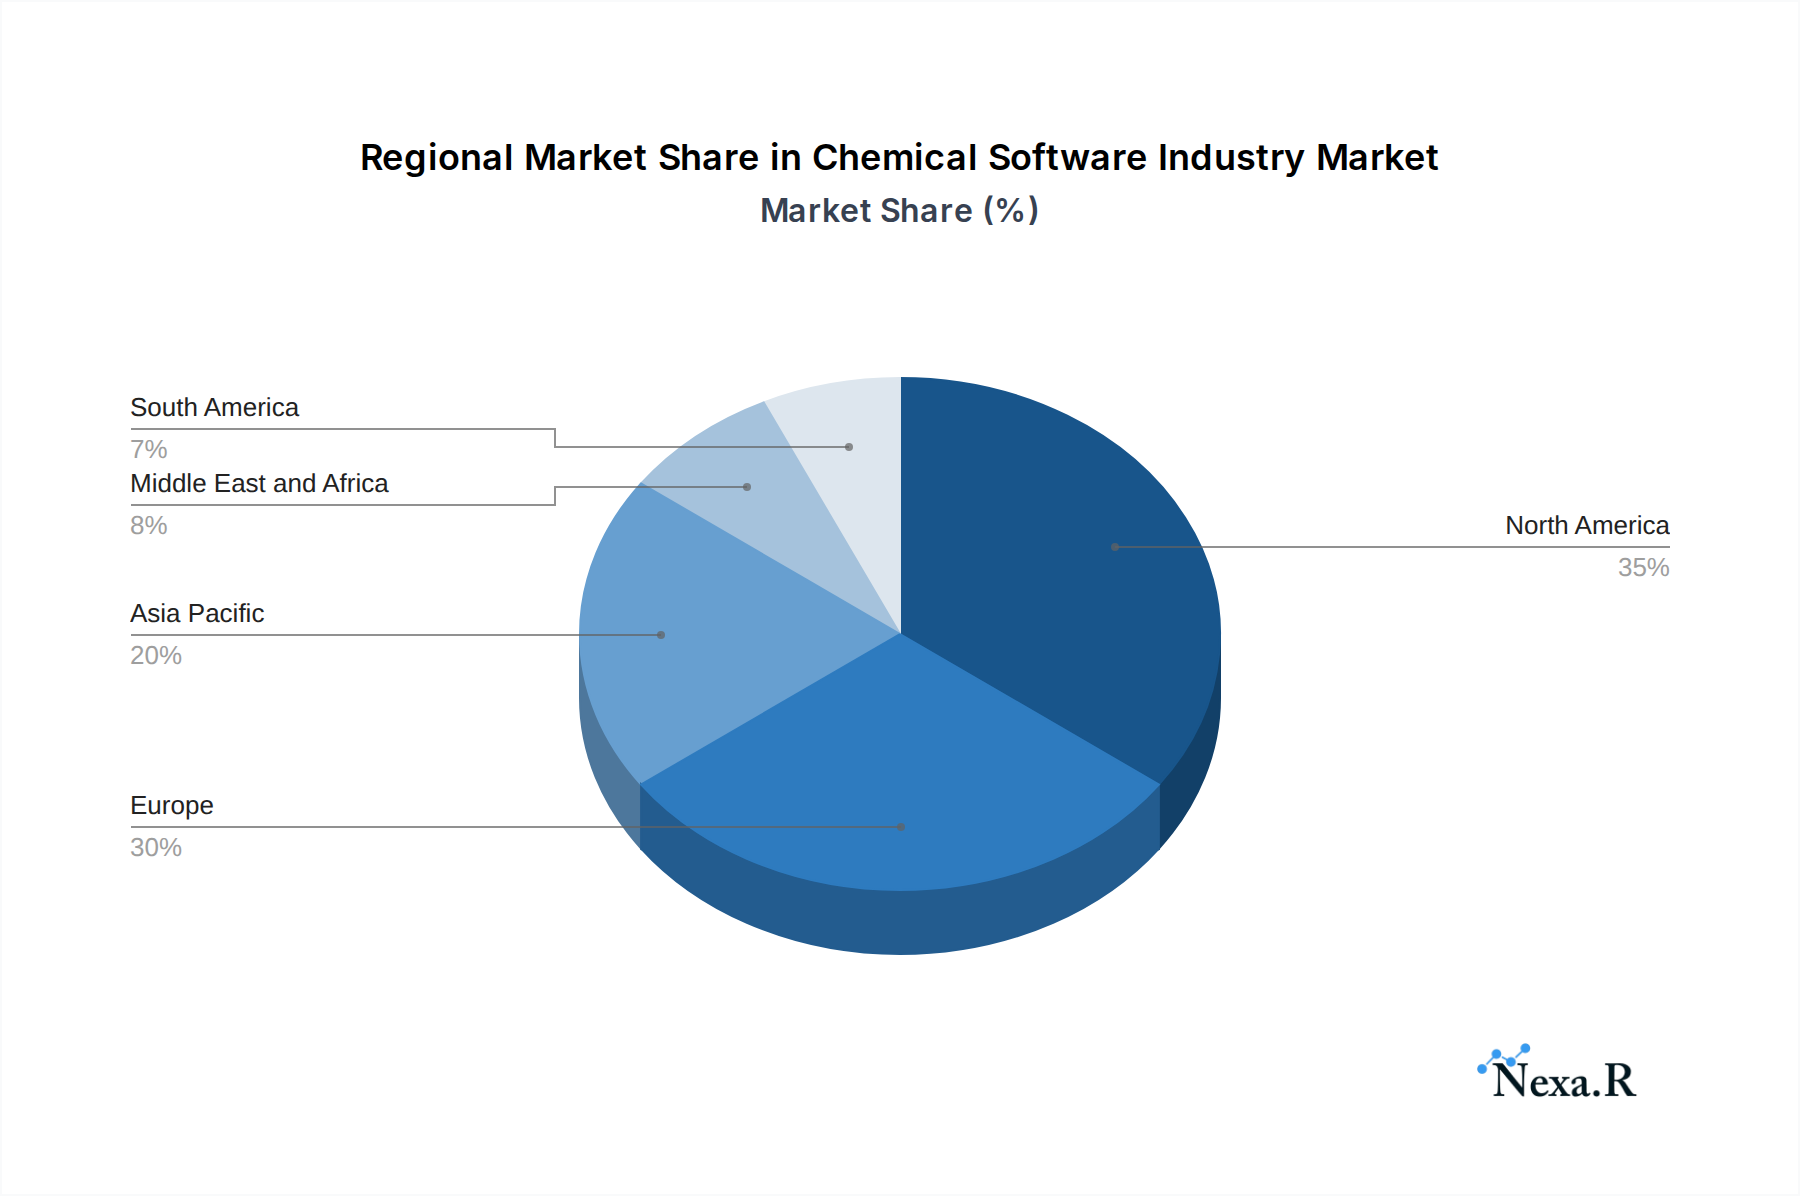
The Drug Discovery and Validation segment is the undisputed leader in the chemical software industry, commanding an estimated market share of 45% in 2025, projected to grow to 50% by 2033. This dominance is primarily driven by the insatiable global demand for novel therapeutics, coupled with the increasing complexity of biological targets and the need for precision medicine. Within this segment, molecular modelling and virtual screening applications are the most significant growth drivers, experiencing a CAGR of ~13.2%. North America, particularly the United States, stands as the leading region, accounting for approximately 35% of the global market share in 2025. This leadership is attributed to its robust pharmaceutical and biotechnology R&D infrastructure, substantial private and public funding for drug development, and the presence of leading chemical software vendors like Schrödinger Inc. and Cadence Design Systems Inc. (OpenEye Scientific Software Inc.).
Key Drivers in Drug Discovery and Validation:
- Increased R&D Spending: Global pharmaceutical R&D expenditure is projected to reach $250,000 million by 2028, directly fueling demand for advanced drug discovery software.
- Biologics and Personalized Medicine Trends: The rise of complex biologics and personalized medicine necessitates sophisticated computational tools for design and optimization.
- AI/ML Integration: The application of AI/ML in drug discovery is accelerating target identification, lead optimization, and preclinical testing, boosting software adoption.
- Patent Expirations and Generic Competition: Pharmaceutical companies are investing heavily in R&D to replenish their pipelines and counter generic competition.
Dominance Factors:
- Market Share: The Drug Discovery and Validation segment is projected to be valued at $8,325 million in 2025, growing to an estimated $12,375 million by 2033.
- Growth Potential: The segment's high growth rate is driven by unmet medical needs and the lucrative nature of successful drug development.
- Innovation Hubs: The concentration of leading pharmaceutical companies and research institutions in North America and Europe fosters rapid adoption of new chemical software technologies.
- Academic Research: Strong academic research in computational chemistry and bioinformatics provides a constant stream of talent and innovation for the industry.
While Drug Discovery and Validation leads, Chemical Analysis, particularly Chemical Databases and Molecular Modelling, also demonstrates significant growth. The Chemical Analysis segment is expected to grow at a CAGR of ~11.8%, driven by environmental regulations, quality control demands, and materials science research. The Virtual Screening segment, though smaller, is experiencing rapid expansion due to its crucial role in accelerating the initial stages of drug discovery.
Chemical Software Industry Product Landscape
The chemical software industry is characterized by a dynamic product landscape driven by continuous innovation in cheminformatics, computational chemistry, and AI/ML integration. Key product developments include advanced platforms for molecular modeling, offering enhanced accuracy and speed in predicting molecular properties and interactions, crucial for drug discovery and validation. Furthermore, intelligent chemical databases are evolving to incorporate sophisticated search algorithms and AI-driven data analytics, enabling researchers to efficiently mine vast datasets. Specialized software for virtual screening leverages machine learning to rapidly assess millions of compounds, significantly reducing the time and cost associated with identifying promising drug candidates. The integration of cloud-based solutions is also a prominent trend, providing researchers with scalable computing power and collaborative environments for complex chemical analyses.
Key Drivers, Barriers & Challenges in Chemical Software Industry
The chemical software industry is propelled by several key drivers, including the escalating demand for accelerated drug discovery and validation, driven by global health needs and pharmaceutical pipeline replenishment. Advancements in AI and machine learning are revolutionizing computational chemistry, enabling more accurate predictions and faster screening processes. Increased R&D investments across the pharmaceutical, biotechnology, and chemical sectors also significantly fuel market growth.
- Key Drivers:
- Pharmaceutical R&D Pipeline Needs
- AI/ML Advancements in Predictive Chemistry
- Growth in Biotechnology and Life Sciences Sector
- Need for Efficient Chemical Analysis and Material Design
Conversely, the industry faces substantial barriers and challenges. The high cost of developing and acquiring sophisticated software solutions can be a significant restraint for smaller research organizations. Integration challenges with existing legacy systems and the need for specialized expertise to operate complex software also pose hurdles.
- Key Barriers & Challenges:
- High Software Acquisition and Implementation Costs
- Data Integration Complexity with Legacy Systems
- Shortage of Skilled Computational Chemists and Cheminformaticians
- Stringent Data Security and Intellectual Property Concerns
- Regulatory Compliance and Validation Requirements
Emerging Opportunities in Chemical Software Industry
Emerging opportunities within the chemical software industry lie in the untapped potential of AI-driven predictive toxicology and ADMET (Absorption, Distribution, Metabolism, Excretion, and Toxicity) profiling for early-stage drug safety assessment. The growing emphasis on sustainable chemistry and green manufacturing presents a significant opportunity for software that can optimize reaction pathways for reduced waste and energy consumption. Furthermore, the development of user-friendly, low-code/no-code platforms for cheminformatics and molecular modeling can democratize access to these powerful tools, expanding the market beyond highly specialized users. The increasing adoption of cloud-based, collaborative research platforms also opens avenues for enhanced data sharing and joint innovation.
Growth Accelerators in the Chemical Software Industry Industry
Several catalysts are accelerating the long-term growth of the chemical software industry. The continuous integration of advanced AI and machine learning algorithms into existing software, enabling more sophisticated predictive capabilities for molecular design and material science, is a primary growth accelerator. Strategic partnerships between software vendors and pharmaceutical/biotechnology companies, facilitating co-development and tailored solutions, are also vital. Furthermore, the expansion of cloud computing infrastructure provides the necessary scalability and accessibility for complex computational tasks, driving broader adoption. Government initiatives promoting scientific research and innovation, particularly in areas like personalized medicine and advanced materials, also act as significant growth enhancers.
Key Players Shaping the Chemical Software Industry Market
- Chemaxon Ltd
- BioSolveIT GmbH
- Chemical Computing Group ULC
- Molecular Discovery Ltd
- Scilligence
- Collaborative Drug Discovery Inc
- Jubilant Biosys Ltd
- Cadence Design Systems Inc (OpenEye Scientific Software Inc)
- Schrödinger Inc
- Dassault Systemes
Notable Milestones in Chemical Software Industry Sector
- October 2023: Cadence Molecular Sciences (OpenEye) announced an agreement with Pfizer Inc. to extend and expand access to Cadence products and programming toolkits for advanced molecular design, emphasizing Cadence's physics-and AI-based modeling and cheminformatics computational software as an enabler of early-stage drug discovery innovation.
- June 2023: Vox Biomedical announced receiving a program from the National Institute of General Medical Sciences (NIGMS) to develop an artificial intelligence-based chemical identification library for identifying volatile organic compounds (VOCs) using a gas chromatography and differential mobility spectrometry (GC-DMS) technique, highlighting the growing role of AI in chemical analysis.
In-Depth Chemical Software Industry Market Outlook
The chemical software industry is set for sustained and accelerated growth, driven by a confluence of technological advancements and evolving market demands. The continued integration of AI and machine learning into drug discovery and validation and chemical analysis workflows will unlock unprecedented levels of predictive accuracy and efficiency. The increasing adoption of cloud-based solutions will foster greater collaboration and accessibility, democratizing access to sophisticated computational tools. Strategic partnerships and the development of specialized applications for niche areas like sustainable chemistry and personalized medicine will further diversify and expand the market. Companies that can offer integrated, scalable, and AI-powered solutions will be best positioned to capitalize on the immense future potential of this dynamic sector.
Chemical Software Industry Segmentation
-
1. Application
-
1.1. Chemical Analysis
- 1.1.1. Chemical Databases
- 1.1.2. Chemometrics
- 1.1.3. Molecular Modelling
- 1.1.4. Other Chemical Analysis
- 1.2. Drug Discovery and Validation
- 1.3. Virtual Screening
- 1.4. Other Applications
-
1.1. Chemical Analysis
Chemical Software Industry Segmentation By Geography
-
1. North America
- 1.1. United States
- 1.2. Canada
- 1.3. Mexico
-
2. Europe
- 2.1. Germany
- 2.2. United Kingdom
- 2.3. France
- 2.4. Italy
- 2.5. Spain
- 2.6. Rest of Europe
-
3. Asia Pacific
- 3.1. China
- 3.2. Japan
- 3.3. India
- 3.4. Australia
- 3.5. South Korea
- 3.6. Rest of Asia Pacific
-
4. Middle East and Africa
- 4.1. GCC
- 4.2. South Africa
- 4.3. Rest of Middle East and Africa
-
5. South America
- 5.1. Brazil
- 5.2. Argentina
- 5.3. Rest of South America
Chemical Software Industry Regional Market Share
Geographic Coverage of Chemical Software Industry
Chemical Software Industry REPORT HIGHLIGHTS
| Aspects | Details |
|---|---|
| Study Period | 2020-2034 |
| Base Year | 2025 |
| Estimated Year | 2026 |
| Forecast Period | 2026-2034 |
| Historical Period | 2020-2025 |
| Growth Rate | CAGR of 15.50% from 2020-2034 |
| Segmentation |
|
Table of Contents
- 1. Introduction
- 1.1. Research Scope
- 1.2. Market Segmentation
- 1.3. Research Objective
- 1.4. Definitions and Assumptions
- 2. Executive Summary
- 2.1. Market Snapshot
- 3. Market Dynamics
- 3.1. Market Drivers
- 3.2. Market Restrains
- 3.3. Market Trends
- 3.4. Market Opportunities
- 4. Market Factor Analysis
- 4.1. Porters Five Forces
- 4.1.1. Bargaining Power of Suppliers
- 4.1.2. Bargaining Power of Buyers
- 4.1.3. Threat of New Entrants
- 4.1.4. Threat of Substitutes
- 4.1.5. Competitive Rivalry
- 4.2. PESTEL analysis
- 4.3. BCG Analysis
- 4.3.1. Stars (High Growth, High Market Share)
- 4.3.2. Cash Cows (Low Growth, High Market Share)
- 4.3.3. Question Mark (High Growth, Low Market Share)
- 4.3.4. Dogs (Low Growth, Low Market Share)
- 4.4. Ansoff Matrix Analysis
- 4.5. Supply Chain Analysis
- 4.6. Regulatory Landscape
- 4.7. Current Market Potential and Opportunity Assessment (TAM–SAM–SOM Framework)
- 4.8. NRP Analyst Note
- 4.1. Porters Five Forces
- 5. Market Analysis, Insights and Forecast 2021-2033
- 5.1. Market Analysis, Insights and Forecast - by Application
- 5.1.1. Chemical Analysis
- 5.1.1.1. Chemical Databases
- 5.1.1.2. Chemometrics
- 5.1.1.3. Molecular Modelling
- 5.1.1.4. Other Chemical Analysis
- 5.1.2. Drug Discovery and Validation
- 5.1.3. Virtual Screening
- 5.1.4. Other Applications
- 5.1.1. Chemical Analysis
- 5.2. Market Analysis, Insights and Forecast - by Region
- 5.2.1. North America
- 5.2.2. Europe
- 5.2.3. Asia Pacific
- 5.2.4. Middle East and Africa
- 5.2.5. South America
- 5.1. Market Analysis, Insights and Forecast - by Application
- 6. Global Chemical Software Industry Analysis, Insights and Forecast, 2021-2033
- 6.1. Market Analysis, Insights and Forecast - by Application
- 6.1.1. Chemical Analysis
- 6.1.1.1. Chemical Databases
- 6.1.1.2. Chemometrics
- 6.1.1.3. Molecular Modelling
- 6.1.1.4. Other Chemical Analysis
- 6.1.2. Drug Discovery and Validation
- 6.1.3. Virtual Screening
- 6.1.4. Other Applications
- 6.1.1. Chemical Analysis
- 6.1. Market Analysis, Insights and Forecast - by Application
- 7. North America Chemical Software Industry Analysis, Insights and Forecast, 2020-2032
- 7.1. Market Analysis, Insights and Forecast - by Application
- 7.1.1. Chemical Analysis
- 7.1.1.1. Chemical Databases
- 7.1.1.2. Chemometrics
- 7.1.1.3. Molecular Modelling
- 7.1.1.4. Other Chemical Analysis
- 7.1.2. Drug Discovery and Validation
- 7.1.3. Virtual Screening
- 7.1.4. Other Applications
- 7.1.1. Chemical Analysis
- 7.1. Market Analysis, Insights and Forecast - by Application
- 8. Europe Chemical Software Industry Analysis, Insights and Forecast, 2020-2032
- 8.1. Market Analysis, Insights and Forecast - by Application
- 8.1.1. Chemical Analysis
- 8.1.1.1. Chemical Databases
- 8.1.1.2. Chemometrics
- 8.1.1.3. Molecular Modelling
- 8.1.1.4. Other Chemical Analysis
- 8.1.2. Drug Discovery and Validation
- 8.1.3. Virtual Screening
- 8.1.4. Other Applications
- 8.1.1. Chemical Analysis
- 8.1. Market Analysis, Insights and Forecast - by Application
- 9. Asia Pacific Chemical Software Industry Analysis, Insights and Forecast, 2020-2032
- 9.1. Market Analysis, Insights and Forecast - by Application
- 9.1.1. Chemical Analysis
- 9.1.1.1. Chemical Databases
- 9.1.1.2. Chemometrics
- 9.1.1.3. Molecular Modelling
- 9.1.1.4. Other Chemical Analysis
- 9.1.2. Drug Discovery and Validation
- 9.1.3. Virtual Screening
- 9.1.4. Other Applications
- 9.1.1. Chemical Analysis
- 9.1. Market Analysis, Insights and Forecast - by Application
- 10. Middle East and Africa Chemical Software Industry Analysis, Insights and Forecast, 2020-2032
- 10.1. Market Analysis, Insights and Forecast - by Application
- 10.1.1. Chemical Analysis
- 10.1.1.1. Chemical Databases
- 10.1.1.2. Chemometrics
- 10.1.1.3. Molecular Modelling
- 10.1.1.4. Other Chemical Analysis
- 10.1.2. Drug Discovery and Validation
- 10.1.3. Virtual Screening
- 10.1.4. Other Applications
- 10.1.1. Chemical Analysis
- 10.1. Market Analysis, Insights and Forecast - by Application
- 11. South America Chemical Software Industry Analysis, Insights and Forecast, 2020-2032
- 11.1. Market Analysis, Insights and Forecast - by Application
- 11.1.1. Chemical Analysis
- 11.1.1.1. Chemical Databases
- 11.1.1.2. Chemometrics
- 11.1.1.3. Molecular Modelling
- 11.1.1.4. Other Chemical Analysis
- 11.1.2. Drug Discovery and Validation
- 11.1.3. Virtual Screening
- 11.1.4. Other Applications
- 11.1.1. Chemical Analysis
- 11.1. Market Analysis, Insights and Forecast - by Application
- 12. Competitive Analysis
- 12.1. Company Profiles
- 12.1.1 Chemaxon Ltd
- 12.1.1.1. Company Overview
- 12.1.1.2. Products
- 12.1.1.3. Company Financials
- 12.1.1.4. SWOT Analysis
- 12.1.2 BioSolveIT GmbH
- 12.1.2.1. Company Overview
- 12.1.2.2. Products
- 12.1.2.3. Company Financials
- 12.1.2.4. SWOT Analysis
- 12.1.3 Chemical Computing Group ULC
- 12.1.3.1. Company Overview
- 12.1.3.2. Products
- 12.1.3.3. Company Financials
- 12.1.3.4. SWOT Analysis
- 12.1.4 Molecular Discovery Ltd
- 12.1.4.1. Company Overview
- 12.1.4.2. Products
- 12.1.4.3. Company Financials
- 12.1.4.4. SWOT Analysis
- 12.1.5 Scilligence
- 12.1.5.1. Company Overview
- 12.1.5.2. Products
- 12.1.5.3. Company Financials
- 12.1.5.4. SWOT Analysis
- 12.1.6 Collaborative Drug Discovery Inc
- 12.1.6.1. Company Overview
- 12.1.6.2. Products
- 12.1.6.3. Company Financials
- 12.1.6.4. SWOT Analysis
- 12.1.7 Jubilant Biosys Ltd
- 12.1.7.1. Company Overview
- 12.1.7.2. Products
- 12.1.7.3. Company Financials
- 12.1.7.4. SWOT Analysis
- 12.1.8 Cadence Design Systems Inc (OpenEye Scientific Software Inc )
- 12.1.8.1. Company Overview
- 12.1.8.2. Products
- 12.1.8.3. Company Financials
- 12.1.8.4. SWOT Analysis
- 12.1.9 Schrödinger Inc
- 12.1.9.1. Company Overview
- 12.1.9.2. Products
- 12.1.9.3. Company Financials
- 12.1.9.4. SWOT Analysis
- 12.1.10 Dassault Systemes
- 12.1.10.1. Company Overview
- 12.1.10.2. Products
- 12.1.10.3. Company Financials
- 12.1.10.4. SWOT Analysis
- 12.1.1 Chemaxon Ltd
- 12.2. Market Entropy
- 12.2.1 Company's Key Areas Served
- 12.2.2 Recent Developments
- 12.3. Company Market Share Analysis 2025
- 12.3.1 Top 5 Companies Market Share Analysis
- 12.3.2 Top 3 Companies Market Share Analysis
- 12.4. List of Potential Customers
- 13. Research Methodology
List of Figures
- Figure 1: Global Chemical Software Industry Revenue Breakdown (Million, %) by Region 2025 & 2033
- Figure 2: North America Chemical Software Industry Revenue (Million), by Application 2025 & 2033
- Figure 3: North America Chemical Software Industry Revenue Share (%), by Application 2025 & 2033
- Figure 4: North America Chemical Software Industry Revenue (Million), by Country 2025 & 2033
- Figure 5: North America Chemical Software Industry Revenue Share (%), by Country 2025 & 2033
- Figure 6: Europe Chemical Software Industry Revenue (Million), by Application 2025 & 2033
- Figure 7: Europe Chemical Software Industry Revenue Share (%), by Application 2025 & 2033
- Figure 8: Europe Chemical Software Industry Revenue (Million), by Country 2025 & 2033
- Figure 9: Europe Chemical Software Industry Revenue Share (%), by Country 2025 & 2033
- Figure 10: Asia Pacific Chemical Software Industry Revenue (Million), by Application 2025 & 2033
- Figure 11: Asia Pacific Chemical Software Industry Revenue Share (%), by Application 2025 & 2033
- Figure 12: Asia Pacific Chemical Software Industry Revenue (Million), by Country 2025 & 2033
- Figure 13: Asia Pacific Chemical Software Industry Revenue Share (%), by Country 2025 & 2033
- Figure 14: Middle East and Africa Chemical Software Industry Revenue (Million), by Application 2025 & 2033
- Figure 15: Middle East and Africa Chemical Software Industry Revenue Share (%), by Application 2025 & 2033
- Figure 16: Middle East and Africa Chemical Software Industry Revenue (Million), by Country 2025 & 2033
- Figure 17: Middle East and Africa Chemical Software Industry Revenue Share (%), by Country 2025 & 2033
- Figure 18: South America Chemical Software Industry Revenue (Million), by Application 2025 & 2033
- Figure 19: South America Chemical Software Industry Revenue Share (%), by Application 2025 & 2033
- Figure 20: South America Chemical Software Industry Revenue (Million), by Country 2025 & 2033
- Figure 21: South America Chemical Software Industry Revenue Share (%), by Country 2025 & 2033
List of Tables
- Table 1: Global Chemical Software Industry Revenue Million Forecast, by Application 2020 & 2033
- Table 2: Global Chemical Software Industry Revenue Million Forecast, by Region 2020 & 2033
- Table 3: Global Chemical Software Industry Revenue Million Forecast, by Application 2020 & 2033
- Table 4: Global Chemical Software Industry Revenue Million Forecast, by Country 2020 & 2033
- Table 5: United States Chemical Software Industry Revenue (Million) Forecast, by Application 2020 & 2033
- Table 6: Canada Chemical Software Industry Revenue (Million) Forecast, by Application 2020 & 2033
- Table 7: Mexico Chemical Software Industry Revenue (Million) Forecast, by Application 2020 & 2033
- Table 8: Global Chemical Software Industry Revenue Million Forecast, by Application 2020 & 2033
- Table 9: Global Chemical Software Industry Revenue Million Forecast, by Country 2020 & 2033
- Table 10: Germany Chemical Software Industry Revenue (Million) Forecast, by Application 2020 & 2033
- Table 11: United Kingdom Chemical Software Industry Revenue (Million) Forecast, by Application 2020 & 2033
- Table 12: France Chemical Software Industry Revenue (Million) Forecast, by Application 2020 & 2033
- Table 13: Italy Chemical Software Industry Revenue (Million) Forecast, by Application 2020 & 2033
- Table 14: Spain Chemical Software Industry Revenue (Million) Forecast, by Application 2020 & 2033
- Table 15: Rest of Europe Chemical Software Industry Revenue (Million) Forecast, by Application 2020 & 2033
- Table 16: Global Chemical Software Industry Revenue Million Forecast, by Application 2020 & 2033
- Table 17: Global Chemical Software Industry Revenue Million Forecast, by Country 2020 & 2033
- Table 18: China Chemical Software Industry Revenue (Million) Forecast, by Application 2020 & 2033
- Table 19: Japan Chemical Software Industry Revenue (Million) Forecast, by Application 2020 & 2033
- Table 20: India Chemical Software Industry Revenue (Million) Forecast, by Application 2020 & 2033
- Table 21: Australia Chemical Software Industry Revenue (Million) Forecast, by Application 2020 & 2033
- Table 22: South Korea Chemical Software Industry Revenue (Million) Forecast, by Application 2020 & 2033
- Table 23: Rest of Asia Pacific Chemical Software Industry Revenue (Million) Forecast, by Application 2020 & 2033
- Table 24: Global Chemical Software Industry Revenue Million Forecast, by Application 2020 & 2033
- Table 25: Global Chemical Software Industry Revenue Million Forecast, by Country 2020 & 2033
- Table 26: GCC Chemical Software Industry Revenue (Million) Forecast, by Application 2020 & 2033
- Table 27: South Africa Chemical Software Industry Revenue (Million) Forecast, by Application 2020 & 2033
- Table 28: Rest of Middle East and Africa Chemical Software Industry Revenue (Million) Forecast, by Application 2020 & 2033
- Table 29: Global Chemical Software Industry Revenue Million Forecast, by Application 2020 & 2033
- Table 30: Global Chemical Software Industry Revenue Million Forecast, by Country 2020 & 2033
- Table 31: Brazil Chemical Software Industry Revenue (Million) Forecast, by Application 2020 & 2033
- Table 32: Argentina Chemical Software Industry Revenue (Million) Forecast, by Application 2020 & 2033
- Table 33: Rest of South America Chemical Software Industry Revenue (Million) Forecast, by Application 2020 & 2033
Frequently Asked Questions
1. What is the projected Compound Annual Growth Rate (CAGR) of the Chemical Software Industry?
The projected CAGR is approximately 15.50%.
2. Which companies are prominent players in the Chemical Software Industry?
Key companies in the market include Chemaxon Ltd, BioSolveIT GmbH, Chemical Computing Group ULC, Molecular Discovery Ltd, Scilligence, Collaborative Drug Discovery Inc, Jubilant Biosys Ltd, Cadence Design Systems Inc (OpenEye Scientific Software Inc ), Schrödinger Inc, Dassault Systemes.
3. What are the main segments of the Chemical Software Industry?
The market segments include Application.
4. Can you provide details about the market size?
The market size is estimated to be USD 6.10 Million as of 2022.
5. What are some drivers contributing to market growth?
Innovations and Advancements in the Drug Development Process; Increased Demand of Personalized Medicine.
6. What are the notable trends driving market growth?
Virtual Screening Segment is Expected to Witness Growth in the Market Over the Forecast Period.
7. Are there any restraints impacting market growth?
Lack of Skilled Labors.
8. Can you provide examples of recent developments in the market?
In October 2023, Cadence Molecular Sciences (OpenEye) announced that Pfizer Inc. has signed an agreement to extend and expand access to Cadence products and programming toolkits for advanced molecular design. Cadence Molecular Sciences’ physics-and AI-based modelling and cheminformatics computational software is an enabler of early-stage drug discovery innovation.
9. What pricing options are available for accessing the report?
Pricing options include single-user, multi-user, and enterprise licenses priced at USD 4750, USD 5250, and USD 8750 respectively.
10. Is the market size provided in terms of value or volume?
The market size is provided in terms of value, measured in Million.
11. Are there any specific market keywords associated with the report?
Yes, the market keyword associated with the report is "Chemical Software Industry," which aids in identifying and referencing the specific market segment covered.
12. How do I determine which pricing option suits my needs best?
The pricing options vary based on user requirements and access needs. Individual users may opt for single-user licenses, while businesses requiring broader access may choose multi-user or enterprise licenses for cost-effective access to the report.
13. Are there any additional resources or data provided in the Chemical Software Industry report?
While the report offers comprehensive insights, it's advisable to review the specific contents or supplementary materials provided to ascertain if additional resources or data are available.
14. How can I stay updated on further developments or reports in the Chemical Software Industry?
To stay informed about further developments, trends, and reports in the Chemical Software Industry, consider subscribing to industry newsletters, following relevant companies and organizations, or regularly checking reputable industry news sources and publications.
Methodology
Step 1 - Identification of Relevant Samples Size from Population Database


Step 2 - Approaches for Defining Global Market Size (Value, Volume* & Price*)

Note*: In applicable scenarios
Step 3 - Data Sources
Primary Research
- Web Analytics
- Survey Reports
- Research Institute
- Latest Research Reports
- Opinion Leaders
Secondary Research
- Annual Reports
- White Paper
- Latest Press Release
- Industry Association
- Paid Database
- Investor Presentations

Step 4 - Data Triangulation
Involves using different sources of information in order to increase the validity of a study
These sources are likely to be stakeholders in a program - participants, other researchers, program staff, other community members, and so on.
Then we put all data in single framework & apply various statistical tools to find out the dynamic on the market.
During the analysis stage, feedback from the stakeholder groups would be compared to determine areas of agreement as well as areas of divergence