

Key Insights
The global Clinical Trial Imaging Service market is poised for significant expansion, with a projected market size of USD 748.09 million in 2025. This robust growth is driven by an increasing reliance on advanced imaging techniques to enhance the precision and efficiency of clinical trials across the pharmaceutical, biotechnology, and medical device sectors. The market is expected to witness a Compound Annual Growth Rate (CAGR) of 6.7% throughout the forecast period (2025-2033), reflecting a sustained upward trajectory. Key drivers for this expansion include the growing complexity of drug development, the escalating demand for personalized medicine, and the critical need for objective, quantifiable endpoints in clinical research. Furthermore, advancements in imaging technologies, such as AI-powered image analysis and novel imaging modalities, are significantly improving diagnostic accuracy and accelerating trial timelines, thereby bolstering market demand. The increasing prevalence of chronic diseases and the subsequent surge in research activities to find effective treatments further contribute to the market's healthy growth prospects.

Clinical Trial Imaging Service Market Size (In Million)
The market segmentation reveals diverse opportunities, with applications spanning pharmaceutical companies, biotechnology firms, medical device manufacturers, and research institutes. Both In-house Imaging Services and Central Imaging Services are crucial components, catering to varied operational needs and expertise levels within the research ecosystem. North America and Europe currently dominate the market, owing to well-established healthcare infrastructures, substantial R&D investments, and stringent regulatory frameworks that necessitate high-quality imaging data. However, the Asia Pacific region is emerging as a high-growth area, driven by expanding clinical research activities, increasing outsourcing by global pharmaceutical companies, and a growing base of skilled imaging professionals. Restraints, such as high initial investment costs for advanced imaging equipment and the need for specialized expertise, are being mitigated by the increasing adoption of centralized imaging services and collaborative research models. The competitive landscape is characterized by the presence of established players and emerging innovators, all striving to offer comprehensive imaging solutions that meet the evolving demands of clinical trials.

Clinical Trial Imaging Service Company Market Share
Unlocking Global Clinical Trial Imaging Services: A Comprehensive Market Analysis (2019-2033)
This in-depth report offers a critical examination of the Clinical Trial Imaging Service Market, a vital component in accelerating pharmaceutical and biotechnology research. Analyzing the period from 2019 to 2033, with a focus on the base year 2025, this report delves into market dynamics, growth trends, regional dominance, product landscape, and key players shaping this evolving industry. With a projected market value of $12,500 million in 2025, this report provides essential insights for pharmaceutical companies, biotechnology firms, medical device manufacturers, and research institutes seeking to leverage advanced imaging solutions for their clinical trials.
Clinical Trial Imaging Service Market Dynamics & Structure
The clinical trial imaging service market is characterized by a moderately concentrated structure, with established players like Bioclinica, Parexel International Corporation, and Icon holding significant market shares. Technological innovation is a primary driver, fueled by advancements in AI-powered image analysis, multi-modal imaging integration, and cloud-based data management. Regulatory frameworks, including stringent FDA and EMA guidelines for data integrity and validation, significantly influence service offerings and market entry. Competitive product substitutes exist in the form of in-house imaging capabilities, though the specialized expertise and scale offered by central imaging services often provide a distinct advantage. End-user demographics are diverse, encompassing global pharmaceutical giants, emerging biotechnology startups, and established medical device manufacturers, each with unique imaging needs for drug development and device validation. Mergers and acquisitions (M&A) are a notable trend, with larger service providers acquiring specialized imaging firms to expand their service portfolios and geographic reach. For instance, the historical period of 2019-2024 saw an estimated 7 M&A deals with an aggregate value of $750 million, indicating a clear consolidation drive. Innovation barriers include the high cost of advanced imaging technology, the need for specialized skilled personnel, and the lengthy validation processes required for new imaging methodologies.
- Market Concentration: Moderately concentrated with top players holding substantial market share.
- Technological Innovation Drivers: AI in image analysis, multi-modal imaging, cloud solutions.
- Regulatory Frameworks: FDA, EMA guidelines for data integrity and validation.
- Competitive Product Substitutes: In-house imaging capabilities.
- End-User Demographics: Pharmaceutical, biotechnology, medical device companies, research institutes.
- M&A Trends: Consolidation through strategic acquisitions, with an estimated 7 deals valued at $750 million from 2019-2024.
- Innovation Barriers: High technology costs, skilled personnel shortage, lengthy validation processes.
Clinical Trial Imaging Service Growth Trends & Insights
The clinical trial imaging service market is experiencing robust growth, projected to expand at a Compound Annual Growth Rate (CAGR) of 10.5% from 2025 to 2033. This surge is underpinned by a rising demand for advanced imaging modalities in clinical research, driven by an increasing number of complex drug development programs, particularly in oncology, neurology, and cardiology. The market size, valued at an estimated $12,500 million in 2025, is forecast to reach $27,000 million by 2033. Adoption rates of central imaging services are escalating as pharmaceutical and biotechnology companies increasingly outsource these specialized functions to enhance efficiency, reduce costs, and ensure standardized image acquisition and analysis across multi-center trials. Technological disruptions, such as the integration of artificial intelligence (AI) for automated lesion detection and quantitative image analysis, are significantly improving the accuracy and speed of trial outcomes. Furthermore, the growing emphasis on precision medicine and personalized therapies necessitates sophisticated imaging techniques for patient stratification and treatment response monitoring, further accelerating market penetration. Consumer behavior shifts within the industry are evident, with research sponsors prioritizing partners that offer end-to-end imaging solutions, including image acquisition, processing, analysis, and reporting, alongside robust data security and compliance. The penetration rate of specialized imaging services in global clinical trials is estimated to grow from 60% in 2024 to 85% by 2033.
Dominant Regions, Countries, or Segments in Clinical Trial Imaging Service
The North American region, particularly the United States, currently dominates the global clinical trial imaging service market, driven by a confluence of factors including the presence of a large number of leading pharmaceutical and biotechnology companies, a well-established research infrastructure, and significant investment in healthcare R&D. In 2025, North America is estimated to hold a 45% market share. Key drivers for this dominance include favorable economic policies supporting pharmaceutical innovation, robust clinical trial activity, and a high adoption rate of advanced imaging technologies. The concentration of major academic medical centers and Contract Research Organizations (CROs) that specialize in clinical trial imaging further solidifies its leading position.
Within the Applications segment, Pharmaceutical Companies represent the largest market share, accounting for an estimated 55% of the total market value in 2025. This is attributed to the extensive use of imaging across various therapeutic areas for drug efficacy and safety evaluation, from early-phase studies to post-market surveillance. The increasing complexity of drug candidates, particularly in areas like oncology and rare diseases, necessitates sophisticated imaging techniques for accurate assessment.
In terms of Type, Central Imaging Service holds a commanding position, estimated at 70% of the market value in 2025. This dominance stems from its ability to provide standardized imaging protocols, centralized data management, and expert interpretation across multiple trial sites, ensuring data integrity and reducing variability, which are critical for regulatory submissions.
- Dominant Region: North America (estimated 45% market share in 2025).
- Key Drivers: Presence of leading pharma/biotech companies, robust R&D investment, advanced research infrastructure, favorable economic policies.
- Dominant Application Segment: Pharmaceutical Companies (estimated 55% market share in 2025).
- Key Drivers: Extensive use of imaging in drug efficacy and safety evaluation, complex drug development programs, precision medicine initiatives.
- Dominant Type Segment: Central Imaging Service (estimated 70% market share in 2025).
- Key Drivers: Standardization of protocols, centralized data management, expert interpretation, data integrity assurance.
Clinical Trial Imaging Service Product Landscape
The clinical trial imaging service product landscape is increasingly defined by integrated, end-to-end solutions designed to streamline complex research workflows. Innovations are centered on enhancing the precision and efficiency of imaging analysis, with a strong emphasis on AI-driven software for automated lesion segmentation, quantitative biomarker extraction, and predictive analytics. These solutions offer performance metrics such as reduced analysis time by up to 40% and improved diagnostic accuracy. Unique selling propositions include cloud-based platforms for secure data sharing and collaboration, multi-modal imaging capabilities integrating MRI, CT, PET, and ultrasound data, and specialized imaging techniques tailored for specific therapeutic areas like oncology, neurology, and cardiovascular disease. Technological advancements are also focused on quantitative imaging, moving beyond qualitative assessments to provide objective, measurable data crucial for drug efficacy evaluation.
Key Drivers, Barriers & Challenges in Clinical Trial Imaging Service
Key Drivers: The primary forces propelling the clinical trial imaging service market include the escalating demand for advanced imaging in drug development, particularly for complex diseases like cancer and neurodegenerative disorders. The increasing prevalence of multi-center clinical trials necessitates standardized and centralized imaging solutions for data consistency. Technological advancements, such as AI-powered image analysis and quantitative imaging techniques, are significantly enhancing the value proposition of these services. Favorable regulatory environments that encourage innovation in clinical research also act as a strong catalyst.
Barriers & Challenges: Key challenges include the high initial investment required for cutting-edge imaging technology and specialized personnel, posing a barrier for smaller organizations. Stringent regulatory compliance for data privacy and security (e.g., HIPAA, GDPR) adds complexity and cost. The lengthy validation processes for new imaging techniques and AI algorithms can delay their adoption. Furthermore, the competitive pressure from in-house imaging departments and the need for seamless integration with diverse Electronic Data Capture (EDC) systems present ongoing hurdles. Supply chain issues for specialized imaging equipment can also impact service delivery. The estimated impact of regulatory hurdles can add 15-20% to operational costs.
Emerging Opportunities in Clinical Trial Imaging Service
Emerging opportunities lie in the expansion of AI-powered diagnostic tools for early disease detection and personalized treatment response prediction. The growing focus on real-world evidence (RWE) generation presents a significant avenue, where clinical trial imaging data can be integrated with other data sources. Untapped markets in emerging economies with increasing healthcare investments and growing pharmaceutical R&D activities offer substantial growth potential. The development of novel imaging biomarkers for a wider range of diseases, coupled with advancements in radiomics and quantitative imaging, will create new applications and service demands. Evolving consumer preferences towards integrated, digital-first solutions will also drive innovation in platform development and user experience.
Growth Accelerators in the Clinical Trial Imaging Service Industry
Long-term growth in the clinical trial imaging service industry is being significantly accelerated by breakthroughs in deep learning and machine vision, enabling more sophisticated and automated image analysis. Strategic partnerships between imaging service providers, pharmaceutical companies, and AI developers are fostering the co-creation of specialized solutions tailored to specific therapeutic needs. Market expansion strategies, including the establishment of service centers in key emerging markets and the acquisition of regional imaging expertise, are broadening the global reach of leading providers. The increasing regulatory acceptance of AI-driven tools in clinical trial data analysis is also a crucial growth accelerator, reducing adoption barriers and encouraging wider implementation.
Key Players Shaping the Clinical Trial Imaging Service Market
- Bioclinica
- Parexel International Corporation
- Icon
- Biomedical Systems Corporation (ERT)
- Biotelemetry
- Cardiovascular Imaging Technologies
- Intrinsic Imaging
- Ixico
- Radiant Sage
- Worldcare Clinical
- Micron, Inc
Notable Milestones in Clinical Trial Imaging Service Sector
- 2023: Launch of advanced AI-powered image analysis platforms by multiple key players, significantly reducing image review times.
- 2022: Increased M&A activity, with acquisitions focused on expanding AI capabilities and geographic reach.
- 2021: Growing adoption of multi-modal imaging integration for comprehensive patient assessment in oncology trials.
- 2020: Emergence of cloud-based imaging platforms, facilitating remote collaboration and data accessibility for global trials.
- 2019: Significant investments in quantitative imaging techniques for biomarker development.
In-Depth Clinical Trial Imaging Service Market Outlook
The future outlook for the clinical trial imaging service market is exceptionally strong, fueled by ongoing technological advancements and a sustained global demand for innovative therapies. Growth accelerators, including the widespread integration of AI, the expansion into emerging markets, and the increasing focus on quantitative imaging for precision medicine, will continue to drive market expansion. Strategic partnerships and collaborations will remain pivotal in developing specialized solutions and expanding service portfolios. The market is poised for continued consolidation, with providers focusing on end-to-end service offerings and robust data management capabilities to meet the evolving needs of the pharmaceutical and biotechnology industries, ultimately accelerating the delivery of life-saving treatments to patients. The projected market value in 2033 is $27,000 million.
Clinical Trial Imaging Service Segmentation
-
1. Application
- 1.1. Pharmaceutical Companies
- 1.2. Biotechnology Companies
- 1.3. Medical Device Manufacturers
- 1.4. Research Institutes
- 1.5. Others
-
2. Type
- 2.1. In-house Imaging Service
- 2.2. Central Imaging Service
Clinical Trial Imaging Service Segmentation By Geography
-
1. North America
- 1.1. United States
- 1.2. Canada
- 1.3. Mexico
-
2. South America
- 2.1. Brazil
- 2.2. Argentina
- 2.3. Rest of South America
-
3. Europe
- 3.1. United Kingdom
- 3.2. Germany
- 3.3. France
- 3.4. Italy
- 3.5. Spain
- 3.6. Russia
- 3.7. Benelux
- 3.8. Nordics
- 3.9. Rest of Europe
-
4. Middle East & Africa
- 4.1. Turkey
- 4.2. Israel
- 4.3. GCC
- 4.4. North Africa
- 4.5. South Africa
- 4.6. Rest of Middle East & Africa
-
5. Asia Pacific
- 5.1. China
- 5.2. India
- 5.3. Japan
- 5.4. South Korea
- 5.5. ASEAN
- 5.6. Oceania
- 5.7. Rest of Asia Pacific
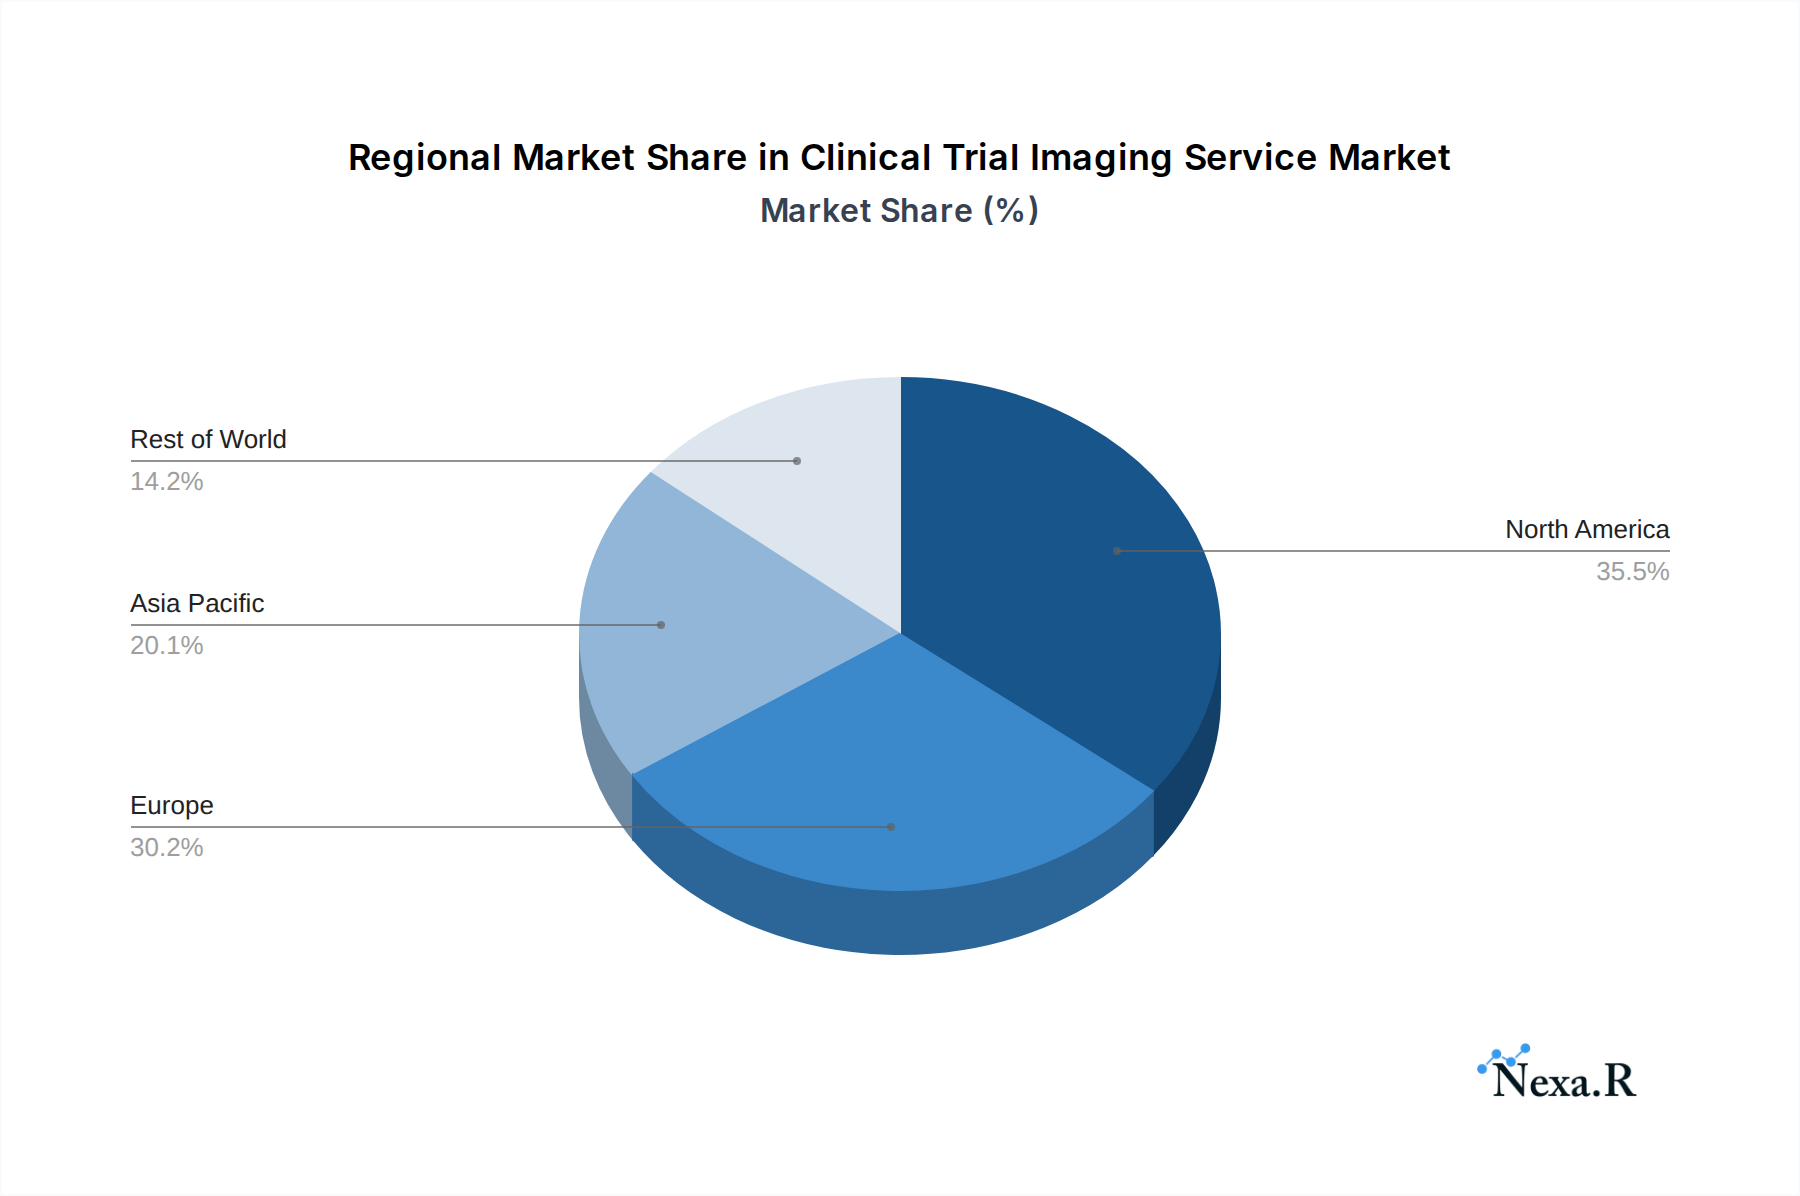
Clinical Trial Imaging Service Regional Market Share
Geographic Coverage of Clinical Trial Imaging Service
Clinical Trial Imaging Service REPORT HIGHLIGHTS
| Aspects | Details |
|---|---|
| Study Period | 2020-2034 |
| Base Year | 2025 |
| Estimated Year | 2026 |
| Forecast Period | 2026-2034 |
| Historical Period | 2020-2025 |
| Growth Rate | CAGR of 6.7% from 2020-2034 |
| Segmentation |
|
Table of Contents
- 1. Introduction
- 1.1. Research Scope
- 1.2. Market Segmentation
- 1.3. Research Objective
- 1.4. Definitions and Assumptions
- 2. Executive Summary
- 2.1. Market Snapshot
- 3. Market Dynamics
- 3.1. Market Drivers
- 3.2. Market Restrains
- 3.3. Market Trends
- 3.4. Market Opportunities
- 4. Market Factor Analysis
- 4.1. Porters Five Forces
- 4.1.1. Bargaining Power of Suppliers
- 4.1.2. Bargaining Power of Buyers
- 4.1.3. Threat of New Entrants
- 4.1.4. Threat of Substitutes
- 4.1.5. Competitive Rivalry
- 4.2. PESTEL analysis
- 4.3. BCG Analysis
- 4.3.1. Stars (High Growth, High Market Share)
- 4.3.2. Cash Cows (Low Growth, High Market Share)
- 4.3.3. Question Mark (High Growth, Low Market Share)
- 4.3.4. Dogs (Low Growth, Low Market Share)
- 4.4. Ansoff Matrix Analysis
- 4.5. Supply Chain Analysis
- 4.6. Regulatory Landscape
- 4.7. Current Market Potential and Opportunity Assessment (TAM–SAM–SOM Framework)
- 4.8. NRP Analyst Note
- 4.1. Porters Five Forces
- 5. Market Analysis, Insights and Forecast 2021-2033
- 5.1. Market Analysis, Insights and Forecast - by Application
- 5.1.1. Pharmaceutical Companies
- 5.1.2. Biotechnology Companies
- 5.1.3. Medical Device Manufacturers
- 5.1.4. Research Institutes
- 5.1.5. Others
- 5.2. Market Analysis, Insights and Forecast - by Type
- 5.2.1. In-house Imaging Service
- 5.2.2. Central Imaging Service
- 5.3. Market Analysis, Insights and Forecast - by Region
- 5.3.1. North America
- 5.3.2. South America
- 5.3.3. Europe
- 5.3.4. Middle East & Africa
- 5.3.5. Asia Pacific
- 5.1. Market Analysis, Insights and Forecast - by Application
- 6. Global Clinical Trial Imaging Service Analysis, Insights and Forecast, 2021-2033
- 6.1. Market Analysis, Insights and Forecast - by Application
- 6.1.1. Pharmaceutical Companies
- 6.1.2. Biotechnology Companies
- 6.1.3. Medical Device Manufacturers
- 6.1.4. Research Institutes
- 6.1.5. Others
- 6.2. Market Analysis, Insights and Forecast - by Type
- 6.2.1. In-house Imaging Service
- 6.2.2. Central Imaging Service
- 6.1. Market Analysis, Insights and Forecast - by Application
- 7. North America Clinical Trial Imaging Service Analysis, Insights and Forecast, 2020-2032
- 7.1. Market Analysis, Insights and Forecast - by Application
- 7.1.1. Pharmaceutical Companies
- 7.1.2. Biotechnology Companies
- 7.1.3. Medical Device Manufacturers
- 7.1.4. Research Institutes
- 7.1.5. Others
- 7.2. Market Analysis, Insights and Forecast - by Type
- 7.2.1. In-house Imaging Service
- 7.2.2. Central Imaging Service
- 7.1. Market Analysis, Insights and Forecast - by Application
- 8. South America Clinical Trial Imaging Service Analysis, Insights and Forecast, 2020-2032
- 8.1. Market Analysis, Insights and Forecast - by Application
- 8.1.1. Pharmaceutical Companies
- 8.1.2. Biotechnology Companies
- 8.1.3. Medical Device Manufacturers
- 8.1.4. Research Institutes
- 8.1.5. Others
- 8.2. Market Analysis, Insights and Forecast - by Type
- 8.2.1. In-house Imaging Service
- 8.2.2. Central Imaging Service
- 8.1. Market Analysis, Insights and Forecast - by Application
- 9. Europe Clinical Trial Imaging Service Analysis, Insights and Forecast, 2020-2032
- 9.1. Market Analysis, Insights and Forecast - by Application
- 9.1.1. Pharmaceutical Companies
- 9.1.2. Biotechnology Companies
- 9.1.3. Medical Device Manufacturers
- 9.1.4. Research Institutes
- 9.1.5. Others
- 9.2. Market Analysis, Insights and Forecast - by Type
- 9.2.1. In-house Imaging Service
- 9.2.2. Central Imaging Service
- 9.1. Market Analysis, Insights and Forecast - by Application
- 10. Middle East & Africa Clinical Trial Imaging Service Analysis, Insights and Forecast, 2020-2032
- 10.1. Market Analysis, Insights and Forecast - by Application
- 10.1.1. Pharmaceutical Companies
- 10.1.2. Biotechnology Companies
- 10.1.3. Medical Device Manufacturers
- 10.1.4. Research Institutes
- 10.1.5. Others
- 10.2. Market Analysis, Insights and Forecast - by Type
- 10.2.1. In-house Imaging Service
- 10.2.2. Central Imaging Service
- 10.1. Market Analysis, Insights and Forecast - by Application
- 11. Asia Pacific Clinical Trial Imaging Service Analysis, Insights and Forecast, 2020-2032
- 11.1. Market Analysis, Insights and Forecast - by Application
- 11.1.1. Pharmaceutical Companies
- 11.1.2. Biotechnology Companies
- 11.1.3. Medical Device Manufacturers
- 11.1.4. Research Institutes
- 11.1.5. Others
- 11.2. Market Analysis, Insights and Forecast - by Type
- 11.2.1. In-house Imaging Service
- 11.2.2. Central Imaging Service
- 11.1. Market Analysis, Insights and Forecast - by Application
- 12. Competitive Analysis
- 12.1. Company Profiles
- 12.1.1 Bioclinica
- 12.1.1.1. Company Overview
- 12.1.1.2. Products
- 12.1.1.3. Company Financials
- 12.1.1.4. SWOT Analysis
- 12.1.2 Parexel International Corporation
- 12.1.2.1. Company Overview
- 12.1.2.2. Products
- 12.1.2.3. Company Financials
- 12.1.2.4. SWOT Analysis
- 12.1.3 Icon
- 12.1.3.1. Company Overview
- 12.1.3.2. Products
- 12.1.3.3. Company Financials
- 12.1.3.4. SWOT Analysis
- 12.1.4 Biomedical Systems Corporation (ERT)
- 12.1.4.1. Company Overview
- 12.1.4.2. Products
- 12.1.4.3. Company Financials
- 12.1.4.4. SWOT Analysis
- 12.1.5 Biotelemetry
- 12.1.5.1. Company Overview
- 12.1.5.2. Products
- 12.1.5.3. Company Financials
- 12.1.5.4. SWOT Analysis
- 12.1.6 Cardiovascular Imaging Technologies
- 12.1.6.1. Company Overview
- 12.1.6.2. Products
- 12.1.6.3. Company Financials
- 12.1.6.4. SWOT Analysis
- 12.1.7 Intrinsic Imaging
- 12.1.7.1. Company Overview
- 12.1.7.2. Products
- 12.1.7.3. Company Financials
- 12.1.7.4. SWOT Analysis
- 12.1.8 Ixico
- 12.1.8.1. Company Overview
- 12.1.8.2. Products
- 12.1.8.3. Company Financials
- 12.1.8.4. SWOT Analysis
- 12.1.9 Radiant Sage
- 12.1.9.1. Company Overview
- 12.1.9.2. Products
- 12.1.9.3. Company Financials
- 12.1.9.4. SWOT Analysis
- 12.1.10 Worldcare Clinical
- 12.1.10.1. Company Overview
- 12.1.10.2. Products
- 12.1.10.3. Company Financials
- 12.1.10.4. SWOT Analysis
- 12.1.11 Micron Inc
- 12.1.11.1. Company Overview
- 12.1.11.2. Products
- 12.1.11.3. Company Financials
- 12.1.11.4. SWOT Analysis
- 12.1.1 Bioclinica
- 12.2. Market Entropy
- 12.2.1 Company's Key Areas Served
- 12.2.2 Recent Developments
- 12.3. Company Market Share Analysis 2025
- 12.3.1 Top 5 Companies Market Share Analysis
- 12.3.2 Top 3 Companies Market Share Analysis
- 12.4. List of Potential Customers
- 13. Research Methodology
List of Figures
- Figure 1: Global Clinical Trial Imaging Service Revenue Breakdown (million, %) by Region 2025 & 2033
- Figure 2: North America Clinical Trial Imaging Service Revenue (million), by Application 2025 & 2033
- Figure 3: North America Clinical Trial Imaging Service Revenue Share (%), by Application 2025 & 2033
- Figure 4: North America Clinical Trial Imaging Service Revenue (million), by Type 2025 & 2033
- Figure 5: North America Clinical Trial Imaging Service Revenue Share (%), by Type 2025 & 2033
- Figure 6: North America Clinical Trial Imaging Service Revenue (million), by Country 2025 & 2033
- Figure 7: North America Clinical Trial Imaging Service Revenue Share (%), by Country 2025 & 2033
- Figure 8: South America Clinical Trial Imaging Service Revenue (million), by Application 2025 & 2033
- Figure 9: South America Clinical Trial Imaging Service Revenue Share (%), by Application 2025 & 2033
- Figure 10: South America Clinical Trial Imaging Service Revenue (million), by Type 2025 & 2033
- Figure 11: South America Clinical Trial Imaging Service Revenue Share (%), by Type 2025 & 2033
- Figure 12: South America Clinical Trial Imaging Service Revenue (million), by Country 2025 & 2033
- Figure 13: South America Clinical Trial Imaging Service Revenue Share (%), by Country 2025 & 2033
- Figure 14: Europe Clinical Trial Imaging Service Revenue (million), by Application 2025 & 2033
- Figure 15: Europe Clinical Trial Imaging Service Revenue Share (%), by Application 2025 & 2033
- Figure 16: Europe Clinical Trial Imaging Service Revenue (million), by Type 2025 & 2033
- Figure 17: Europe Clinical Trial Imaging Service Revenue Share (%), by Type 2025 & 2033
- Figure 18: Europe Clinical Trial Imaging Service Revenue (million), by Country 2025 & 2033
- Figure 19: Europe Clinical Trial Imaging Service Revenue Share (%), by Country 2025 & 2033
- Figure 20: Middle East & Africa Clinical Trial Imaging Service Revenue (million), by Application 2025 & 2033
- Figure 21: Middle East & Africa Clinical Trial Imaging Service Revenue Share (%), by Application 2025 & 2033
- Figure 22: Middle East & Africa Clinical Trial Imaging Service Revenue (million), by Type 2025 & 2033
- Figure 23: Middle East & Africa Clinical Trial Imaging Service Revenue Share (%), by Type 2025 & 2033
- Figure 24: Middle East & Africa Clinical Trial Imaging Service Revenue (million), by Country 2025 & 2033
- Figure 25: Middle East & Africa Clinical Trial Imaging Service Revenue Share (%), by Country 2025 & 2033
- Figure 26: Asia Pacific Clinical Trial Imaging Service Revenue (million), by Application 2025 & 2033
- Figure 27: Asia Pacific Clinical Trial Imaging Service Revenue Share (%), by Application 2025 & 2033
- Figure 28: Asia Pacific Clinical Trial Imaging Service Revenue (million), by Type 2025 & 2033
- Figure 29: Asia Pacific Clinical Trial Imaging Service Revenue Share (%), by Type 2025 & 2033
- Figure 30: Asia Pacific Clinical Trial Imaging Service Revenue (million), by Country 2025 & 2033
- Figure 31: Asia Pacific Clinical Trial Imaging Service Revenue Share (%), by Country 2025 & 2033
List of Tables
- Table 1: Global Clinical Trial Imaging Service Revenue million Forecast, by Application 2020 & 2033
- Table 2: Global Clinical Trial Imaging Service Revenue million Forecast, by Type 2020 & 2033
- Table 3: Global Clinical Trial Imaging Service Revenue million Forecast, by Region 2020 & 2033
- Table 4: Global Clinical Trial Imaging Service Revenue million Forecast, by Application 2020 & 2033
- Table 5: Global Clinical Trial Imaging Service Revenue million Forecast, by Type 2020 & 2033
- Table 6: Global Clinical Trial Imaging Service Revenue million Forecast, by Country 2020 & 2033
- Table 7: United States Clinical Trial Imaging Service Revenue (million) Forecast, by Application 2020 & 2033
- Table 8: Canada Clinical Trial Imaging Service Revenue (million) Forecast, by Application 2020 & 2033
- Table 9: Mexico Clinical Trial Imaging Service Revenue (million) Forecast, by Application 2020 & 2033
- Table 10: Global Clinical Trial Imaging Service Revenue million Forecast, by Application 2020 & 2033
- Table 11: Global Clinical Trial Imaging Service Revenue million Forecast, by Type 2020 & 2033
- Table 12: Global Clinical Trial Imaging Service Revenue million Forecast, by Country 2020 & 2033
- Table 13: Brazil Clinical Trial Imaging Service Revenue (million) Forecast, by Application 2020 & 2033
- Table 14: Argentina Clinical Trial Imaging Service Revenue (million) Forecast, by Application 2020 & 2033
- Table 15: Rest of South America Clinical Trial Imaging Service Revenue (million) Forecast, by Application 2020 & 2033
- Table 16: Global Clinical Trial Imaging Service Revenue million Forecast, by Application 2020 & 2033
- Table 17: Global Clinical Trial Imaging Service Revenue million Forecast, by Type 2020 & 2033
- Table 18: Global Clinical Trial Imaging Service Revenue million Forecast, by Country 2020 & 2033
- Table 19: United Kingdom Clinical Trial Imaging Service Revenue (million) Forecast, by Application 2020 & 2033
- Table 20: Germany Clinical Trial Imaging Service Revenue (million) Forecast, by Application 2020 & 2033
- Table 21: France Clinical Trial Imaging Service Revenue (million) Forecast, by Application 2020 & 2033
- Table 22: Italy Clinical Trial Imaging Service Revenue (million) Forecast, by Application 2020 & 2033
- Table 23: Spain Clinical Trial Imaging Service Revenue (million) Forecast, by Application 2020 & 2033
- Table 24: Russia Clinical Trial Imaging Service Revenue (million) Forecast, by Application 2020 & 2033
- Table 25: Benelux Clinical Trial Imaging Service Revenue (million) Forecast, by Application 2020 & 2033
- Table 26: Nordics Clinical Trial Imaging Service Revenue (million) Forecast, by Application 2020 & 2033
- Table 27: Rest of Europe Clinical Trial Imaging Service Revenue (million) Forecast, by Application 2020 & 2033
- Table 28: Global Clinical Trial Imaging Service Revenue million Forecast, by Application 2020 & 2033
- Table 29: Global Clinical Trial Imaging Service Revenue million Forecast, by Type 2020 & 2033
- Table 30: Global Clinical Trial Imaging Service Revenue million Forecast, by Country 2020 & 2033
- Table 31: Turkey Clinical Trial Imaging Service Revenue (million) Forecast, by Application 2020 & 2033
- Table 32: Israel Clinical Trial Imaging Service Revenue (million) Forecast, by Application 2020 & 2033
- Table 33: GCC Clinical Trial Imaging Service Revenue (million) Forecast, by Application 2020 & 2033
- Table 34: North Africa Clinical Trial Imaging Service Revenue (million) Forecast, by Application 2020 & 2033
- Table 35: South Africa Clinical Trial Imaging Service Revenue (million) Forecast, by Application 2020 & 2033
- Table 36: Rest of Middle East & Africa Clinical Trial Imaging Service Revenue (million) Forecast, by Application 2020 & 2033
- Table 37: Global Clinical Trial Imaging Service Revenue million Forecast, by Application 2020 & 2033
- Table 38: Global Clinical Trial Imaging Service Revenue million Forecast, by Type 2020 & 2033
- Table 39: Global Clinical Trial Imaging Service Revenue million Forecast, by Country 2020 & 2033
- Table 40: China Clinical Trial Imaging Service Revenue (million) Forecast, by Application 2020 & 2033
- Table 41: India Clinical Trial Imaging Service Revenue (million) Forecast, by Application 2020 & 2033
- Table 42: Japan Clinical Trial Imaging Service Revenue (million) Forecast, by Application 2020 & 2033
- Table 43: South Korea Clinical Trial Imaging Service Revenue (million) Forecast, by Application 2020 & 2033
- Table 44: ASEAN Clinical Trial Imaging Service Revenue (million) Forecast, by Application 2020 & 2033
- Table 45: Oceania Clinical Trial Imaging Service Revenue (million) Forecast, by Application 2020 & 2033
- Table 46: Rest of Asia Pacific Clinical Trial Imaging Service Revenue (million) Forecast, by Application 2020 & 2033
Frequently Asked Questions
1. What is the projected Compound Annual Growth Rate (CAGR) of the Clinical Trial Imaging Service?
The projected CAGR is approximately 6.7%.
2. Which companies are prominent players in the Clinical Trial Imaging Service?
Key companies in the market include Bioclinica, Parexel International Corporation, Icon, Biomedical Systems Corporation (ERT), Biotelemetry, Cardiovascular Imaging Technologies, Intrinsic Imaging, Ixico, Radiant Sage, Worldcare Clinical, Micron, Inc.
3. What are the main segments of the Clinical Trial Imaging Service?
The market segments include Application, Type.
4. Can you provide details about the market size?
The market size is estimated to be USD 748.09 million as of 2022.
5. What are some drivers contributing to market growth?
N/A
6. What are the notable trends driving market growth?
N/A
7. Are there any restraints impacting market growth?
N/A
8. Can you provide examples of recent developments in the market?
N/A
9. What pricing options are available for accessing the report?
Pricing options include single-user, multi-user, and enterprise licenses priced at USD 2900.00, USD 4350.00, and USD 5800.00 respectively.
10. Is the market size provided in terms of value or volume?
The market size is provided in terms of value, measured in million.
11. Are there any specific market keywords associated with the report?
Yes, the market keyword associated with the report is "Clinical Trial Imaging Service," which aids in identifying and referencing the specific market segment covered.
12. How do I determine which pricing option suits my needs best?
The pricing options vary based on user requirements and access needs. Individual users may opt for single-user licenses, while businesses requiring broader access may choose multi-user or enterprise licenses for cost-effective access to the report.
13. Are there any additional resources or data provided in the Clinical Trial Imaging Service report?
While the report offers comprehensive insights, it's advisable to review the specific contents or supplementary materials provided to ascertain if additional resources or data are available.
14. How can I stay updated on further developments or reports in the Clinical Trial Imaging Service?
To stay informed about further developments, trends, and reports in the Clinical Trial Imaging Service, consider subscribing to industry newsletters, following relevant companies and organizations, or regularly checking reputable industry news sources and publications.
Methodology
Step 1 - Identification of Relevant Samples Size from Population Database


Step 2 - Approaches for Defining Global Market Size (Value, Volume* & Price*)

Note*: In applicable scenarios
Step 3 - Data Sources
Primary Research
- Web Analytics
- Survey Reports
- Research Institute
- Latest Research Reports
- Opinion Leaders
Secondary Research
- Annual Reports
- White Paper
- Latest Press Release
- Industry Association
- Paid Database
- Investor Presentations

Step 4 - Data Triangulation
Involves using different sources of information in order to increase the validity of a study
These sources are likely to be stakeholders in a program - participants, other researchers, program staff, other community members, and so on.
Then we put all data in single framework & apply various statistical tools to find out the dynamic on the market.
During the analysis stage, feedback from the stakeholder groups would be compared to determine areas of agreement as well as areas of divergence