

Key Insights
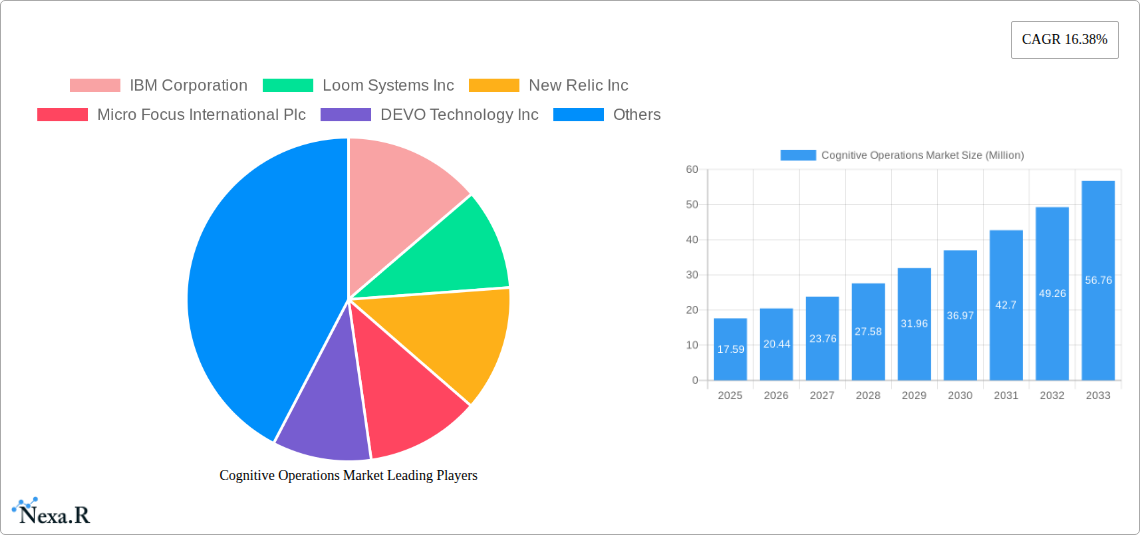
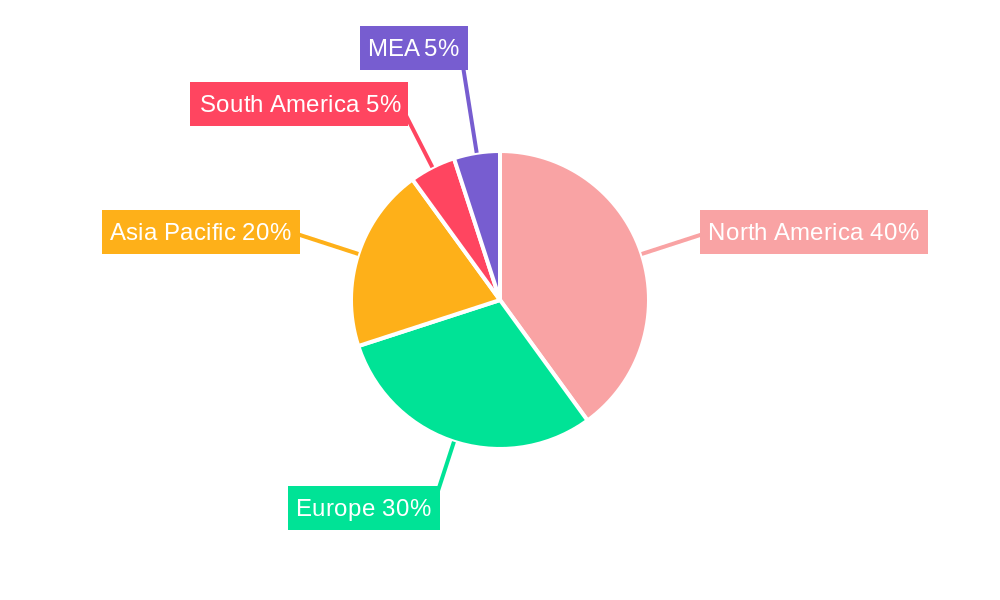
The Cognitive Operations market is experiencing robust growth, projected to reach \$17.59 million in 2025 and exhibiting a Compound Annual Growth Rate (CAGR) of 16.38% from 2025 to 2033. This expansion is fueled by several key factors. The increasing complexity of IT infrastructure, coupled with the growing volume of data generated by businesses, necessitates intelligent automation and proactive management. Cognitive operations solutions leverage AI and machine learning to analyze vast datasets, predict potential problems, and automate remedial actions, resulting in significant improvements in operational efficiency and reduced downtime. Furthermore, the rising adoption of cloud computing and the increasing demand for enhanced cybersecurity are driving the demand for sophisticated cognitive operations platforms. The market is segmented by component (solutions and services), deployment mode (cloud and on-premises), enterprise size (large and small/medium enterprises), application (IT operations analytics, application performance management, network analytics, security analytics, infrastructure management, and others), and industry vertical (BFSI, healthcare & life sciences, IT & telecom, retail & e-commerce, and others). North America currently holds a significant market share due to early adoption and a well-established technological infrastructure; however, Asia Pacific is poised for rapid growth driven by increasing digitalization and technological advancements.
The competitive landscape is characterized by a mix of established technology giants and innovative startups. Companies such as IBM, Splunk, and VMware are leveraging their existing strengths in data analytics and IT management to offer comprehensive cognitive operations solutions. Meanwhile, specialized firms like Loom Systems and Devo Technology are focusing on niche applications and innovative approaches. The market is expected to witness strategic partnerships, mergers, and acquisitions as companies seek to expand their capabilities and market reach. Future growth will likely be influenced by advancements in AI and machine learning, the integration of cognitive operations with other emerging technologies like IoT and edge computing, and the continued adoption of cloud-based solutions. The increasing focus on data security and regulatory compliance will also play a crucial role in shaping market dynamics.
Cognitive Operations Market: A Comprehensive Report (2019-2033)
This in-depth report provides a comprehensive analysis of the Cognitive Operations Market, encompassing market dynamics, growth trends, regional dominance, product landscape, key players, and future outlook. The study period spans from 2019 to 2033, with 2025 serving as the base and estimated year. The report segments the market by component (Solutions, Services), deployment mode (Cloud, On-premises), enterprise size (Large Enterprises, Small and Medium-Sized Enterprises), application (IT Operations Analytics, Application Performance Management, Network Analytics, Security Analytics, Infrastructure Management, Other Applications), and industry vertical (BFSI, Healthcare & Life Sciences, IT & Telecom, Retail & E-commerce, Other Industry Verticals). The market is projected to reach xx Million by 2033, exhibiting a CAGR of xx% during the forecast period (2025-2033).
Cognitive Operations Market Dynamics & Structure
The Cognitive Operations market is characterized by a moderately concentrated landscape with a few major players holding significant market share. However, the market is witnessing increased competition from new entrants offering niche solutions and innovative technologies. Technological advancements, particularly in Artificial Intelligence (AI), Machine Learning (ML), and Big Data analytics, are primary growth drivers. Stringent regulatory frameworks concerning data privacy and security influence market operations, creating both opportunities and challenges. The market also experiences competitive pressure from traditional IT operations management tools, but the superior analytical capabilities and automation offered by cognitive solutions are driving adoption. M&A activity is prevalent, with larger players acquiring smaller companies to expand their product portfolios and enhance technological capabilities. The market share of the top 5 players is estimated at xx% in 2025. Over the historical period (2019-2024), the number of M&A deals in the sector averaged xx per year.
- Market Concentration: Moderately concentrated, with top 5 players holding xx% market share in 2025.
- Technological Innovation: AI, ML, and Big Data analytics are key drivers.
- Regulatory Frameworks: Data privacy regulations (e.g., GDPR) influence market operations.
- Competitive Substitutes: Traditional IT operations management tools pose competition.
- End-User Demographics: Predominantly large enterprises, but increasing adoption by SMEs.
- M&A Trends: Frequent acquisitions to expand product portfolios and technological capabilities.
- Innovation Barriers: High initial investment costs and the need for specialized expertise.
Cognitive Operations Market Growth Trends & Insights
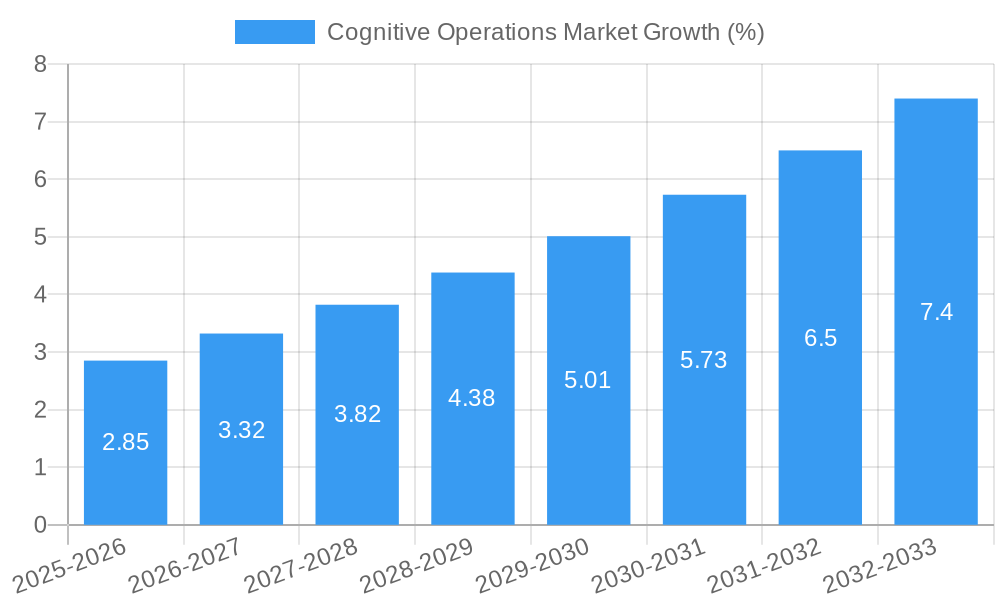
The Cognitive Operations market has experienced significant growth over the historical period (2019-2024), driven by the increasing adoption of cloud-based solutions, the rising demand for improved IT efficiency, and the need for proactive risk management. The market size has grown from xx Million in 2019 to xx Million in 2024, indicating substantial market expansion. The CAGR during this period was xx%. This growth is projected to continue throughout the forecast period, albeit at a slightly moderated pace, owing to market saturation in certain segments. The increasing adoption of AI-powered solutions and the growing emphasis on digital transformation initiatives across various industries further contribute to market growth. Market penetration is estimated at xx% in 2025 for large enterprises and xx% for SMEs. Technological disruptions such as the emergence of edge computing and serverless architectures are influencing the market, creating new opportunities and challenging existing solutions. Consumer behavior is shifting towards more sophisticated, automated, and self-service solutions.
Dominant Regions, Countries, or Segments in Cognitive Operations Market
The North American region currently holds the largest market share in the Cognitive Operations market, driven by the high adoption of advanced technologies and the presence of numerous key players. However, the Asia-Pacific region is expected to exhibit the highest growth rate during the forecast period, fueled by rapid digitalization and increasing government investments in infrastructure. Within the segments, the cloud-based deployment mode dominates due to its scalability and cost-effectiveness. Large enterprises are the primary adopters, but the SME segment is rapidly gaining traction. IT Operations Analytics and Application Performance Management are the leading application segments.
- Leading Region: North America (Market Share: xx% in 2025)
- Fastest-Growing Region: Asia-Pacific (CAGR: xx% during 2025-2033)
- Dominant Deployment Mode: Cloud
- Primary Adopters: Large Enterprises
- Leading Application Segments: IT Operations Analytics and Application Performance Management
- Key Drivers: Government initiatives supporting digital transformation, increasing investments in IT infrastructure, rising demand for improved operational efficiency and reduced operational costs.
Cognitive Operations Market Product Landscape
The Cognitive Operations market offers a wide range of solutions and services, including AI-powered analytics platforms, automated incident management tools, and predictive maintenance systems. These products leverage advanced machine learning algorithms and big data analytics to provide real-time insights and automate complex IT processes. Unique selling propositions include enhanced accuracy, improved efficiency, proactive risk management, and reduced operational costs. Recent technological advancements have focused on integrating cognitive capabilities into existing IT infrastructure, improving interoperability with legacy systems and providing seamless integration with various tools and platforms. The market is witnessing a growing trend towards cloud-native solutions, serverless architectures, and AI-powered automation platforms.
Key Drivers, Barriers & Challenges in Cognitive Operations Market
Key Drivers: The increasing complexity of IT infrastructure, the demand for improved operational efficiency, and the need for proactive risk management are key drivers. The growing adoption of cloud computing and digital transformation initiatives across various industries also contributes significantly.
Key Challenges: High implementation costs, the need for specialized expertise, and data security concerns are significant challenges. Integration complexities with existing IT systems can also hinder adoption. Supply chain disruptions in procuring essential components may lead to delays in project deployments with an estimated 5% impact on market growth. Regulatory compliance requirements may also impose operational constraints.
Emerging Opportunities in Cognitive Operations Market
Emerging opportunities exist in areas such as edge computing integration, advanced analytics for proactive security, and the application of cognitive operations in sectors like manufacturing, healthcare, and transportation. The expansion into untapped markets, such as government agencies and smaller enterprises, also presents significant growth potential. Furthermore, the development of more user-friendly interfaces and self-service capabilities can significantly enhance market adoption.
Growth Accelerators in the Cognitive Operations Market Industry
Strategic partnerships between technology providers and IT service management companies are accelerating market growth. This synergistic approach combines technological expertise with deep industry knowledge to provide comprehensive solutions tailored to specific customer needs. Continuous technological innovation, particularly in areas such as AI, ML, and big data analytics, continues to drive market expansion, unlocking new capabilities and functionalities. Aggressive marketing and customer education initiatives, highlighting the benefits and ROI of adopting Cognitive Operations solutions, help overcome initial reluctance amongst potential customers.
Key Players Shaping the Cognitive Operations Market Market
- IBM Corporation
- Loom Systems Inc
- New Relic Inc
- Micro Focus International Plc
- DEVO Technology Inc
- Broadcom Inc
- ScienceLogic Inc
- CloudFabrix Software Inc
- BMC Software Inc
- Correlata Solutions Inc
- Servicenow Inc
- Interlink Software Services Ltd
- VMware Inc
- Splunk Inc
- Dynatrace LLC
- HCL Technologies Limited
Notable Milestones in Cognitive Operations Market Sector
- March 2023: TCS launched its Cognitive Plant Operations Adviser, leveraging AI and ML for optimized manufacturing processes across various industries.
- October 2022: Saudi Telecom Company (STC) partnered with Ericsson to deploy AI-based cognitive software solutions for enhanced network optimization.
In-Depth Cognitive Operations Market Market Outlook
The Cognitive Operations market is poised for continued growth, driven by technological advancements, increasing digital transformation efforts, and the rising demand for improved operational efficiency. The future holds significant potential for innovation, with opportunities for expanding into new applications and verticals, such as the Internet of Things (IoT) and edge computing. Strategic partnerships and acquisitions will play a crucial role in shaping the market landscape, while emerging technologies will drive continuous improvement and market expansion. The focus will shift towards creating more user-friendly solutions that seamlessly integrate into existing infrastructure. The market is expected to witness considerable innovation in areas like AI-powered predictive maintenance, automated incident response, and self-healing IT systems.
Cognitive Operations Market Segmentation
-
1. Component
- 1.1. Solutions
- 1.2. Services
-
2. Deployment Mode
- 2.1. Cloud
- 2.2. On-Premises
-
3. Enterprise Size
- 3.1. Large Enterprises
- 3.2. Small and Medium-Sized Enterprises
-
4. Application
- 4.1. IT Operations Analytics
- 4.2. Application Performance Management
- 4.3. Network Analytics
- 4.4. Security Analytics
- 4.5. Infrastructure Management
- 4.6. Other Applications
-
5. Industry Vertical
- 5.1. BFSI
- 5.2. Healthcare & Life Sciences
- 5.3. IT & Telecom
- 5.4. Retail & E-commerce
- 5.5. Other Industry Verticals
Cognitive Operations Market Segmentation By Geography
- 1. North America
- 2. Europe
- 3. Asia Pacific
- 4. Rest of the World
Cognitive Operations Market REPORT HIGHLIGHTS
| Aspects | Details |
|---|---|
| Study Period | 2019-2033 |
| Base Year | 2024 |
| Estimated Year | 2025 |
| Forecast Period | 2025-2033 |
| Historical Period | 2019-2024 |
| Growth Rate | CAGR of 16.38% from 2019-2033 |
| Segmentation |
|
Table of Contents
- 1. Introduction
- 1.1. Research Scope
- 1.2. Market Segmentation
- 1.3. Research Methodology
- 1.4. Definitions and Assumptions
- 2. Executive Summary
- 2.1. Introduction
- 3. Market Dynamics
- 3.1. Introduction
- 3.2. Market Drivers
- 3.2.1. Growing Focus Toward Selection of Cloud-Based Cognitive IT Operations Solutions; Rising Demand for Monitoring the Complex IT Environment
- 3.3. Market Restrains
- 3.3.1. Integration of Cognitive Operations Capabilities With the Present Systems; Dearth of Skills and Expertise
- 3.4. Market Trends
- 3.4.1. IT and Telecommunication Segment to Grow Significantly
- 4. Market Factor Analysis
- 4.1. Porters Five Forces
- 4.2. Supply/Value Chain
- 4.3. PESTEL analysis
- 4.4. Market Entropy
- 4.5. Patent/Trademark Analysis
- 5. Global Cognitive Operations Market Analysis, Insights and Forecast, 2019-2031
- 5.1. Market Analysis, Insights and Forecast - by Component
- 5.1.1. Solutions
- 5.1.2. Services
- 5.2. Market Analysis, Insights and Forecast - by Deployment Mode
- 5.2.1. Cloud
- 5.2.2. On-Premises
- 5.3. Market Analysis, Insights and Forecast - by Enterprise Size
- 5.3.1. Large Enterprises
- 5.3.2. Small and Medium-Sized Enterprises
- 5.4. Market Analysis, Insights and Forecast - by Application
- 5.4.1. IT Operations Analytics
- 5.4.2. Application Performance Management
- 5.4.3. Network Analytics
- 5.4.4. Security Analytics
- 5.4.5. Infrastructure Management
- 5.4.6. Other Applications
- 5.5. Market Analysis, Insights and Forecast - by Industry Vertical
- 5.5.1. BFSI
- 5.5.2. Healthcare & Life Sciences
- 5.5.3. IT & Telecom
- 5.5.4. Retail & E-commerce
- 5.5.5. Other Industry Verticals
- 5.6. Market Analysis, Insights and Forecast - by Region
- 5.6.1. North America
- 5.6.2. Europe
- 5.6.3. Asia Pacific
- 5.6.4. Rest of the World
- 5.1. Market Analysis, Insights and Forecast - by Component
- 6. North America Cognitive Operations Market Analysis, Insights and Forecast, 2019-2031
- 6.1. Market Analysis, Insights and Forecast - by Component
- 6.1.1. Solutions
- 6.1.2. Services
- 6.2. Market Analysis, Insights and Forecast - by Deployment Mode
- 6.2.1. Cloud
- 6.2.2. On-Premises
- 6.3. Market Analysis, Insights and Forecast - by Enterprise Size
- 6.3.1. Large Enterprises
- 6.3.2. Small and Medium-Sized Enterprises
- 6.4. Market Analysis, Insights and Forecast - by Application
- 6.4.1. IT Operations Analytics
- 6.4.2. Application Performance Management
- 6.4.3. Network Analytics
- 6.4.4. Security Analytics
- 6.4.5. Infrastructure Management
- 6.4.6. Other Applications
- 6.5. Market Analysis, Insights and Forecast - by Industry Vertical
- 6.5.1. BFSI
- 6.5.2. Healthcare & Life Sciences
- 6.5.3. IT & Telecom
- 6.5.4. Retail & E-commerce
- 6.5.5. Other Industry Verticals
- 6.1. Market Analysis, Insights and Forecast - by Component
- 7. Europe Cognitive Operations Market Analysis, Insights and Forecast, 2019-2031
- 7.1. Market Analysis, Insights and Forecast - by Component
- 7.1.1. Solutions
- 7.1.2. Services
- 7.2. Market Analysis, Insights and Forecast - by Deployment Mode
- 7.2.1. Cloud
- 7.2.2. On-Premises
- 7.3. Market Analysis, Insights and Forecast - by Enterprise Size
- 7.3.1. Large Enterprises
- 7.3.2. Small and Medium-Sized Enterprises
- 7.4. Market Analysis, Insights and Forecast - by Application
- 7.4.1. IT Operations Analytics
- 7.4.2. Application Performance Management
- 7.4.3. Network Analytics
- 7.4.4. Security Analytics
- 7.4.5. Infrastructure Management
- 7.4.6. Other Applications
- 7.5. Market Analysis, Insights and Forecast - by Industry Vertical
- 7.5.1. BFSI
- 7.5.2. Healthcare & Life Sciences
- 7.5.3. IT & Telecom
- 7.5.4. Retail & E-commerce
- 7.5.5. Other Industry Verticals
- 7.1. Market Analysis, Insights and Forecast - by Component
- 8. Asia Pacific Cognitive Operations Market Analysis, Insights and Forecast, 2019-2031
- 8.1. Market Analysis, Insights and Forecast - by Component
- 8.1.1. Solutions
- 8.1.2. Services
- 8.2. Market Analysis, Insights and Forecast - by Deployment Mode
- 8.2.1. Cloud
- 8.2.2. On-Premises
- 8.3. Market Analysis, Insights and Forecast - by Enterprise Size
- 8.3.1. Large Enterprises
- 8.3.2. Small and Medium-Sized Enterprises
- 8.4. Market Analysis, Insights and Forecast - by Application
- 8.4.1. IT Operations Analytics
- 8.4.2. Application Performance Management
- 8.4.3. Network Analytics
- 8.4.4. Security Analytics
- 8.4.5. Infrastructure Management
- 8.4.6. Other Applications
- 8.5. Market Analysis, Insights and Forecast - by Industry Vertical
- 8.5.1. BFSI
- 8.5.2. Healthcare & Life Sciences
- 8.5.3. IT & Telecom
- 8.5.4. Retail & E-commerce
- 8.5.5. Other Industry Verticals
- 8.1. Market Analysis, Insights and Forecast - by Component
- 9. Rest of the World Cognitive Operations Market Analysis, Insights and Forecast, 2019-2031
- 9.1. Market Analysis, Insights and Forecast - by Component
- 9.1.1. Solutions
- 9.1.2. Services
- 9.2. Market Analysis, Insights and Forecast - by Deployment Mode
- 9.2.1. Cloud
- 9.2.2. On-Premises
- 9.3. Market Analysis, Insights and Forecast - by Enterprise Size
- 9.3.1. Large Enterprises
- 9.3.2. Small and Medium-Sized Enterprises
- 9.4. Market Analysis, Insights and Forecast - by Application
- 9.4.1. IT Operations Analytics
- 9.4.2. Application Performance Management
- 9.4.3. Network Analytics
- 9.4.4. Security Analytics
- 9.4.5. Infrastructure Management
- 9.4.6. Other Applications
- 9.5. Market Analysis, Insights and Forecast - by Industry Vertical
- 9.5.1. BFSI
- 9.5.2. Healthcare & Life Sciences
- 9.5.3. IT & Telecom
- 9.5.4. Retail & E-commerce
- 9.5.5. Other Industry Verticals
- 9.1. Market Analysis, Insights and Forecast - by Component
- 10. North America Cognitive Operations Market Analysis, Insights and Forecast, 2019-2031
- 10.1. Market Analysis, Insights and Forecast - By Country/Sub-region
- 10.1.1 United States
- 10.1.2 Canada
- 10.1.3 Mexico
- 11. Europe Cognitive Operations Market Analysis, Insights and Forecast, 2019-2031
- 11.1. Market Analysis, Insights and Forecast - By Country/Sub-region
- 11.1.1 Germany
- 11.1.2 United Kingdom
- 11.1.3 France
- 11.1.4 Spain
- 11.1.5 Italy
- 11.1.6 Spain
- 11.1.7 Belgium
- 11.1.8 Netherland
- 11.1.9 Nordics
- 11.1.10 Rest of Europe
- 12. Asia Pacific Cognitive Operations Market Analysis, Insights and Forecast, 2019-2031
- 12.1. Market Analysis, Insights and Forecast - By Country/Sub-region
- 12.1.1 China
- 12.1.2 Japan
- 12.1.3 India
- 12.1.4 South Korea
- 12.1.5 Southeast Asia
- 12.1.6 Australia
- 12.1.7 Indonesia
- 12.1.8 Phillipes
- 12.1.9 Singapore
- 12.1.10 Thailandc
- 12.1.11 Rest of Asia Pacific
- 13. South America Cognitive Operations Market Analysis, Insights and Forecast, 2019-2031
- 13.1. Market Analysis, Insights and Forecast - By Country/Sub-region
- 13.1.1 Brazil
- 13.1.2 Argentina
- 13.1.3 Peru
- 13.1.4 Chile
- 13.1.5 Colombia
- 13.1.6 Ecuador
- 13.1.7 Venezuela
- 13.1.8 Rest of South America
- 14. North America Cognitive Operations Market Analysis, Insights and Forecast, 2019-2031
- 14.1. Market Analysis, Insights and Forecast - By Country/Sub-region
- 14.1.1 United States
- 14.1.2 Canada
- 14.1.3 Mexico
- 15. MEA Cognitive Operations Market Analysis, Insights and Forecast, 2019-2031
- 15.1. Market Analysis, Insights and Forecast - By Country/Sub-region
- 15.1.1 United Arab Emirates
- 15.1.2 Saudi Arabia
- 15.1.3 South Africa
- 15.1.4 Rest of Middle East and Africa
- 16. Competitive Analysis
- 16.1. Global Market Share Analysis 2024
- 16.2. Company Profiles
- 16.2.1 IBM Corporation
- 16.2.1.1. Overview
- 16.2.1.2. Products
- 16.2.1.3. SWOT Analysis
- 16.2.1.4. Recent Developments
- 16.2.1.5. Financials (Based on Availability)
- 16.2.2 Loom Systems Inc
- 16.2.2.1. Overview
- 16.2.2.2. Products
- 16.2.2.3. SWOT Analysis
- 16.2.2.4. Recent Developments
- 16.2.2.5. Financials (Based on Availability)
- 16.2.3 New Relic Inc
- 16.2.3.1. Overview
- 16.2.3.2. Products
- 16.2.3.3. SWOT Analysis
- 16.2.3.4. Recent Developments
- 16.2.3.5. Financials (Based on Availability)
- 16.2.4 Micro Focus International Plc
- 16.2.4.1. Overview
- 16.2.4.2. Products
- 16.2.4.3. SWOT Analysis
- 16.2.4.4. Recent Developments
- 16.2.4.5. Financials (Based on Availability)
- 16.2.5 DEVO Technology Inc
- 16.2.5.1. Overview
- 16.2.5.2. Products
- 16.2.5.3. SWOT Analysis
- 16.2.5.4. Recent Developments
- 16.2.5.5. Financials (Based on Availability)
- 16.2.6 Broadcom Inc
- 16.2.6.1. Overview
- 16.2.6.2. Products
- 16.2.6.3. SWOT Analysis
- 16.2.6.4. Recent Developments
- 16.2.6.5. Financials (Based on Availability)
- 16.2.7 ScienceLogic Inc
- 16.2.7.1. Overview
- 16.2.7.2. Products
- 16.2.7.3. SWOT Analysis
- 16.2.7.4. Recent Developments
- 16.2.7.5. Financials (Based on Availability)
- 16.2.8 CloudFabrix Software Inc
- 16.2.8.1. Overview
- 16.2.8.2. Products
- 16.2.8.3. SWOT Analysis
- 16.2.8.4. Recent Developments
- 16.2.8.5. Financials (Based on Availability)
- 16.2.9 BMC Software Inc
- 16.2.9.1. Overview
- 16.2.9.2. Products
- 16.2.9.3. SWOT Analysis
- 16.2.9.4. Recent Developments
- 16.2.9.5. Financials (Based on Availability)
- 16.2.10 Correlata Solutions Inc
- 16.2.10.1. Overview
- 16.2.10.2. Products
- 16.2.10.3. SWOT Analysis
- 16.2.10.4. Recent Developments
- 16.2.10.5. Financials (Based on Availability)
- 16.2.11 Servicenow Inc
- 16.2.11.1. Overview
- 16.2.11.2. Products
- 16.2.11.3. SWOT Analysis
- 16.2.11.4. Recent Developments
- 16.2.11.5. Financials (Based on Availability)
- 16.2.12 Interlink Software Services Ltd
- 16.2.12.1. Overview
- 16.2.12.2. Products
- 16.2.12.3. SWOT Analysis
- 16.2.12.4. Recent Developments
- 16.2.12.5. Financials (Based on Availability)
- 16.2.13 VMware Inc
- 16.2.13.1. Overview
- 16.2.13.2. Products
- 16.2.13.3. SWOT Analysis
- 16.2.13.4. Recent Developments
- 16.2.13.5. Financials (Based on Availability)
- 16.2.14 Splunk Inc
- 16.2.14.1. Overview
- 16.2.14.2. Products
- 16.2.14.3. SWOT Analysis
- 16.2.14.4. Recent Developments
- 16.2.14.5. Financials (Based on Availability)
- 16.2.15 Dynatrace LLC
- 16.2.15.1. Overview
- 16.2.15.2. Products
- 16.2.15.3. SWOT Analysis
- 16.2.15.4. Recent Developments
- 16.2.15.5. Financials (Based on Availability)
- 16.2.16 HCL Technologies Limited
- 16.2.16.1. Overview
- 16.2.16.2. Products
- 16.2.16.3. SWOT Analysis
- 16.2.16.4. Recent Developments
- 16.2.16.5. Financials (Based on Availability)
- 16.2.1 IBM Corporation
List of Figures
- Figure 1: Global Cognitive Operations Market Revenue Breakdown (Million, %) by Region 2024 & 2032
- Figure 2: North America Cognitive Operations Market Revenue (Million), by Country 2024 & 2032
- Figure 3: North America Cognitive Operations Market Revenue Share (%), by Country 2024 & 2032
- Figure 4: Europe Cognitive Operations Market Revenue (Million), by Country 2024 & 2032
- Figure 5: Europe Cognitive Operations Market Revenue Share (%), by Country 2024 & 2032
- Figure 6: Asia Pacific Cognitive Operations Market Revenue (Million), by Country 2024 & 2032
- Figure 7: Asia Pacific Cognitive Operations Market Revenue Share (%), by Country 2024 & 2032
- Figure 8: South America Cognitive Operations Market Revenue (Million), by Country 2024 & 2032
- Figure 9: South America Cognitive Operations Market Revenue Share (%), by Country 2024 & 2032
- Figure 10: North America Cognitive Operations Market Revenue (Million), by Country 2024 & 2032
- Figure 11: North America Cognitive Operations Market Revenue Share (%), by Country 2024 & 2032
- Figure 12: MEA Cognitive Operations Market Revenue (Million), by Country 2024 & 2032
- Figure 13: MEA Cognitive Operations Market Revenue Share (%), by Country 2024 & 2032
- Figure 14: North America Cognitive Operations Market Revenue (Million), by Component 2024 & 2032
- Figure 15: North America Cognitive Operations Market Revenue Share (%), by Component 2024 & 2032
- Figure 16: North America Cognitive Operations Market Revenue (Million), by Deployment Mode 2024 & 2032
- Figure 17: North America Cognitive Operations Market Revenue Share (%), by Deployment Mode 2024 & 2032
- Figure 18: North America Cognitive Operations Market Revenue (Million), by Enterprise Size 2024 & 2032
- Figure 19: North America Cognitive Operations Market Revenue Share (%), by Enterprise Size 2024 & 2032
- Figure 20: North America Cognitive Operations Market Revenue (Million), by Application 2024 & 2032
- Figure 21: North America Cognitive Operations Market Revenue Share (%), by Application 2024 & 2032
- Figure 22: North America Cognitive Operations Market Revenue (Million), by Industry Vertical 2024 & 2032
- Figure 23: North America Cognitive Operations Market Revenue Share (%), by Industry Vertical 2024 & 2032
- Figure 24: North America Cognitive Operations Market Revenue (Million), by Country 2024 & 2032
- Figure 25: North America Cognitive Operations Market Revenue Share (%), by Country 2024 & 2032
- Figure 26: Europe Cognitive Operations Market Revenue (Million), by Component 2024 & 2032
- Figure 27: Europe Cognitive Operations Market Revenue Share (%), by Component 2024 & 2032
- Figure 28: Europe Cognitive Operations Market Revenue (Million), by Deployment Mode 2024 & 2032
- Figure 29: Europe Cognitive Operations Market Revenue Share (%), by Deployment Mode 2024 & 2032
- Figure 30: Europe Cognitive Operations Market Revenue (Million), by Enterprise Size 2024 & 2032
- Figure 31: Europe Cognitive Operations Market Revenue Share (%), by Enterprise Size 2024 & 2032
- Figure 32: Europe Cognitive Operations Market Revenue (Million), by Application 2024 & 2032
- Figure 33: Europe Cognitive Operations Market Revenue Share (%), by Application 2024 & 2032
- Figure 34: Europe Cognitive Operations Market Revenue (Million), by Industry Vertical 2024 & 2032
- Figure 35: Europe Cognitive Operations Market Revenue Share (%), by Industry Vertical 2024 & 2032
- Figure 36: Europe Cognitive Operations Market Revenue (Million), by Country 2024 & 2032
- Figure 37: Europe Cognitive Operations Market Revenue Share (%), by Country 2024 & 2032
- Figure 38: Asia Pacific Cognitive Operations Market Revenue (Million), by Component 2024 & 2032
- Figure 39: Asia Pacific Cognitive Operations Market Revenue Share (%), by Component 2024 & 2032
- Figure 40: Asia Pacific Cognitive Operations Market Revenue (Million), by Deployment Mode 2024 & 2032
- Figure 41: Asia Pacific Cognitive Operations Market Revenue Share (%), by Deployment Mode 2024 & 2032
- Figure 42: Asia Pacific Cognitive Operations Market Revenue (Million), by Enterprise Size 2024 & 2032
- Figure 43: Asia Pacific Cognitive Operations Market Revenue Share (%), by Enterprise Size 2024 & 2032
- Figure 44: Asia Pacific Cognitive Operations Market Revenue (Million), by Application 2024 & 2032
- Figure 45: Asia Pacific Cognitive Operations Market Revenue Share (%), by Application 2024 & 2032
- Figure 46: Asia Pacific Cognitive Operations Market Revenue (Million), by Industry Vertical 2024 & 2032
- Figure 47: Asia Pacific Cognitive Operations Market Revenue Share (%), by Industry Vertical 2024 & 2032
- Figure 48: Asia Pacific Cognitive Operations Market Revenue (Million), by Country 2024 & 2032
- Figure 49: Asia Pacific Cognitive Operations Market Revenue Share (%), by Country 2024 & 2032
- Figure 50: Rest of the World Cognitive Operations Market Revenue (Million), by Component 2024 & 2032
- Figure 51: Rest of the World Cognitive Operations Market Revenue Share (%), by Component 2024 & 2032
- Figure 52: Rest of the World Cognitive Operations Market Revenue (Million), by Deployment Mode 2024 & 2032
- Figure 53: Rest of the World Cognitive Operations Market Revenue Share (%), by Deployment Mode 2024 & 2032
- Figure 54: Rest of the World Cognitive Operations Market Revenue (Million), by Enterprise Size 2024 & 2032
- Figure 55: Rest of the World Cognitive Operations Market Revenue Share (%), by Enterprise Size 2024 & 2032
- Figure 56: Rest of the World Cognitive Operations Market Revenue (Million), by Application 2024 & 2032
- Figure 57: Rest of the World Cognitive Operations Market Revenue Share (%), by Application 2024 & 2032
- Figure 58: Rest of the World Cognitive Operations Market Revenue (Million), by Industry Vertical 2024 & 2032
- Figure 59: Rest of the World Cognitive Operations Market Revenue Share (%), by Industry Vertical 2024 & 2032
- Figure 60: Rest of the World Cognitive Operations Market Revenue (Million), by Country 2024 & 2032
- Figure 61: Rest of the World Cognitive Operations Market Revenue Share (%), by Country 2024 & 2032
List of Tables
- Table 1: Global Cognitive Operations Market Revenue Million Forecast, by Region 2019 & 2032
- Table 2: Global Cognitive Operations Market Revenue Million Forecast, by Component 2019 & 2032
- Table 3: Global Cognitive Operations Market Revenue Million Forecast, by Deployment Mode 2019 & 2032
- Table 4: Global Cognitive Operations Market Revenue Million Forecast, by Enterprise Size 2019 & 2032
- Table 5: Global Cognitive Operations Market Revenue Million Forecast, by Application 2019 & 2032
- Table 6: Global Cognitive Operations Market Revenue Million Forecast, by Industry Vertical 2019 & 2032
- Table 7: Global Cognitive Operations Market Revenue Million Forecast, by Region 2019 & 2032
- Table 8: Global Cognitive Operations Market Revenue Million Forecast, by Country 2019 & 2032
- Table 9: United States Cognitive Operations Market Revenue (Million) Forecast, by Application 2019 & 2032
- Table 10: Canada Cognitive Operations Market Revenue (Million) Forecast, by Application 2019 & 2032
- Table 11: Mexico Cognitive Operations Market Revenue (Million) Forecast, by Application 2019 & 2032
- Table 12: Global Cognitive Operations Market Revenue Million Forecast, by Country 2019 & 2032
- Table 13: Germany Cognitive Operations Market Revenue (Million) Forecast, by Application 2019 & 2032
- Table 14: United Kingdom Cognitive Operations Market Revenue (Million) Forecast, by Application 2019 & 2032
- Table 15: France Cognitive Operations Market Revenue (Million) Forecast, by Application 2019 & 2032
- Table 16: Spain Cognitive Operations Market Revenue (Million) Forecast, by Application 2019 & 2032
- Table 17: Italy Cognitive Operations Market Revenue (Million) Forecast, by Application 2019 & 2032
- Table 18: Spain Cognitive Operations Market Revenue (Million) Forecast, by Application 2019 & 2032
- Table 19: Belgium Cognitive Operations Market Revenue (Million) Forecast, by Application 2019 & 2032
- Table 20: Netherland Cognitive Operations Market Revenue (Million) Forecast, by Application 2019 & 2032
- Table 21: Nordics Cognitive Operations Market Revenue (Million) Forecast, by Application 2019 & 2032
- Table 22: Rest of Europe Cognitive Operations Market Revenue (Million) Forecast, by Application 2019 & 2032
- Table 23: Global Cognitive Operations Market Revenue Million Forecast, by Country 2019 & 2032
- Table 24: China Cognitive Operations Market Revenue (Million) Forecast, by Application 2019 & 2032
- Table 25: Japan Cognitive Operations Market Revenue (Million) Forecast, by Application 2019 & 2032
- Table 26: India Cognitive Operations Market Revenue (Million) Forecast, by Application 2019 & 2032
- Table 27: South Korea Cognitive Operations Market Revenue (Million) Forecast, by Application 2019 & 2032
- Table 28: Southeast Asia Cognitive Operations Market Revenue (Million) Forecast, by Application 2019 & 2032
- Table 29: Australia Cognitive Operations Market Revenue (Million) Forecast, by Application 2019 & 2032
- Table 30: Indonesia Cognitive Operations Market Revenue (Million) Forecast, by Application 2019 & 2032
- Table 31: Phillipes Cognitive Operations Market Revenue (Million) Forecast, by Application 2019 & 2032
- Table 32: Singapore Cognitive Operations Market Revenue (Million) Forecast, by Application 2019 & 2032
- Table 33: Thailandc Cognitive Operations Market Revenue (Million) Forecast, by Application 2019 & 2032
- Table 34: Rest of Asia Pacific Cognitive Operations Market Revenue (Million) Forecast, by Application 2019 & 2032
- Table 35: Global Cognitive Operations Market Revenue Million Forecast, by Country 2019 & 2032
- Table 36: Brazil Cognitive Operations Market Revenue (Million) Forecast, by Application 2019 & 2032
- Table 37: Argentina Cognitive Operations Market Revenue (Million) Forecast, by Application 2019 & 2032
- Table 38: Peru Cognitive Operations Market Revenue (Million) Forecast, by Application 2019 & 2032
- Table 39: Chile Cognitive Operations Market Revenue (Million) Forecast, by Application 2019 & 2032
- Table 40: Colombia Cognitive Operations Market Revenue (Million) Forecast, by Application 2019 & 2032
- Table 41: Ecuador Cognitive Operations Market Revenue (Million) Forecast, by Application 2019 & 2032
- Table 42: Venezuela Cognitive Operations Market Revenue (Million) Forecast, by Application 2019 & 2032
- Table 43: Rest of South America Cognitive Operations Market Revenue (Million) Forecast, by Application 2019 & 2032
- Table 44: Global Cognitive Operations Market Revenue Million Forecast, by Country 2019 & 2032
- Table 45: United States Cognitive Operations Market Revenue (Million) Forecast, by Application 2019 & 2032
- Table 46: Canada Cognitive Operations Market Revenue (Million) Forecast, by Application 2019 & 2032
- Table 47: Mexico Cognitive Operations Market Revenue (Million) Forecast, by Application 2019 & 2032
- Table 48: Global Cognitive Operations Market Revenue Million Forecast, by Country 2019 & 2032
- Table 49: United Arab Emirates Cognitive Operations Market Revenue (Million) Forecast, by Application 2019 & 2032
- Table 50: Saudi Arabia Cognitive Operations Market Revenue (Million) Forecast, by Application 2019 & 2032
- Table 51: South Africa Cognitive Operations Market Revenue (Million) Forecast, by Application 2019 & 2032
- Table 52: Rest of Middle East and Africa Cognitive Operations Market Revenue (Million) Forecast, by Application 2019 & 2032
- Table 53: Global Cognitive Operations Market Revenue Million Forecast, by Component 2019 & 2032
- Table 54: Global Cognitive Operations Market Revenue Million Forecast, by Deployment Mode 2019 & 2032
- Table 55: Global Cognitive Operations Market Revenue Million Forecast, by Enterprise Size 2019 & 2032
- Table 56: Global Cognitive Operations Market Revenue Million Forecast, by Application 2019 & 2032
- Table 57: Global Cognitive Operations Market Revenue Million Forecast, by Industry Vertical 2019 & 2032
- Table 58: Global Cognitive Operations Market Revenue Million Forecast, by Country 2019 & 2032
- Table 59: Global Cognitive Operations Market Revenue Million Forecast, by Component 2019 & 2032
- Table 60: Global Cognitive Operations Market Revenue Million Forecast, by Deployment Mode 2019 & 2032
- Table 61: Global Cognitive Operations Market Revenue Million Forecast, by Enterprise Size 2019 & 2032
- Table 62: Global Cognitive Operations Market Revenue Million Forecast, by Application 2019 & 2032
- Table 63: Global Cognitive Operations Market Revenue Million Forecast, by Industry Vertical 2019 & 2032
- Table 64: Global Cognitive Operations Market Revenue Million Forecast, by Country 2019 & 2032
- Table 65: Global Cognitive Operations Market Revenue Million Forecast, by Component 2019 & 2032
- Table 66: Global Cognitive Operations Market Revenue Million Forecast, by Deployment Mode 2019 & 2032
- Table 67: Global Cognitive Operations Market Revenue Million Forecast, by Enterprise Size 2019 & 2032
- Table 68: Global Cognitive Operations Market Revenue Million Forecast, by Application 2019 & 2032
- Table 69: Global Cognitive Operations Market Revenue Million Forecast, by Industry Vertical 2019 & 2032
- Table 70: Global Cognitive Operations Market Revenue Million Forecast, by Country 2019 & 2032
- Table 71: Global Cognitive Operations Market Revenue Million Forecast, by Component 2019 & 2032
- Table 72: Global Cognitive Operations Market Revenue Million Forecast, by Deployment Mode 2019 & 2032
- Table 73: Global Cognitive Operations Market Revenue Million Forecast, by Enterprise Size 2019 & 2032
- Table 74: Global Cognitive Operations Market Revenue Million Forecast, by Application 2019 & 2032
- Table 75: Global Cognitive Operations Market Revenue Million Forecast, by Industry Vertical 2019 & 2032
- Table 76: Global Cognitive Operations Market Revenue Million Forecast, by Country 2019 & 2032
Frequently Asked Questions
1. What is the projected Compound Annual Growth Rate (CAGR) of the Cognitive Operations Market?
The projected CAGR is approximately 16.38%.
2. Which companies are prominent players in the Cognitive Operations Market?
Key companies in the market include IBM Corporation, Loom Systems Inc, New Relic Inc, Micro Focus International Plc, DEVO Technology Inc, Broadcom Inc, ScienceLogic Inc, CloudFabrix Software Inc, BMC Software Inc, Correlata Solutions Inc, Servicenow Inc, Interlink Software Services Ltd, VMware Inc, Splunk Inc, Dynatrace LLC, HCL Technologies Limited.
3. What are the main segments of the Cognitive Operations Market?
The market segments include Component, Deployment Mode, Enterprise Size , Application, Industry Vertical.
4. Can you provide details about the market size?
The market size is estimated to be USD 17.59 Million as of 2022.
5. What are some drivers contributing to market growth?
Growing Focus Toward Selection of Cloud-Based Cognitive IT Operations Solutions; Rising Demand for Monitoring the Complex IT Environment.
6. What are the notable trends driving market growth?
IT and Telecommunication Segment to Grow Significantly.
7. Are there any restraints impacting market growth?
Integration of Cognitive Operations Capabilities With the Present Systems; Dearth of Skills and Expertise.
8. Can you provide examples of recent developments in the market?
March 2023: TCS Cognitive Plant Operations Adviser launched for industries in manufacturing, oil and gas, and consumer packaged goods to transform manufacturing by utilizing machine learning and artificial intelligence to make it more intelligent, flexible, and resilient. The TCS Cognitive Plant Operations Adviser connects with Microsoft Azure private mobile edge computing (PMEC) for waste reduction, increased equipment uptime, and eliminating safety problems. For quick and independent decision-making, it gives plant operators insights and data.
9. What pricing options are available for accessing the report?
Pricing options include single-user, multi-user, and enterprise licenses priced at USD 4750, USD 5250, and USD 8750 respectively.
10. Is the market size provided in terms of value or volume?
The market size is provided in terms of value, measured in Million.
11. Are there any specific market keywords associated with the report?
Yes, the market keyword associated with the report is "Cognitive Operations Market," which aids in identifying and referencing the specific market segment covered.
12. How do I determine which pricing option suits my needs best?
The pricing options vary based on user requirements and access needs. Individual users may opt for single-user licenses, while businesses requiring broader access may choose multi-user or enterprise licenses for cost-effective access to the report.
13. Are there any additional resources or data provided in the Cognitive Operations Market report?
While the report offers comprehensive insights, it's advisable to review the specific contents or supplementary materials provided to ascertain if additional resources or data are available.
14. How can I stay updated on further developments or reports in the Cognitive Operations Market?
To stay informed about further developments, trends, and reports in the Cognitive Operations Market, consider subscribing to industry newsletters, following relevant companies and organizations, or regularly checking reputable industry news sources and publications.
Methodology
Step 1 - Identification of Relevant Samples Size from Population Database


Step 2 - Approaches for Defining Global Market Size (Value, Volume* & Price*)

Note*: In applicable scenarios
Step 3 - Data Sources
Primary Research
- Web Analytics
- Survey Reports
- Research Institute
- Latest Research Reports
- Opinion Leaders
Secondary Research
- Annual Reports
- White Paper
- Latest Press Release
- Industry Association
- Paid Database
- Investor Presentations

Step 4 - Data Triangulation
Involves using different sources of information in order to increase the validity of a study
These sources are likely to be stakeholders in a program - participants, other researchers, program staff, other community members, and so on.
Then we put all data in single framework & apply various statistical tools to find out the dynamic on the market.
During the analysis stage, feedback from the stakeholder groups would be compared to determine areas of agreement as well as areas of divergence
