

Key Insights
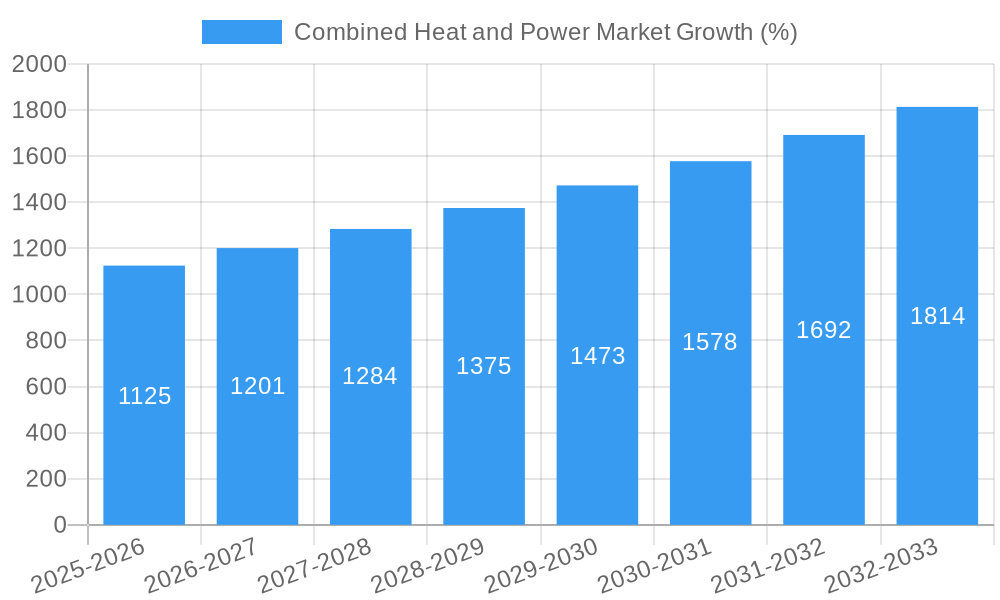
The Combined Heat and Power (CHP) market is experiencing robust growth, projected to maintain a Compound Annual Growth Rate (CAGR) exceeding 7.5% from 2025 to 2033. This expansion is driven by increasing energy efficiency regulations, rising electricity costs, and the growing demand for sustainable energy solutions across various sectors. The commercial sector currently leads in CHP adoption, primarily due to the economic benefits of on-site power generation and waste heat recovery. However, the residential and industrial sectors are also witnessing significant growth, fueled by technological advancements leading to smaller, more efficient CHP units suitable for diverse applications. Natural gas remains the dominant fuel source, although renewable energy integration, such as biomass and biogas, is gaining traction, driven by environmental concerns and government incentives. Key restraints include high initial investment costs for CHP systems, complex installation processes, and the need for skilled technicians for operation and maintenance. Nevertheless, government support programs aimed at promoting energy efficiency and reducing carbon emissions are expected to mitigate these challenges and further stimulate market growth.
The geographical distribution of the CHP market reveals strong regional variations. North America, particularly the United States, benefits from a well-established infrastructure and robust industrial base, ensuring substantial market share. Europe follows closely, driven by stringent environmental policies and significant investments in renewable energy. The Asia-Pacific region is experiencing rapid expansion, particularly in China, India, and Japan, fueled by rapid urbanization and industrial development. While South America and the Middle East and Africa regions show slower growth, increasing energy demand and infrastructure development are poised to unlock significant future potential. Key players such as ABB Ltd, General Electric Company, and Siemens Energy AG are strategically positioned to capitalize on these trends through technological innovation, strategic partnerships, and expanding their global footprint. The long-term outlook for the CHP market remains positive, with continuous technological advancements, supportive government policies, and increasing awareness of sustainability contributing to sustained growth.

Combined Heat and Power (CHP) Market: A Comprehensive Report (2019-2033)
This in-depth report provides a comprehensive analysis of the Combined Heat and Power (CHP) market, encompassing market dynamics, growth trends, regional performance, product landscape, key players, and future outlook. The study covers the historical period (2019-2024), base year (2025), and forecast period (2025-2033), offering invaluable insights for industry professionals, investors, and strategic decision-makers. The report segments the market by end-user sector (commercial, residential, industrial, and utility), type (gas turbine, steam turbine, other types), and fuel type (natural gas, renewables, other fuel types). The total market size is projected to reach xx Million by 2033.
Combined Heat and Power Market Market Dynamics & Structure
This section analyzes the intricate structure of the CHP market, exploring its concentration levels, innovative technological drivers, regulatory landscape, competitive substitutes, end-user demographics, and mergers & acquisitions (M&A) activity. The global CHP market is characterized by a moderately consolidated structure, with key players holding significant market share.
- Market Concentration: The top 10 players account for approximately xx% of the global market share in 2025.
- Technological Innovation: Advancements in gas turbine technology, the integration of renewables, and the development of highly efficient CHP systems are major drivers.
- Regulatory Framework: Government policies promoting energy efficiency and renewable energy integration significantly influence market growth. Incentives and regulations vary across regions.
- Competitive Substitutes: Traditional power generation methods pose a competitive challenge, but CHP offers superior efficiency and cost savings.
- End-User Demographics: The industrial sector is currently the largest consumer of CHP, followed by the commercial sector. However, residential adoption is anticipated to grow significantly in the forecast period.
- M&A Trends: The CHP market has witnessed a moderate level of M&A activity, primarily driven by strategic acquisitions aimed at expanding product portfolios and market reach. An estimated xx M&A deals were recorded between 2019 and 2024.
Combined Heat and Power Market Growth Trends & Insights
The CHP market is experiencing robust growth, driven by increasing energy demand, rising energy costs, and stringent environmental regulations. This section analyzes market size evolution, adoption rates, technological disruptions, and shifts in consumer behavior. The market is projected to exhibit a CAGR of xx% during the forecast period (2025-2033). Market penetration is expected to increase from xx% in 2025 to xx% by 2033. Technological disruptions, such as the integration of digital technologies and artificial intelligence, are improving efficiency and operational optimization of CHP systems. Consumer behavior is shifting toward sustainable energy solutions, fueling the demand for CHP systems.
Dominant Regions, Countries, or Segments in Combined Heat and Power Market
The Combined Heat and Power (CHP) market is experiencing dynamic growth, with Europe and North America currently holding the largest market shares. This dominance is fueled by established industrial bases and supportive government policies that incentivize energy efficiency and reduced carbon emissions. However, the Asia-Pacific region is projected to exhibit the most rapid expansion in the coming years, driven by accelerating industrialization and urbanization, creating significant untapped potential. This growth is further segmented by fuel type, with renewable sources gaining significant traction.
- Leading Regions: Europe and North America currently lead the market, benefiting from mature infrastructure and established regulatory frameworks.
- High-Growth Segments: The industrial sector remains the largest consumer of CHP technology, while the renewable fuel segment (e.g., biomass, biogas) is experiencing the most substantial growth, reflecting a global shift towards sustainable energy solutions.
- Key Drivers: Stringent environmental regulations worldwide are pushing for cleaner energy solutions, while government incentives, including tax credits and subsidies, actively promote CHP adoption. Rising energy prices further enhance the economic viability of CHP systems, making them increasingly attractive to businesses and municipalities. Specific examples like the Greek state aid scheme (EUR 2.27 billion) highlight the significant financial commitment to boosting CHP deployment in Europe.
- Factors Contributing to Regional Dominance: Advanced technological capabilities, robust industrial infrastructure, and proactive government policies are key factors driving market leadership in established regions.
Combined Heat and Power Market Product Landscape
The CHP market offers a diverse range of products, including gas turbines, steam turbines, and other types. Recent innovations focus on enhancing efficiency, reducing emissions, and incorporating smart technologies for optimized performance. Key features include improved fuel flexibility, advanced control systems, and reduced operational costs. These advancements have enhanced the appeal of CHP systems across various applications.
Key Drivers, Barriers & Challenges in Combined Heat and Power Market
Key Drivers:
- Escalating Energy Demand and Costs: Growing energy consumption coupled with volatile energy prices makes CHP an increasingly attractive solution for cost-effective and reliable energy generation.
- Stringent Environmental Regulations: Global initiatives to reduce greenhouse gas emissions and improve air quality are creating significant demand for efficient and low-emission CHP systems.
- Government Incentives and Subsidies: Financial support mechanisms, such as tax breaks, grants, and feed-in tariffs, are instrumental in accelerating CHP adoption.
- Technological Advancements: Continuous improvements in CHP technology are resulting in higher efficiency rates, reduced emissions, and greater flexibility in system design and integration.
Key Challenges:
- High Initial Investment Costs: The substantial upfront investment required for CHP system installation can be a barrier to entry for some businesses and organizations.
- Technological Complexities and Integration Challenges: The integration of CHP systems into existing infrastructure can be complex and require specialized expertise.
- Regulatory Uncertainties and Regional Variations: Inconsistent regulatory frameworks across different regions can create uncertainty and hinder market development.
- Competition from Traditional Power Generation: CHP faces competition from established power generation methods, requiring continuous innovation and cost optimization to remain competitive. The impact of these challenges is estimated to reduce the market size by approximately xx Million by 2033.
Emerging Opportunities in Combined Heat and Power Market
- Expansion into untapped markets, particularly in developing economies.
- Integration of CHP systems with renewable energy sources.
- Development of smart CHP systems with advanced digital capabilities.
- Growing demand for decentralized energy generation solutions.
Growth Accelerators in the Combined Heat and Power Market Industry
Technological advancements, strategic partnerships, and expanding market penetration in developing economies are key catalysts driving long-term growth in the CHP market. Furthermore, the increasing focus on sustainable energy solutions is creating a favorable environment for CHP adoption, further accelerating market expansion.
Key Players Shaping the Combined Heat and Power Market Market
- ABB Ltd
- FuelCell Energy Inc
- Aegis Energy Services LLC
- Bosch Thermotechnology GmbH
- Mitsubishi Electric Corporation
- Caterpillar Inc
- Centrica PLC
- Wartsila Oyj Abp
- MAN Diesel & Turbo SE
- Seimens Energy AG
- General Electric Company
- Kawasaki Heavy Industries Ltd
- Viessmann Werke Group GmbH & Co KG
Notable Milestones in Combined Heat and Power Market Sector
- November 2021: The European Commission's approval of Greece's EUR 2.27 billion state aid scheme for renewable energy and high-efficiency CHP plants signifies a major commitment to sustainable energy solutions.
- June 2021: Germany's awarding of 25.37 MW of combined heat and power plant projects demonstrates the country's ongoing support for innovative CHP capacity and its commitment to energy diversification.
- [Add other significant milestones and news here, including merger & acquisitions, new product launches, expansion into new markets, etc.]
In-Depth Combined Heat and Power Market Market Outlook
The CHP market is poised for substantial growth, driven by a powerful convergence of factors. Increasing energy demand, stringent environmental regulations, and advancements in CHP technology are creating a favorable landscape for market expansion. Strategic partnerships, geographical expansion into emerging markets, and the development of innovative CHP systems, such as those incorporating advanced digital controls and AI for optimized performance, will further fuel market growth and create significant opportunities for existing and new market players. The integration of CHP with renewable energy sources, such as solar and wind power, will also play a crucial role in shaping the future of the CHP market. The long-term outlook remains positive, with continued growth expected in both mature and emerging markets.
Combined Heat and Power Market Segmentation
-
1. End-user Sector
- 1.1. Commercial
- 1.2. Residential
- 1.3. Industrial and Utility
-
2. Type
- 2.1. Gas Turbine
- 2.2. Steam Turbine
- 2.3. Other Types
-
3. Fuel Type
- 3.1. Natural Gas
- 3.2. Renewables
- 3.3. Other Fuel Types
Combined Heat and Power Market Segmentation By Geography
- 1. North America
- 2. Europe
- 3. Asia Pacific
- 4. South America
- 5. Middle East and Africa

Combined Heat and Power Market REPORT HIGHLIGHTS
| Aspects | Details |
|---|---|
| Study Period | 2019-2033 |
| Base Year | 2024 |
| Estimated Year | 2025 |
| Forecast Period | 2025-2033 |
| Historical Period | 2019-2024 |
| Growth Rate | CAGR of > 7.50% from 2019-2033 |
| Segmentation |
|
Table of Contents
- 1. Introduction
- 1.1. Research Scope
- 1.2. Market Segmentation
- 1.3. Research Methodology
- 1.4. Definitions and Assumptions
- 2. Executive Summary
- 2.1. Introduction
- 3. Market Dynamics
- 3.1. Introduction
- 3.2. Market Drivers
- 3.2.1. 4.; Declining Costs and Increasing Efficiencies of Solar PV Panels 4.; Supportive Government Policies Towards Solar
- 3.3. Market Restrains
- 3.3.1. 4.; Increasing Adoption of Alternative Clean Energy Sources and Increasing Natural Gas Consumption
- 3.4. Market Trends
- 3.4.1. Natural Gas-based Fuel Type to Witness a Significant Growth
- 4. Market Factor Analysis
- 4.1. Porters Five Forces
- 4.2. Supply/Value Chain
- 4.3. PESTEL analysis
- 4.4. Market Entropy
- 4.5. Patent/Trademark Analysis
- 5. Global Combined Heat and Power Market Analysis, Insights and Forecast, 2019-2031
- 5.1. Market Analysis, Insights and Forecast - by End-user Sector
- 5.1.1. Commercial
- 5.1.2. Residential
- 5.1.3. Industrial and Utility
- 5.2. Market Analysis, Insights and Forecast - by Type
- 5.2.1. Gas Turbine
- 5.2.2. Steam Turbine
- 5.2.3. Other Types
- 5.3. Market Analysis, Insights and Forecast - by Fuel Type
- 5.3.1. Natural Gas
- 5.3.2. Renewables
- 5.3.3. Other Fuel Types
- 5.4. Market Analysis, Insights and Forecast - by Region
- 5.4.1. North America
- 5.4.2. Europe
- 5.4.3. Asia Pacific
- 5.4.4. South America
- 5.4.5. Middle East and Africa
- 5.1. Market Analysis, Insights and Forecast - by End-user Sector
- 6. North America Combined Heat and Power Market Analysis, Insights and Forecast, 2019-2031
- 6.1. Market Analysis, Insights and Forecast - by End-user Sector
- 6.1.1. Commercial
- 6.1.2. Residential
- 6.1.3. Industrial and Utility
- 6.2. Market Analysis, Insights and Forecast - by Type
- 6.2.1. Gas Turbine
- 6.2.2. Steam Turbine
- 6.2.3. Other Types
- 6.3. Market Analysis, Insights and Forecast - by Fuel Type
- 6.3.1. Natural Gas
- 6.3.2. Renewables
- 6.3.3. Other Fuel Types
- 6.1. Market Analysis, Insights and Forecast - by End-user Sector
- 7. Europe Combined Heat and Power Market Analysis, Insights and Forecast, 2019-2031
- 7.1. Market Analysis, Insights and Forecast - by End-user Sector
- 7.1.1. Commercial
- 7.1.2. Residential
- 7.1.3. Industrial and Utility
- 7.2. Market Analysis, Insights and Forecast - by Type
- 7.2.1. Gas Turbine
- 7.2.2. Steam Turbine
- 7.2.3. Other Types
- 7.3. Market Analysis, Insights and Forecast - by Fuel Type
- 7.3.1. Natural Gas
- 7.3.2. Renewables
- 7.3.3. Other Fuel Types
- 7.1. Market Analysis, Insights and Forecast - by End-user Sector
- 8. Asia Pacific Combined Heat and Power Market Analysis, Insights and Forecast, 2019-2031
- 8.1. Market Analysis, Insights and Forecast - by End-user Sector
- 8.1.1. Commercial
- 8.1.2. Residential
- 8.1.3. Industrial and Utility
- 8.2. Market Analysis, Insights and Forecast - by Type
- 8.2.1. Gas Turbine
- 8.2.2. Steam Turbine
- 8.2.3. Other Types
- 8.3. Market Analysis, Insights and Forecast - by Fuel Type
- 8.3.1. Natural Gas
- 8.3.2. Renewables
- 8.3.3. Other Fuel Types
- 8.1. Market Analysis, Insights and Forecast - by End-user Sector
- 9. South America Combined Heat and Power Market Analysis, Insights and Forecast, 2019-2031
- 9.1. Market Analysis, Insights and Forecast - by End-user Sector
- 9.1.1. Commercial
- 9.1.2. Residential
- 9.1.3. Industrial and Utility
- 9.2. Market Analysis, Insights and Forecast - by Type
- 9.2.1. Gas Turbine
- 9.2.2. Steam Turbine
- 9.2.3. Other Types
- 9.3. Market Analysis, Insights and Forecast - by Fuel Type
- 9.3.1. Natural Gas
- 9.3.2. Renewables
- 9.3.3. Other Fuel Types
- 9.1. Market Analysis, Insights and Forecast - by End-user Sector
- 10. Middle East and Africa Combined Heat and Power Market Analysis, Insights and Forecast, 2019-2031
- 10.1. Market Analysis, Insights and Forecast - by End-user Sector
- 10.1.1. Commercial
- 10.1.2. Residential
- 10.1.3. Industrial and Utility
- 10.2. Market Analysis, Insights and Forecast - by Type
- 10.2.1. Gas Turbine
- 10.2.2. Steam Turbine
- 10.2.3. Other Types
- 10.3. Market Analysis, Insights and Forecast - by Fuel Type
- 10.3.1. Natural Gas
- 10.3.2. Renewables
- 10.3.3. Other Fuel Types
- 10.1. Market Analysis, Insights and Forecast - by End-user Sector
- 11. North America Combined Heat and Power Market Analysis, Insights and Forecast, 2019-2031
- 11.1. Market Analysis, Insights and Forecast - By Country/Sub-region
- 11.1.1 United States
- 11.1.2 Canada
- 11.1.3 Mexico
- 12. Europe Combined Heat and Power Market Analysis, Insights and Forecast, 2019-2031
- 12.1. Market Analysis, Insights and Forecast - By Country/Sub-region
- 12.1.1 Germany
- 12.1.2 United Kingdom
- 12.1.3 France
- 12.1.4 Spain
- 12.1.5 Italy
- 12.1.6 Spain
- 12.1.7 Belgium
- 12.1.8 Netherland
- 12.1.9 Nordics
- 12.1.10 Rest of Europe
- 13. Asia Pacific Combined Heat and Power Market Analysis, Insights and Forecast, 2019-2031
- 13.1. Market Analysis, Insights and Forecast - By Country/Sub-region
- 13.1.1 China
- 13.1.2 Japan
- 13.1.3 India
- 13.1.4 South Korea
- 13.1.5 Southeast Asia
- 13.1.6 Australia
- 13.1.7 Indonesia
- 13.1.8 Phillipes
- 13.1.9 Singapore
- 13.1.10 Thailandc
- 13.1.11 Rest of Asia Pacific
- 14. South America Combined Heat and Power Market Analysis, Insights and Forecast, 2019-2031
- 14.1. Market Analysis, Insights and Forecast - By Country/Sub-region
- 14.1.1 Brazil
- 14.1.2 Argentina
- 14.1.3 Peru
- 14.1.4 Chile
- 14.1.5 Colombia
- 14.1.6 Ecuador
- 14.1.7 Venezuela
- 14.1.8 Rest of South America
- 15. MEA Combined Heat and Power Market Analysis, Insights and Forecast, 2019-2031
- 15.1. Market Analysis, Insights and Forecast - By Country/Sub-region
- 15.1.1 United Arab Emirates
- 15.1.2 Saudi Arabia
- 15.1.3 South Africa
- 15.1.4 Rest of Middle East and Africa
- 16. Competitive Analysis
- 16.1. Global Market Share Analysis 2024
- 16.2. Company Profiles
- 16.2.1 ABB Ltd
- 16.2.1.1. Overview
- 16.2.1.2. Products
- 16.2.1.3. SWOT Analysis
- 16.2.1.4. Recent Developments
- 16.2.1.5. Financials (Based on Availability)
- 16.2.2 FuelCell Energy Inc
- 16.2.2.1. Overview
- 16.2.2.2. Products
- 16.2.2.3. SWOT Analysis
- 16.2.2.4. Recent Developments
- 16.2.2.5. Financials (Based on Availability)
- 16.2.3 Aegis Energy Services LLC
- 16.2.3.1. Overview
- 16.2.3.2. Products
- 16.2.3.3. SWOT Analysis
- 16.2.3.4. Recent Developments
- 16.2.3.5. Financials (Based on Availability)
- 16.2.4 Bosch Thermotechnology GmbH
- 16.2.4.1. Overview
- 16.2.4.2. Products
- 16.2.4.3. SWOT Analysis
- 16.2.4.4. Recent Developments
- 16.2.4.5. Financials (Based on Availability)
- 16.2.5 Mitsubishi Electric Corporation
- 16.2.5.1. Overview
- 16.2.5.2. Products
- 16.2.5.3. SWOT Analysis
- 16.2.5.4. Recent Developments
- 16.2.5.5. Financials (Based on Availability)
- 16.2.6 Caterpillar Inc
- 16.2.6.1. Overview
- 16.2.6.2. Products
- 16.2.6.3. SWOT Analysis
- 16.2.6.4. Recent Developments
- 16.2.6.5. Financials (Based on Availability)
- 16.2.7 Centrica PLC
- 16.2.7.1. Overview
- 16.2.7.2. Products
- 16.2.7.3. SWOT Analysis
- 16.2.7.4. Recent Developments
- 16.2.7.5. Financials (Based on Availability)
- 16.2.8 Wartsila Oyj Abp
- 16.2.8.1. Overview
- 16.2.8.2. Products
- 16.2.8.3. SWOT Analysis
- 16.2.8.4. Recent Developments
- 16.2.8.5. Financials (Based on Availability)
- 16.2.9 MAN Diesel & Turbo SE
- 16.2.9.1. Overview
- 16.2.9.2. Products
- 16.2.9.3. SWOT Analysis
- 16.2.9.4. Recent Developments
- 16.2.9.5. Financials (Based on Availability)
- 16.2.10 Seimens Energy AG
- 16.2.10.1. Overview
- 16.2.10.2. Products
- 16.2.10.3. SWOT Analysis
- 16.2.10.4. Recent Developments
- 16.2.10.5. Financials (Based on Availability)
- 16.2.11 General Electric Company
- 16.2.11.1. Overview
- 16.2.11.2. Products
- 16.2.11.3. SWOT Analysis
- 16.2.11.4. Recent Developments
- 16.2.11.5. Financials (Based on Availability)
- 16.2.12 Kawasaki Heavy Industries Ltd
- 16.2.12.1. Overview
- 16.2.12.2. Products
- 16.2.12.3. SWOT Analysis
- 16.2.12.4. Recent Developments
- 16.2.12.5. Financials (Based on Availability)
- 16.2.13 Viessmann Werke Group GmbH & Co KG
- 16.2.13.1. Overview
- 16.2.13.2. Products
- 16.2.13.3. SWOT Analysis
- 16.2.13.4. Recent Developments
- 16.2.13.5. Financials (Based on Availability)
- 16.2.1 ABB Ltd
List of Figures
- Figure 1: Global Combined Heat and Power Market Revenue Breakdown (Million, %) by Region 2024 & 2032
- Figure 2: Global Combined Heat and Power Market Volume Breakdown (Gigawatt, %) by Region 2024 & 2032
- Figure 3: North America Combined Heat and Power Market Revenue (Million), by Country 2024 & 2032
- Figure 4: North America Combined Heat and Power Market Volume (Gigawatt), by Country 2024 & 2032
- Figure 5: North America Combined Heat and Power Market Revenue Share (%), by Country 2024 & 2032
- Figure 6: North America Combined Heat and Power Market Volume Share (%), by Country 2024 & 2032
- Figure 7: Europe Combined Heat and Power Market Revenue (Million), by Country 2024 & 2032
- Figure 8: Europe Combined Heat and Power Market Volume (Gigawatt), by Country 2024 & 2032
- Figure 9: Europe Combined Heat and Power Market Revenue Share (%), by Country 2024 & 2032
- Figure 10: Europe Combined Heat and Power Market Volume Share (%), by Country 2024 & 2032
- Figure 11: Asia Pacific Combined Heat and Power Market Revenue (Million), by Country 2024 & 2032
- Figure 12: Asia Pacific Combined Heat and Power Market Volume (Gigawatt), by Country 2024 & 2032
- Figure 13: Asia Pacific Combined Heat and Power Market Revenue Share (%), by Country 2024 & 2032
- Figure 14: Asia Pacific Combined Heat and Power Market Volume Share (%), by Country 2024 & 2032
- Figure 15: South America Combined Heat and Power Market Revenue (Million), by Country 2024 & 2032
- Figure 16: South America Combined Heat and Power Market Volume (Gigawatt), by Country 2024 & 2032
- Figure 17: South America Combined Heat and Power Market Revenue Share (%), by Country 2024 & 2032
- Figure 18: South America Combined Heat and Power Market Volume Share (%), by Country 2024 & 2032
- Figure 19: MEA Combined Heat and Power Market Revenue (Million), by Country 2024 & 2032
- Figure 20: MEA Combined Heat and Power Market Volume (Gigawatt), by Country 2024 & 2032
- Figure 21: MEA Combined Heat and Power Market Revenue Share (%), by Country 2024 & 2032
- Figure 22: MEA Combined Heat and Power Market Volume Share (%), by Country 2024 & 2032
- Figure 23: North America Combined Heat and Power Market Revenue (Million), by End-user Sector 2024 & 2032
- Figure 24: North America Combined Heat and Power Market Volume (Gigawatt), by End-user Sector 2024 & 2032
- Figure 25: North America Combined Heat and Power Market Revenue Share (%), by End-user Sector 2024 & 2032
- Figure 26: North America Combined Heat and Power Market Volume Share (%), by End-user Sector 2024 & 2032
- Figure 27: North America Combined Heat and Power Market Revenue (Million), by Type 2024 & 2032
- Figure 28: North America Combined Heat and Power Market Volume (Gigawatt), by Type 2024 & 2032
- Figure 29: North America Combined Heat and Power Market Revenue Share (%), by Type 2024 & 2032
- Figure 30: North America Combined Heat and Power Market Volume Share (%), by Type 2024 & 2032
- Figure 31: North America Combined Heat and Power Market Revenue (Million), by Fuel Type 2024 & 2032
- Figure 32: North America Combined Heat and Power Market Volume (Gigawatt), by Fuel Type 2024 & 2032
- Figure 33: North America Combined Heat and Power Market Revenue Share (%), by Fuel Type 2024 & 2032
- Figure 34: North America Combined Heat and Power Market Volume Share (%), by Fuel Type 2024 & 2032
- Figure 35: North America Combined Heat and Power Market Revenue (Million), by Country 2024 & 2032
- Figure 36: North America Combined Heat and Power Market Volume (Gigawatt), by Country 2024 & 2032
- Figure 37: North America Combined Heat and Power Market Revenue Share (%), by Country 2024 & 2032
- Figure 38: North America Combined Heat and Power Market Volume Share (%), by Country 2024 & 2032
- Figure 39: Europe Combined Heat and Power Market Revenue (Million), by End-user Sector 2024 & 2032
- Figure 40: Europe Combined Heat and Power Market Volume (Gigawatt), by End-user Sector 2024 & 2032
- Figure 41: Europe Combined Heat and Power Market Revenue Share (%), by End-user Sector 2024 & 2032
- Figure 42: Europe Combined Heat and Power Market Volume Share (%), by End-user Sector 2024 & 2032
- Figure 43: Europe Combined Heat and Power Market Revenue (Million), by Type 2024 & 2032
- Figure 44: Europe Combined Heat and Power Market Volume (Gigawatt), by Type 2024 & 2032
- Figure 45: Europe Combined Heat and Power Market Revenue Share (%), by Type 2024 & 2032
- Figure 46: Europe Combined Heat and Power Market Volume Share (%), by Type 2024 & 2032
- Figure 47: Europe Combined Heat and Power Market Revenue (Million), by Fuel Type 2024 & 2032
- Figure 48: Europe Combined Heat and Power Market Volume (Gigawatt), by Fuel Type 2024 & 2032
- Figure 49: Europe Combined Heat and Power Market Revenue Share (%), by Fuel Type 2024 & 2032
- Figure 50: Europe Combined Heat and Power Market Volume Share (%), by Fuel Type 2024 & 2032
- Figure 51: Europe Combined Heat and Power Market Revenue (Million), by Country 2024 & 2032
- Figure 52: Europe Combined Heat and Power Market Volume (Gigawatt), by Country 2024 & 2032
- Figure 53: Europe Combined Heat and Power Market Revenue Share (%), by Country 2024 & 2032
- Figure 54: Europe Combined Heat and Power Market Volume Share (%), by Country 2024 & 2032
- Figure 55: Asia Pacific Combined Heat and Power Market Revenue (Million), by End-user Sector 2024 & 2032
- Figure 56: Asia Pacific Combined Heat and Power Market Volume (Gigawatt), by End-user Sector 2024 & 2032
- Figure 57: Asia Pacific Combined Heat and Power Market Revenue Share (%), by End-user Sector 2024 & 2032
- Figure 58: Asia Pacific Combined Heat and Power Market Volume Share (%), by End-user Sector 2024 & 2032
- Figure 59: Asia Pacific Combined Heat and Power Market Revenue (Million), by Type 2024 & 2032
- Figure 60: Asia Pacific Combined Heat and Power Market Volume (Gigawatt), by Type 2024 & 2032
- Figure 61: Asia Pacific Combined Heat and Power Market Revenue Share (%), by Type 2024 & 2032
- Figure 62: Asia Pacific Combined Heat and Power Market Volume Share (%), by Type 2024 & 2032
- Figure 63: Asia Pacific Combined Heat and Power Market Revenue (Million), by Fuel Type 2024 & 2032
- Figure 64: Asia Pacific Combined Heat and Power Market Volume (Gigawatt), by Fuel Type 2024 & 2032
- Figure 65: Asia Pacific Combined Heat and Power Market Revenue Share (%), by Fuel Type 2024 & 2032
- Figure 66: Asia Pacific Combined Heat and Power Market Volume Share (%), by Fuel Type 2024 & 2032
- Figure 67: Asia Pacific Combined Heat and Power Market Revenue (Million), by Country 2024 & 2032
- Figure 68: Asia Pacific Combined Heat and Power Market Volume (Gigawatt), by Country 2024 & 2032
- Figure 69: Asia Pacific Combined Heat and Power Market Revenue Share (%), by Country 2024 & 2032
- Figure 70: Asia Pacific Combined Heat and Power Market Volume Share (%), by Country 2024 & 2032
- Figure 71: South America Combined Heat and Power Market Revenue (Million), by End-user Sector 2024 & 2032
- Figure 72: South America Combined Heat and Power Market Volume (Gigawatt), by End-user Sector 2024 & 2032
- Figure 73: South America Combined Heat and Power Market Revenue Share (%), by End-user Sector 2024 & 2032
- Figure 74: South America Combined Heat and Power Market Volume Share (%), by End-user Sector 2024 & 2032
- Figure 75: South America Combined Heat and Power Market Revenue (Million), by Type 2024 & 2032
- Figure 76: South America Combined Heat and Power Market Volume (Gigawatt), by Type 2024 & 2032
- Figure 77: South America Combined Heat and Power Market Revenue Share (%), by Type 2024 & 2032
- Figure 78: South America Combined Heat and Power Market Volume Share (%), by Type 2024 & 2032
- Figure 79: South America Combined Heat and Power Market Revenue (Million), by Fuel Type 2024 & 2032
- Figure 80: South America Combined Heat and Power Market Volume (Gigawatt), by Fuel Type 2024 & 2032
- Figure 81: South America Combined Heat and Power Market Revenue Share (%), by Fuel Type 2024 & 2032
- Figure 82: South America Combined Heat and Power Market Volume Share (%), by Fuel Type 2024 & 2032
- Figure 83: South America Combined Heat and Power Market Revenue (Million), by Country 2024 & 2032
- Figure 84: South America Combined Heat and Power Market Volume (Gigawatt), by Country 2024 & 2032
- Figure 85: South America Combined Heat and Power Market Revenue Share (%), by Country 2024 & 2032
- Figure 86: South America Combined Heat and Power Market Volume Share (%), by Country 2024 & 2032
- Figure 87: Middle East and Africa Combined Heat and Power Market Revenue (Million), by End-user Sector 2024 & 2032
- Figure 88: Middle East and Africa Combined Heat and Power Market Volume (Gigawatt), by End-user Sector 2024 & 2032
- Figure 89: Middle East and Africa Combined Heat and Power Market Revenue Share (%), by End-user Sector 2024 & 2032
- Figure 90: Middle East and Africa Combined Heat and Power Market Volume Share (%), by End-user Sector 2024 & 2032
- Figure 91: Middle East and Africa Combined Heat and Power Market Revenue (Million), by Type 2024 & 2032
- Figure 92: Middle East and Africa Combined Heat and Power Market Volume (Gigawatt), by Type 2024 & 2032
- Figure 93: Middle East and Africa Combined Heat and Power Market Revenue Share (%), by Type 2024 & 2032
- Figure 94: Middle East and Africa Combined Heat and Power Market Volume Share (%), by Type 2024 & 2032
- Figure 95: Middle East and Africa Combined Heat and Power Market Revenue (Million), by Fuel Type 2024 & 2032
- Figure 96: Middle East and Africa Combined Heat and Power Market Volume (Gigawatt), by Fuel Type 2024 & 2032
- Figure 97: Middle East and Africa Combined Heat and Power Market Revenue Share (%), by Fuel Type 2024 & 2032
- Figure 98: Middle East and Africa Combined Heat and Power Market Volume Share (%), by Fuel Type 2024 & 2032
- Figure 99: Middle East and Africa Combined Heat and Power Market Revenue (Million), by Country 2024 & 2032
- Figure 100: Middle East and Africa Combined Heat and Power Market Volume (Gigawatt), by Country 2024 & 2032
- Figure 101: Middle East and Africa Combined Heat and Power Market Revenue Share (%), by Country 2024 & 2032
- Figure 102: Middle East and Africa Combined Heat and Power Market Volume Share (%), by Country 2024 & 2032
List of Tables
- Table 1: Global Combined Heat and Power Market Revenue Million Forecast, by Region 2019 & 2032
- Table 2: Global Combined Heat and Power Market Volume Gigawatt Forecast, by Region 2019 & 2032
- Table 3: Global Combined Heat and Power Market Revenue Million Forecast, by End-user Sector 2019 & 2032
- Table 4: Global Combined Heat and Power Market Volume Gigawatt Forecast, by End-user Sector 2019 & 2032
- Table 5: Global Combined Heat and Power Market Revenue Million Forecast, by Type 2019 & 2032
- Table 6: Global Combined Heat and Power Market Volume Gigawatt Forecast, by Type 2019 & 2032
- Table 7: Global Combined Heat and Power Market Revenue Million Forecast, by Fuel Type 2019 & 2032
- Table 8: Global Combined Heat and Power Market Volume Gigawatt Forecast, by Fuel Type 2019 & 2032
- Table 9: Global Combined Heat and Power Market Revenue Million Forecast, by Region 2019 & 2032
- Table 10: Global Combined Heat and Power Market Volume Gigawatt Forecast, by Region 2019 & 2032
- Table 11: Global Combined Heat and Power Market Revenue Million Forecast, by Country 2019 & 2032
- Table 12: Global Combined Heat and Power Market Volume Gigawatt Forecast, by Country 2019 & 2032
- Table 13: United States Combined Heat and Power Market Revenue (Million) Forecast, by Application 2019 & 2032
- Table 14: United States Combined Heat and Power Market Volume (Gigawatt) Forecast, by Application 2019 & 2032
- Table 15: Canada Combined Heat and Power Market Revenue (Million) Forecast, by Application 2019 & 2032
- Table 16: Canada Combined Heat and Power Market Volume (Gigawatt) Forecast, by Application 2019 & 2032
- Table 17: Mexico Combined Heat and Power Market Revenue (Million) Forecast, by Application 2019 & 2032
- Table 18: Mexico Combined Heat and Power Market Volume (Gigawatt) Forecast, by Application 2019 & 2032
- Table 19: Global Combined Heat and Power Market Revenue Million Forecast, by Country 2019 & 2032
- Table 20: Global Combined Heat and Power Market Volume Gigawatt Forecast, by Country 2019 & 2032
- Table 21: Germany Combined Heat and Power Market Revenue (Million) Forecast, by Application 2019 & 2032
- Table 22: Germany Combined Heat and Power Market Volume (Gigawatt) Forecast, by Application 2019 & 2032
- Table 23: United Kingdom Combined Heat and Power Market Revenue (Million) Forecast, by Application 2019 & 2032
- Table 24: United Kingdom Combined Heat and Power Market Volume (Gigawatt) Forecast, by Application 2019 & 2032
- Table 25: France Combined Heat and Power Market Revenue (Million) Forecast, by Application 2019 & 2032
- Table 26: France Combined Heat and Power Market Volume (Gigawatt) Forecast, by Application 2019 & 2032
- Table 27: Spain Combined Heat and Power Market Revenue (Million) Forecast, by Application 2019 & 2032
- Table 28: Spain Combined Heat and Power Market Volume (Gigawatt) Forecast, by Application 2019 & 2032
- Table 29: Italy Combined Heat and Power Market Revenue (Million) Forecast, by Application 2019 & 2032
- Table 30: Italy Combined Heat and Power Market Volume (Gigawatt) Forecast, by Application 2019 & 2032
- Table 31: Spain Combined Heat and Power Market Revenue (Million) Forecast, by Application 2019 & 2032
- Table 32: Spain Combined Heat and Power Market Volume (Gigawatt) Forecast, by Application 2019 & 2032
- Table 33: Belgium Combined Heat and Power Market Revenue (Million) Forecast, by Application 2019 & 2032
- Table 34: Belgium Combined Heat and Power Market Volume (Gigawatt) Forecast, by Application 2019 & 2032
- Table 35: Netherland Combined Heat and Power Market Revenue (Million) Forecast, by Application 2019 & 2032
- Table 36: Netherland Combined Heat and Power Market Volume (Gigawatt) Forecast, by Application 2019 & 2032
- Table 37: Nordics Combined Heat and Power Market Revenue (Million) Forecast, by Application 2019 & 2032
- Table 38: Nordics Combined Heat and Power Market Volume (Gigawatt) Forecast, by Application 2019 & 2032
- Table 39: Rest of Europe Combined Heat and Power Market Revenue (Million) Forecast, by Application 2019 & 2032
- Table 40: Rest of Europe Combined Heat and Power Market Volume (Gigawatt) Forecast, by Application 2019 & 2032
- Table 41: Global Combined Heat and Power Market Revenue Million Forecast, by Country 2019 & 2032
- Table 42: Global Combined Heat and Power Market Volume Gigawatt Forecast, by Country 2019 & 2032
- Table 43: China Combined Heat and Power Market Revenue (Million) Forecast, by Application 2019 & 2032
- Table 44: China Combined Heat and Power Market Volume (Gigawatt) Forecast, by Application 2019 & 2032
- Table 45: Japan Combined Heat and Power Market Revenue (Million) Forecast, by Application 2019 & 2032
- Table 46: Japan Combined Heat and Power Market Volume (Gigawatt) Forecast, by Application 2019 & 2032
- Table 47: India Combined Heat and Power Market Revenue (Million) Forecast, by Application 2019 & 2032
- Table 48: India Combined Heat and Power Market Volume (Gigawatt) Forecast, by Application 2019 & 2032
- Table 49: South Korea Combined Heat and Power Market Revenue (Million) Forecast, by Application 2019 & 2032
- Table 50: South Korea Combined Heat and Power Market Volume (Gigawatt) Forecast, by Application 2019 & 2032
- Table 51: Southeast Asia Combined Heat and Power Market Revenue (Million) Forecast, by Application 2019 & 2032
- Table 52: Southeast Asia Combined Heat and Power Market Volume (Gigawatt) Forecast, by Application 2019 & 2032
- Table 53: Australia Combined Heat and Power Market Revenue (Million) Forecast, by Application 2019 & 2032
- Table 54: Australia Combined Heat and Power Market Volume (Gigawatt) Forecast, by Application 2019 & 2032
- Table 55: Indonesia Combined Heat and Power Market Revenue (Million) Forecast, by Application 2019 & 2032
- Table 56: Indonesia Combined Heat and Power Market Volume (Gigawatt) Forecast, by Application 2019 & 2032
- Table 57: Phillipes Combined Heat and Power Market Revenue (Million) Forecast, by Application 2019 & 2032
- Table 58: Phillipes Combined Heat and Power Market Volume (Gigawatt) Forecast, by Application 2019 & 2032
- Table 59: Singapore Combined Heat and Power Market Revenue (Million) Forecast, by Application 2019 & 2032
- Table 60: Singapore Combined Heat and Power Market Volume (Gigawatt) Forecast, by Application 2019 & 2032
- Table 61: Thailandc Combined Heat and Power Market Revenue (Million) Forecast, by Application 2019 & 2032
- Table 62: Thailandc Combined Heat and Power Market Volume (Gigawatt) Forecast, by Application 2019 & 2032
- Table 63: Rest of Asia Pacific Combined Heat and Power Market Revenue (Million) Forecast, by Application 2019 & 2032
- Table 64: Rest of Asia Pacific Combined Heat and Power Market Volume (Gigawatt) Forecast, by Application 2019 & 2032
- Table 65: Global Combined Heat and Power Market Revenue Million Forecast, by Country 2019 & 2032
- Table 66: Global Combined Heat and Power Market Volume Gigawatt Forecast, by Country 2019 & 2032
- Table 67: Brazil Combined Heat and Power Market Revenue (Million) Forecast, by Application 2019 & 2032
- Table 68: Brazil Combined Heat and Power Market Volume (Gigawatt) Forecast, by Application 2019 & 2032
- Table 69: Argentina Combined Heat and Power Market Revenue (Million) Forecast, by Application 2019 & 2032
- Table 70: Argentina Combined Heat and Power Market Volume (Gigawatt) Forecast, by Application 2019 & 2032
- Table 71: Peru Combined Heat and Power Market Revenue (Million) Forecast, by Application 2019 & 2032
- Table 72: Peru Combined Heat and Power Market Volume (Gigawatt) Forecast, by Application 2019 & 2032
- Table 73: Chile Combined Heat and Power Market Revenue (Million) Forecast, by Application 2019 & 2032
- Table 74: Chile Combined Heat and Power Market Volume (Gigawatt) Forecast, by Application 2019 & 2032
- Table 75: Colombia Combined Heat and Power Market Revenue (Million) Forecast, by Application 2019 & 2032
- Table 76: Colombia Combined Heat and Power Market Volume (Gigawatt) Forecast, by Application 2019 & 2032
- Table 77: Ecuador Combined Heat and Power Market Revenue (Million) Forecast, by Application 2019 & 2032
- Table 78: Ecuador Combined Heat and Power Market Volume (Gigawatt) Forecast, by Application 2019 & 2032
- Table 79: Venezuela Combined Heat and Power Market Revenue (Million) Forecast, by Application 2019 & 2032
- Table 80: Venezuela Combined Heat and Power Market Volume (Gigawatt) Forecast, by Application 2019 & 2032
- Table 81: Rest of South America Combined Heat and Power Market Revenue (Million) Forecast, by Application 2019 & 2032
- Table 82: Rest of South America Combined Heat and Power Market Volume (Gigawatt) Forecast, by Application 2019 & 2032
- Table 83: Global Combined Heat and Power Market Revenue Million Forecast, by Country 2019 & 2032
- Table 84: Global Combined Heat and Power Market Volume Gigawatt Forecast, by Country 2019 & 2032
- Table 85: United Arab Emirates Combined Heat and Power Market Revenue (Million) Forecast, by Application 2019 & 2032
- Table 86: United Arab Emirates Combined Heat and Power Market Volume (Gigawatt) Forecast, by Application 2019 & 2032
- Table 87: Saudi Arabia Combined Heat and Power Market Revenue (Million) Forecast, by Application 2019 & 2032
- Table 88: Saudi Arabia Combined Heat and Power Market Volume (Gigawatt) Forecast, by Application 2019 & 2032
- Table 89: South Africa Combined Heat and Power Market Revenue (Million) Forecast, by Application 2019 & 2032
- Table 90: South Africa Combined Heat and Power Market Volume (Gigawatt) Forecast, by Application 2019 & 2032
- Table 91: Rest of Middle East and Africa Combined Heat and Power Market Revenue (Million) Forecast, by Application 2019 & 2032
- Table 92: Rest of Middle East and Africa Combined Heat and Power Market Volume (Gigawatt) Forecast, by Application 2019 & 2032
- Table 93: Global Combined Heat and Power Market Revenue Million Forecast, by End-user Sector 2019 & 2032
- Table 94: Global Combined Heat and Power Market Volume Gigawatt Forecast, by End-user Sector 2019 & 2032
- Table 95: Global Combined Heat and Power Market Revenue Million Forecast, by Type 2019 & 2032
- Table 96: Global Combined Heat and Power Market Volume Gigawatt Forecast, by Type 2019 & 2032
- Table 97: Global Combined Heat and Power Market Revenue Million Forecast, by Fuel Type 2019 & 2032
- Table 98: Global Combined Heat and Power Market Volume Gigawatt Forecast, by Fuel Type 2019 & 2032
- Table 99: Global Combined Heat and Power Market Revenue Million Forecast, by Country 2019 & 2032
- Table 100: Global Combined Heat and Power Market Volume Gigawatt Forecast, by Country 2019 & 2032
- Table 101: Global Combined Heat and Power Market Revenue Million Forecast, by End-user Sector 2019 & 2032
- Table 102: Global Combined Heat and Power Market Volume Gigawatt Forecast, by End-user Sector 2019 & 2032
- Table 103: Global Combined Heat and Power Market Revenue Million Forecast, by Type 2019 & 2032
- Table 104: Global Combined Heat and Power Market Volume Gigawatt Forecast, by Type 2019 & 2032
- Table 105: Global Combined Heat and Power Market Revenue Million Forecast, by Fuel Type 2019 & 2032
- Table 106: Global Combined Heat and Power Market Volume Gigawatt Forecast, by Fuel Type 2019 & 2032
- Table 107: Global Combined Heat and Power Market Revenue Million Forecast, by Country 2019 & 2032
- Table 108: Global Combined Heat and Power Market Volume Gigawatt Forecast, by Country 2019 & 2032
- Table 109: Global Combined Heat and Power Market Revenue Million Forecast, by End-user Sector 2019 & 2032
- Table 110: Global Combined Heat and Power Market Volume Gigawatt Forecast, by End-user Sector 2019 & 2032
- Table 111: Global Combined Heat and Power Market Revenue Million Forecast, by Type 2019 & 2032
- Table 112: Global Combined Heat and Power Market Volume Gigawatt Forecast, by Type 2019 & 2032
- Table 113: Global Combined Heat and Power Market Revenue Million Forecast, by Fuel Type 2019 & 2032
- Table 114: Global Combined Heat and Power Market Volume Gigawatt Forecast, by Fuel Type 2019 & 2032
- Table 115: Global Combined Heat and Power Market Revenue Million Forecast, by Country 2019 & 2032
- Table 116: Global Combined Heat and Power Market Volume Gigawatt Forecast, by Country 2019 & 2032
- Table 117: Global Combined Heat and Power Market Revenue Million Forecast, by End-user Sector 2019 & 2032
- Table 118: Global Combined Heat and Power Market Volume Gigawatt Forecast, by End-user Sector 2019 & 2032
- Table 119: Global Combined Heat and Power Market Revenue Million Forecast, by Type 2019 & 2032
- Table 120: Global Combined Heat and Power Market Volume Gigawatt Forecast, by Type 2019 & 2032
- Table 121: Global Combined Heat and Power Market Revenue Million Forecast, by Fuel Type 2019 & 2032
- Table 122: Global Combined Heat and Power Market Volume Gigawatt Forecast, by Fuel Type 2019 & 2032
- Table 123: Global Combined Heat and Power Market Revenue Million Forecast, by Country 2019 & 2032
- Table 124: Global Combined Heat and Power Market Volume Gigawatt Forecast, by Country 2019 & 2032
- Table 125: Global Combined Heat and Power Market Revenue Million Forecast, by End-user Sector 2019 & 2032
- Table 126: Global Combined Heat and Power Market Volume Gigawatt Forecast, by End-user Sector 2019 & 2032
- Table 127: Global Combined Heat and Power Market Revenue Million Forecast, by Type 2019 & 2032
- Table 128: Global Combined Heat and Power Market Volume Gigawatt Forecast, by Type 2019 & 2032
- Table 129: Global Combined Heat and Power Market Revenue Million Forecast, by Fuel Type 2019 & 2032
- Table 130: Global Combined Heat and Power Market Volume Gigawatt Forecast, by Fuel Type 2019 & 2032
- Table 131: Global Combined Heat and Power Market Revenue Million Forecast, by Country 2019 & 2032
- Table 132: Global Combined Heat and Power Market Volume Gigawatt Forecast, by Country 2019 & 2032
Frequently Asked Questions
1. What is the projected Compound Annual Growth Rate (CAGR) of the Combined Heat and Power Market?
The projected CAGR is approximately > 7.50%.
2. Which companies are prominent players in the Combined Heat and Power Market?
Key companies in the market include ABB Ltd, FuelCell Energy Inc, Aegis Energy Services LLC, Bosch Thermotechnology GmbH, Mitsubishi Electric Corporation, Caterpillar Inc, Centrica PLC, Wartsila Oyj Abp, MAN Diesel & Turbo SE, Seimens Energy AG, General Electric Company, Kawasaki Heavy Industries Ltd, Viessmann Werke Group GmbH & Co KG.
3. What are the main segments of the Combined Heat and Power Market?
The market segments include End-user Sector, Type, Fuel Type.
4. Can you provide details about the market size?
The market size is estimated to be USD XX Million as of 2022.
5. What are some drivers contributing to market growth?
4.; Declining Costs and Increasing Efficiencies of Solar PV Panels 4.; Supportive Government Policies Towards Solar.
6. What are the notable trends driving market growth?
Natural Gas-based Fuel Type to Witness a Significant Growth.
7. Are there any restraints impacting market growth?
4.; Increasing Adoption of Alternative Clean Energy Sources and Increasing Natural Gas Consumption.
8. Can you provide examples of recent developments in the market?
In November 2021, the European Commission approved Greece's EUR 2.27 billion state aid scheme to support power production from renewables, and high-energy efficiency combined heat and power plants. The scheme is open until 2025, while the aid can be paid out for a maximum of 20 years.
9. What pricing options are available for accessing the report?
Pricing options include single-user, multi-user, and enterprise licenses priced at USD 4750, USD 5250, and USD 8750 respectively.
10. Is the market size provided in terms of value or volume?
The market size is provided in terms of value, measured in Million and volume, measured in Gigawatt.
11. Are there any specific market keywords associated with the report?
Yes, the market keyword associated with the report is "Combined Heat and Power Market," which aids in identifying and referencing the specific market segment covered.
12. How do I determine which pricing option suits my needs best?
The pricing options vary based on user requirements and access needs. Individual users may opt for single-user licenses, while businesses requiring broader access may choose multi-user or enterprise licenses for cost-effective access to the report.
13. Are there any additional resources or data provided in the Combined Heat and Power Market report?
While the report offers comprehensive insights, it's advisable to review the specific contents or supplementary materials provided to ascertain if additional resources or data are available.
14. How can I stay updated on further developments or reports in the Combined Heat and Power Market?
To stay informed about further developments, trends, and reports in the Combined Heat and Power Market, consider subscribing to industry newsletters, following relevant companies and organizations, or regularly checking reputable industry news sources and publications.
Methodology
Step 1 - Identification of Relevant Samples Size from Population Database


Step 2 - Approaches for Defining Global Market Size (Value, Volume* & Price*)

Note*: In applicable scenarios
Step 3 - Data Sources
Primary Research
- Web Analytics
- Survey Reports
- Research Institute
- Latest Research Reports
- Opinion Leaders
Secondary Research
- Annual Reports
- White Paper
- Latest Press Release
- Industry Association
- Paid Database
- Investor Presentations

Step 4 - Data Triangulation
Involves using different sources of information in order to increase the validity of a study
These sources are likely to be stakeholders in a program - participants, other researchers, program staff, other community members, and so on.
Then we put all data in single framework & apply various statistical tools to find out the dynamic on the market.
During the analysis stage, feedback from the stakeholder groups would be compared to determine areas of agreement as well as areas of divergence
