

Key Insights
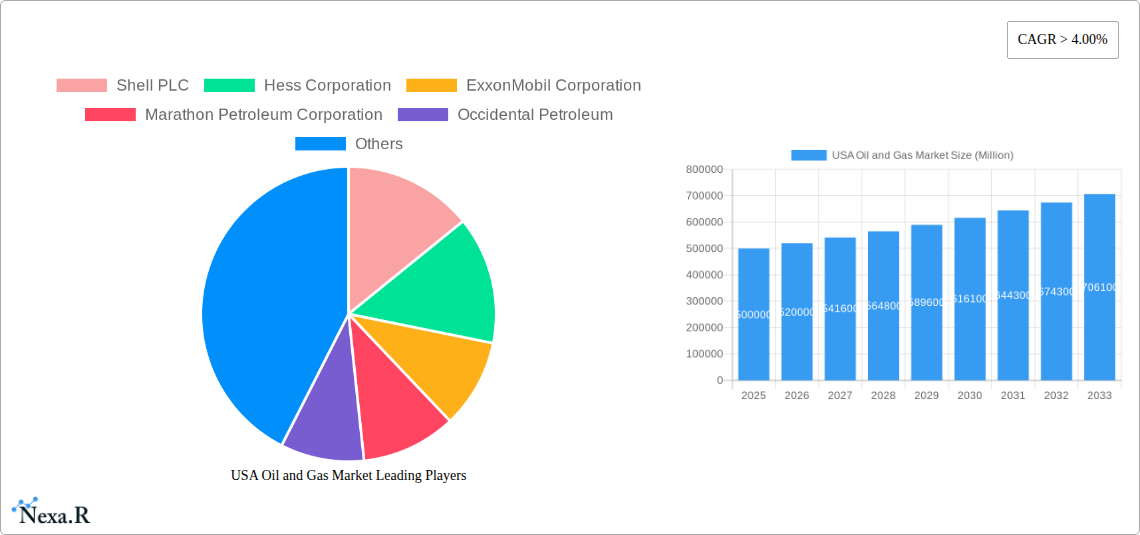
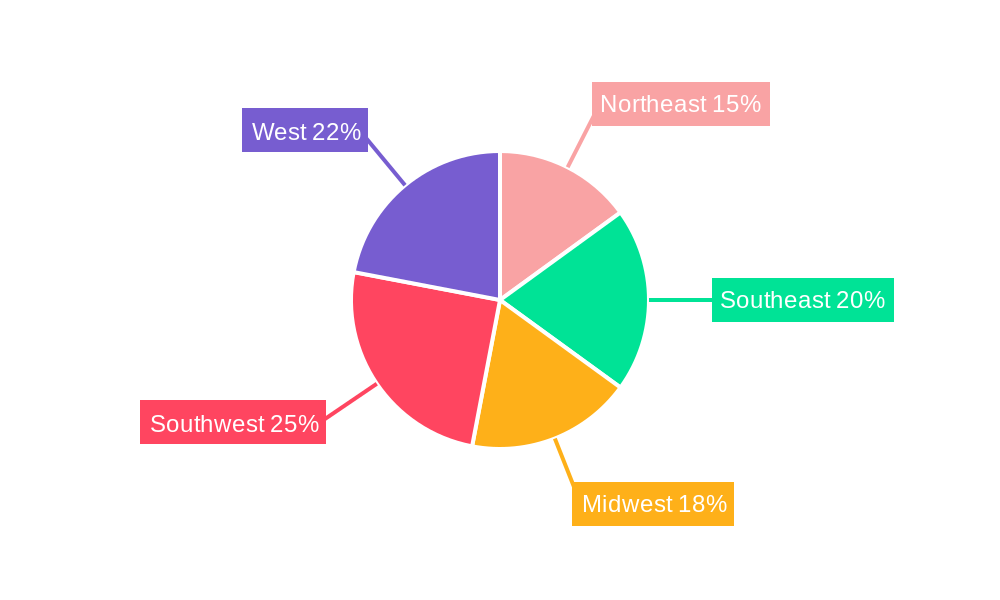
The US oil and gas market, valued at approximately $500 billion in 2025, is projected to experience robust growth, driven by increasing energy demand across residential, commercial, and industrial sectors, particularly in the transportation segment. The market's Compound Annual Growth Rate (CAGR) exceeding 4% through 2033 signifies consistent expansion. Key growth drivers include sustained economic activity, rising population, and the ongoing transition towards a more diversified energy mix, albeit with continued reliance on fossil fuels in the near to medium term. This growth is despite certain restraints, including fluctuating global oil prices, environmental regulations aimed at reducing carbon emissions, and the increasing adoption of renewable energy sources. The refined products segment is expected to witness significant growth due to the high demand from the transportation sector. Among regions, the Southwest and West, with significant oil and gas reserves, are likely to drive considerable market share, though growth will be observed across all regions due to varied energy consumption patterns. Major players like ExxonMobil, Chevron, and Shell are strategically positioning themselves to capitalize on this expanding market through investments in exploration, production, and refining capabilities.
The market segmentation reveals a complex interplay of factors. While the industrial sector continues to be a major consumer of natural gas and crude oil, the residential and commercial sectors also exhibit increasing demand, particularly for refined products like gasoline and heating oil. The transportation sector's reliance on petroleum products remains a significant factor, albeit potentially shifting towards alternative fuels in the long term. Competition within the industry is fierce, with established giants alongside smaller, more agile companies vying for market share. The forecast period (2025-2033) reflects a dynamic environment where technological advancements, geopolitical events, and evolving energy policies will influence market trajectory. Successful players will need to adapt to changing regulations, invest in technological innovation, and demonstrate environmental stewardship to maintain market dominance.
USA Oil and Gas Market: A Comprehensive Market Report (2019-2033)
This in-depth report provides a comprehensive analysis of the USA Oil and Gas Market, covering market dynamics, growth trends, dominant segments, key players, and future outlook. The study period spans from 2019 to 2033, with 2025 serving as the base and estimated year. The report utilizes extensive data and qualitative analysis to offer invaluable insights for industry professionals, investors, and strategic decision-makers. The report meticulously analyzes the parent market (Oil and Gas) and its child markets (Crude Oil, Natural Gas, Refined Products; Industrial, Commercial, Residential, Transportation end-use sectors). Market values are presented in millions of units.
USA Oil and Gas Market Market Dynamics & Structure
This section delves into the intricacies of the US oil and gas market structure, analyzing market concentration, technological advancements, regulatory landscapes, competitive dynamics, and mergers & acquisitions (M&A) activities. We examine the influence of these factors on market evolution and provide quantitative and qualitative data.
- Market Concentration: The US oil and gas market exhibits a moderately concentrated structure, with major players like ExxonMobil, Chevron, and ConocoPhillips holding significant market share. However, a number of smaller independent producers and regional players also contribute significantly. We estimate the combined market share of the top 5 players to be approximately xx%.
- Technological Innovation: Technological advancements in areas such as hydraulic fracturing ("fracking"), horizontal drilling, and enhanced oil recovery (EOR) have significantly impacted production levels and efficiency. However, challenges remain in areas like carbon capture and storage (CCS) technology adoption.
- Regulatory Framework: Stringent environmental regulations, particularly regarding emissions and waste disposal, significantly impact operational costs and investment decisions within the industry. Changes in federal and state-level policies continuously shape market dynamics.
- Competitive Product Substitutes: The rise of renewable energy sources like solar and wind power presents a growing competitive pressure on the traditional oil and gas industry. The transition towards sustainable energy sources is impacting investment patterns and long-term market projections.
- End-User Demographics: The transportation sector remains the largest consumer of refined petroleum products, followed by the industrial and commercial sectors. Residential consumption contributes significantly, driving fluctuations in demand based on seasonal and weather-related factors.
- M&A Trends: The past five years have witnessed a considerable number of M&A deals, averaging xx deals annually (2019-2024). These transactions primarily involve consolidation amongst smaller players and strategic acquisitions of assets with promising reserves.
USA Oil and Gas Market Growth Trends & Insights
This section leverages extensive data analysis to chart the evolution of market size, adoption rates, technological disruptions, and shifts in consumer behavior within the US oil and gas industry from 2019 to 2033.
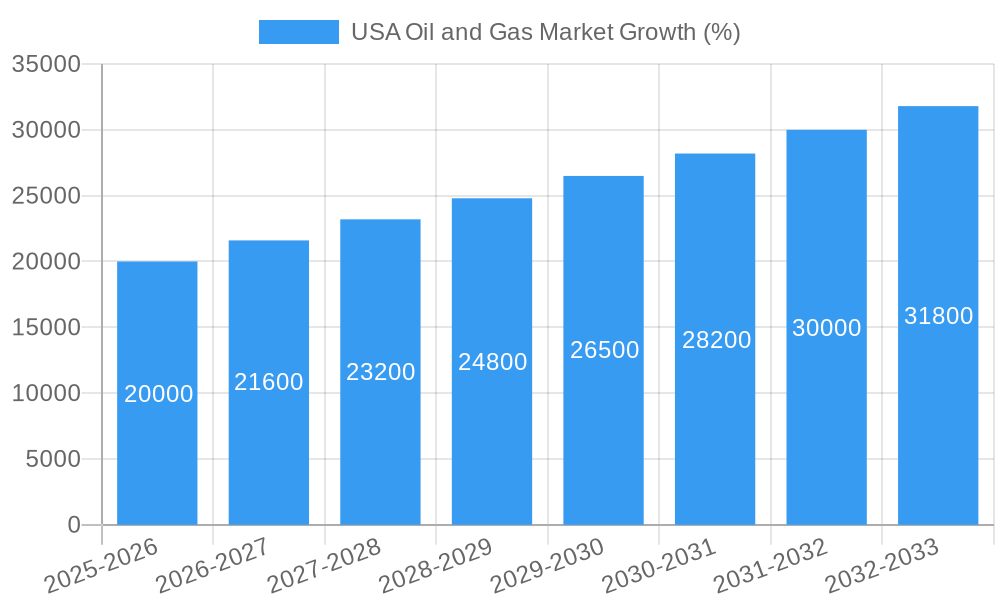
The US oil and gas market is expected to witness a Compound Annual Growth Rate (CAGR) of xx% during the forecast period (2025-2033), driven by several factors, including increasing global energy demand, robust domestic production, and ongoing technological advancements. Market penetration of shale gas production continues to grow, further influencing the market's overall development. Fluctuations in global energy prices and geopolitical events, however, will significantly impact market growth trajectories. We further analyse shifting consumer preferences towards cleaner energy, impacting demand for oil and gas in specific sectors. Market size is predicted to reach xx million units by 2033.
Dominant Regions, Countries, or Segments in USA Oil and Gas Market
The Permian Basin, located across Texas and New Mexico, stands as the most dominant region in the US oil and gas market, owing to its prolific shale formations and substantial production levels. The Gulf Coast region also plays a significant role, boasting extensive refining capacity and extensive offshore oil and gas exploration activities.
- Product Type: Crude oil accounts for the largest market share amongst the product types, driven by robust domestic production and global demand. Natural gas production also contributes significantly to the market value. Refined products, including gasoline, diesel, and jet fuel, are strongly linked to the transportation sector's demand.
- End-Use Sector: The transportation sector, particularly the automotive industry, represents the major end-use segment. The industrial sector uses oil and gas for numerous manufacturing processes and energy needs. Commercial and residential sectors contribute to the overall market size through heating, electricity generation, and other energy-related applications. Key drivers include economic growth, industrialization, and population growth.
USA Oil and Gas Market Product Landscape
The US oil and gas market showcases a diverse product landscape, encompassing various types of crude oil, natural gas, and refined petroleum products. Continuous innovations focus on enhancing extraction techniques, improving refining processes, and developing cleaner fuels. Key advancements include advancements in EOR techniques boosting production from mature fields and the exploration of renewable natural gas (RNG) to meet sustainability demands. These advancements drive market growth and enhance the overall competitiveness of the sector.
Key Drivers, Barriers & Challenges in USA Oil and Gas Market
Key Drivers: The growth of the US oil and gas market is propelled by sustained global demand for energy, technological advancements in extraction techniques (e.g., fracking), and favorable government policies encouraging domestic production.
Challenges & Restraints: Environmental regulations, fluctuating energy prices, and geopolitical risks represent significant challenges. Supply chain disruptions, particularly during periods of global instability, pose further challenges to market growth. Competition from renewable energy sources and concerns about climate change add to the complexities facing the industry. The impact of these challenges could result in a reduction in investment and a potential slowdown in market growth. The extent of the impact remains to be seen.
Emerging Opportunities in USA Oil and Gas Market
Emerging opportunities lie in the development and adoption of cleaner energy technologies, including carbon capture and storage (CCS) and the exploration of RNG. Growing demand for petrochemicals used in various industries presents significant potential. Strategic partnerships with renewable energy companies can generate new revenue streams and enhance sustainability initiatives.
Growth Accelerators in the USA Oil and Gas Market Industry
Long-term growth in the US oil and gas market will be driven by technological breakthroughs in production and refining, leading to enhanced efficiency and lower costs. Strategic collaborations and mergers and acquisitions between companies to expand their market reach and consolidate resources will accelerate market expansion.
Key Players Shaping the USA Oil and Gas Market Market
- Shell PLC
- Hess Corporation
- ExxonMobil Corporation
- Marathon Petroleum Corporation
- Occidental Petroleum
- Chevron Corporation
- ConocoPhillips Company
- Valero Energy
- EOG Resources
- Total Energies SE
- Phillips
- BP PLC
Notable Milestones in USA Oil and Gas Market Sector
- January 2022: The Department of Energy announced the release of 13.4 million barrels of oil from the Strategic Petroleum Reserve to combat rising gasoline prices.
- March 2022: The US agreed to a landmark energy supply deal with the European Union to increase transatlantic gas deliveries, reducing reliance on Russia. This deal significantly impacted market dynamics, bolstering US gas exports and reinforcing the nation's role as a key energy supplier.
In-Depth USA Oil and Gas Market Market Outlook
The US oil and gas market is poised for continued growth, driven by technological innovation, strategic partnerships, and an ongoing focus on enhancing operational efficiency and sustainability. The market's future potential is linked to the successful integration of renewable energy sources, resulting in a more diversified energy mix. Strategic investment in infrastructure development and exploration activities will play a crucial role in shaping the market's trajectory in the coming years. Further analysis of global events will continue to refine predictions and provide greater insight into market shifts.
USA Oil and Gas Market Segmentation
- 1. Upstream
- 2. Midstream
- 3. Downstream
USA Oil and Gas Market Segmentation By Geography
-
1. North America
- 1.1. United States
- 1.2. Canada
- 1.3. Mexico
-
2. South America
- 2.1. Brazil
- 2.2. Argentina
- 2.3. Rest of South America
-
3. Europe
- 3.1. United Kingdom
- 3.2. Germany
- 3.3. France
- 3.4. Italy
- 3.5. Spain
- 3.6. Russia
- 3.7. Benelux
- 3.8. Nordics
- 3.9. Rest of Europe
-
4. Middle East & Africa
- 4.1. Turkey
- 4.2. Israel
- 4.3. GCC
- 4.4. North Africa
- 4.5. South Africa
- 4.6. Rest of Middle East & Africa
-
5. Asia Pacific
- 5.1. China
- 5.2. India
- 5.3. Japan
- 5.4. South Korea
- 5.5. ASEAN
- 5.6. Oceania
- 5.7. Rest of Asia Pacific
USA Oil and Gas Market REPORT HIGHLIGHTS
| Aspects | Details |
|---|---|
| Study Period | 2019-2033 |
| Base Year | 2024 |
| Estimated Year | 2025 |
| Forecast Period | 2025-2033 |
| Historical Period | 2019-2024 |
| Growth Rate | CAGR of > 4.00% from 2019-2033 |
| Segmentation |
|
Table of Contents
- 1. Introduction
- 1.1. Research Scope
- 1.2. Market Segmentation
- 1.3. Research Methodology
- 1.4. Definitions and Assumptions
- 2. Executive Summary
- 2.1. Introduction
- 3. Market Dynamics
- 3.1. Introduction
- 3.2. Market Drivers
- 3.2.1. 4.; Modernization and Upgrades of Existing Military Aircraft Fleets4.; Increasing Defense Budgets
- 3.3. Market Restrains
- 3.3.1. 4.; Shift Toward Unmanned Aircraft
- 3.4. Market Trends
- 3.4.1. Upstream Sector Expected Witness Significant Growth
- 4. Market Factor Analysis
- 4.1. Porters Five Forces
- 4.2. Supply/Value Chain
- 4.3. PESTEL analysis
- 4.4. Market Entropy
- 4.5. Patent/Trademark Analysis
- 5. Global USA Oil and Gas Market Analysis, Insights and Forecast, 2019-2031
- 5.1. Market Analysis, Insights and Forecast - by Upstream
- 5.2. Market Analysis, Insights and Forecast - by Midstream
- 5.3. Market Analysis, Insights and Forecast - by Downstream
- 5.4. Market Analysis, Insights and Forecast - by Region
- 5.4.1. North America
- 5.4.2. South America
- 5.4.3. Europe
- 5.4.4. Middle East & Africa
- 5.4.5. Asia Pacific
- 5.1. Market Analysis, Insights and Forecast - by Upstream
- 6. North America USA Oil and Gas Market Analysis, Insights and Forecast, 2019-2031
- 6.1. Market Analysis, Insights and Forecast - by Upstream
- 6.2. Market Analysis, Insights and Forecast - by Midstream
- 6.3. Market Analysis, Insights and Forecast - by Downstream
- 6.1. Market Analysis, Insights and Forecast - by Upstream
- 7. South America USA Oil and Gas Market Analysis, Insights and Forecast, 2019-2031
- 7.1. Market Analysis, Insights and Forecast - by Upstream
- 7.2. Market Analysis, Insights and Forecast - by Midstream
- 7.3. Market Analysis, Insights and Forecast - by Downstream
- 7.1. Market Analysis, Insights and Forecast - by Upstream
- 8. Europe USA Oil and Gas Market Analysis, Insights and Forecast, 2019-2031
- 8.1. Market Analysis, Insights and Forecast - by Upstream
- 8.2. Market Analysis, Insights and Forecast - by Midstream
- 8.3. Market Analysis, Insights and Forecast - by Downstream
- 8.1. Market Analysis, Insights and Forecast - by Upstream
- 9. Middle East & Africa USA Oil and Gas Market Analysis, Insights and Forecast, 2019-2031
- 9.1. Market Analysis, Insights and Forecast - by Upstream
- 9.2. Market Analysis, Insights and Forecast - by Midstream
- 9.3. Market Analysis, Insights and Forecast - by Downstream
- 9.1. Market Analysis, Insights and Forecast - by Upstream
- 10. Asia Pacific USA Oil and Gas Market Analysis, Insights and Forecast, 2019-2031
- 10.1. Market Analysis, Insights and Forecast - by Upstream
- 10.2. Market Analysis, Insights and Forecast - by Midstream
- 10.3. Market Analysis, Insights and Forecast - by Downstream
- 10.1. Market Analysis, Insights and Forecast - by Upstream
- 11. Northeast USA Oil and Gas Market Analysis, Insights and Forecast, 2019-2031
- 12. Southeast USA Oil and Gas Market Analysis, Insights and Forecast, 2019-2031
- 13. Midwest USA Oil and Gas Market Analysis, Insights and Forecast, 2019-2031
- 14. Southwest USA Oil and Gas Market Analysis, Insights and Forecast, 2019-2031
- 15. West USA Oil and Gas Market Analysis, Insights and Forecast, 2019-2031
- 16. Competitive Analysis
- 16.1. Global Market Share Analysis 2024
- 16.2. Company Profiles
- 16.2.1 Shell PLC
- 16.2.1.1. Overview
- 16.2.1.2. Products
- 16.2.1.3. SWOT Analysis
- 16.2.1.4. Recent Developments
- 16.2.1.5. Financials (Based on Availability)
- 16.2.2 Hess Corporation
- 16.2.2.1. Overview
- 16.2.2.2. Products
- 16.2.2.3. SWOT Analysis
- 16.2.2.4. Recent Developments
- 16.2.2.5. Financials (Based on Availability)
- 16.2.3 ExxonMobil Corporation
- 16.2.3.1. Overview
- 16.2.3.2. Products
- 16.2.3.3. SWOT Analysis
- 16.2.3.4. Recent Developments
- 16.2.3.5. Financials (Based on Availability)
- 16.2.4 Marathon Petroleum Corporation
- 16.2.4.1. Overview
- 16.2.4.2. Products
- 16.2.4.3. SWOT Analysis
- 16.2.4.4. Recent Developments
- 16.2.4.5. Financials (Based on Availability)
- 16.2.5 Occidental Petroleum
- 16.2.5.1. Overview
- 16.2.5.2. Products
- 16.2.5.3. SWOT Analysis
- 16.2.5.4. Recent Developments
- 16.2.5.5. Financials (Based on Availability)
- 16.2.6 Chevron Corporation
- 16.2.6.1. Overview
- 16.2.6.2. Products
- 16.2.6.3. SWOT Analysis
- 16.2.6.4. Recent Developments
- 16.2.6.5. Financials (Based on Availability)
- 16.2.7 ConocoPhillips Company
- 16.2.7.1. Overview
- 16.2.7.2. Products
- 16.2.7.3. SWOT Analysis
- 16.2.7.4. Recent Developments
- 16.2.7.5. Financials (Based on Availability)
- 16.2.8 Valero Energy
- 16.2.8.1. Overview
- 16.2.8.2. Products
- 16.2.8.3. SWOT Analysis
- 16.2.8.4. Recent Developments
- 16.2.8.5. Financials (Based on Availability)
- 16.2.9 EOG Resources
- 16.2.9.1. Overview
- 16.2.9.2. Products
- 16.2.9.3. SWOT Analysis
- 16.2.9.4. Recent Developments
- 16.2.9.5. Financials (Based on Availability)
- 16.2.10 Total Energies SE
- 16.2.10.1. Overview
- 16.2.10.2. Products
- 16.2.10.3. SWOT Analysis
- 16.2.10.4. Recent Developments
- 16.2.10.5. Financials (Based on Availability)
- 16.2.11 Phillips
- 16.2.11.1. Overview
- 16.2.11.2. Products
- 16.2.11.3. SWOT Analysis
- 16.2.11.4. Recent Developments
- 16.2.11.5. Financials (Based on Availability)
- 16.2.12 BP PLC
- 16.2.12.1. Overview
- 16.2.12.2. Products
- 16.2.12.3. SWOT Analysis
- 16.2.12.4. Recent Developments
- 16.2.12.5. Financials (Based on Availability)
- 16.2.1 Shell PLC
List of Figures
- Figure 1: Global USA Oil and Gas Market Revenue Breakdown (Million, %) by Region 2024 & 2032
- Figure 2: Global USA Oil and Gas Market Volume Breakdown (Tonnes, %) by Region 2024 & 2032
- Figure 3: United states USA Oil and Gas Market Revenue (Million), by Country 2024 & 2032
- Figure 4: United states USA Oil and Gas Market Volume (Tonnes), by Country 2024 & 2032
- Figure 5: United states USA Oil and Gas Market Revenue Share (%), by Country 2024 & 2032
- Figure 6: United states USA Oil and Gas Market Volume Share (%), by Country 2024 & 2032
- Figure 7: North America USA Oil and Gas Market Revenue (Million), by Upstream 2024 & 2032
- Figure 8: North America USA Oil and Gas Market Volume (Tonnes), by Upstream 2024 & 2032
- Figure 9: North America USA Oil and Gas Market Revenue Share (%), by Upstream 2024 & 2032
- Figure 10: North America USA Oil and Gas Market Volume Share (%), by Upstream 2024 & 2032
- Figure 11: North America USA Oil and Gas Market Revenue (Million), by Midstream 2024 & 2032
- Figure 12: North America USA Oil and Gas Market Volume (Tonnes), by Midstream 2024 & 2032
- Figure 13: North America USA Oil and Gas Market Revenue Share (%), by Midstream 2024 & 2032
- Figure 14: North America USA Oil and Gas Market Volume Share (%), by Midstream 2024 & 2032
- Figure 15: North America USA Oil and Gas Market Revenue (Million), by Downstream 2024 & 2032
- Figure 16: North America USA Oil and Gas Market Volume (Tonnes), by Downstream 2024 & 2032
- Figure 17: North America USA Oil and Gas Market Revenue Share (%), by Downstream 2024 & 2032
- Figure 18: North America USA Oil and Gas Market Volume Share (%), by Downstream 2024 & 2032
- Figure 19: North America USA Oil and Gas Market Revenue (Million), by Country 2024 & 2032
- Figure 20: North America USA Oil and Gas Market Volume (Tonnes), by Country 2024 & 2032
- Figure 21: North America USA Oil and Gas Market Revenue Share (%), by Country 2024 & 2032
- Figure 22: North America USA Oil and Gas Market Volume Share (%), by Country 2024 & 2032
- Figure 23: South America USA Oil and Gas Market Revenue (Million), by Upstream 2024 & 2032
- Figure 24: South America USA Oil and Gas Market Volume (Tonnes), by Upstream 2024 & 2032
- Figure 25: South America USA Oil and Gas Market Revenue Share (%), by Upstream 2024 & 2032
- Figure 26: South America USA Oil and Gas Market Volume Share (%), by Upstream 2024 & 2032
- Figure 27: South America USA Oil and Gas Market Revenue (Million), by Midstream 2024 & 2032
- Figure 28: South America USA Oil and Gas Market Volume (Tonnes), by Midstream 2024 & 2032
- Figure 29: South America USA Oil and Gas Market Revenue Share (%), by Midstream 2024 & 2032
- Figure 30: South America USA Oil and Gas Market Volume Share (%), by Midstream 2024 & 2032
- Figure 31: South America USA Oil and Gas Market Revenue (Million), by Downstream 2024 & 2032
- Figure 32: South America USA Oil and Gas Market Volume (Tonnes), by Downstream 2024 & 2032
- Figure 33: South America USA Oil and Gas Market Revenue Share (%), by Downstream 2024 & 2032
- Figure 34: South America USA Oil and Gas Market Volume Share (%), by Downstream 2024 & 2032
- Figure 35: South America USA Oil and Gas Market Revenue (Million), by Country 2024 & 2032
- Figure 36: South America USA Oil and Gas Market Volume (Tonnes), by Country 2024 & 2032
- Figure 37: South America USA Oil and Gas Market Revenue Share (%), by Country 2024 & 2032
- Figure 38: South America USA Oil and Gas Market Volume Share (%), by Country 2024 & 2032
- Figure 39: Europe USA Oil and Gas Market Revenue (Million), by Upstream 2024 & 2032
- Figure 40: Europe USA Oil and Gas Market Volume (Tonnes), by Upstream 2024 & 2032
- Figure 41: Europe USA Oil and Gas Market Revenue Share (%), by Upstream 2024 & 2032
- Figure 42: Europe USA Oil and Gas Market Volume Share (%), by Upstream 2024 & 2032
- Figure 43: Europe USA Oil and Gas Market Revenue (Million), by Midstream 2024 & 2032
- Figure 44: Europe USA Oil and Gas Market Volume (Tonnes), by Midstream 2024 & 2032
- Figure 45: Europe USA Oil and Gas Market Revenue Share (%), by Midstream 2024 & 2032
- Figure 46: Europe USA Oil and Gas Market Volume Share (%), by Midstream 2024 & 2032
- Figure 47: Europe USA Oil and Gas Market Revenue (Million), by Downstream 2024 & 2032
- Figure 48: Europe USA Oil and Gas Market Volume (Tonnes), by Downstream 2024 & 2032
- Figure 49: Europe USA Oil and Gas Market Revenue Share (%), by Downstream 2024 & 2032
- Figure 50: Europe USA Oil and Gas Market Volume Share (%), by Downstream 2024 & 2032
- Figure 51: Europe USA Oil and Gas Market Revenue (Million), by Country 2024 & 2032
- Figure 52: Europe USA Oil and Gas Market Volume (Tonnes), by Country 2024 & 2032
- Figure 53: Europe USA Oil and Gas Market Revenue Share (%), by Country 2024 & 2032
- Figure 54: Europe USA Oil and Gas Market Volume Share (%), by Country 2024 & 2032
- Figure 55: Middle East & Africa USA Oil and Gas Market Revenue (Million), by Upstream 2024 & 2032
- Figure 56: Middle East & Africa USA Oil and Gas Market Volume (Tonnes), by Upstream 2024 & 2032
- Figure 57: Middle East & Africa USA Oil and Gas Market Revenue Share (%), by Upstream 2024 & 2032
- Figure 58: Middle East & Africa USA Oil and Gas Market Volume Share (%), by Upstream 2024 & 2032
- Figure 59: Middle East & Africa USA Oil and Gas Market Revenue (Million), by Midstream 2024 & 2032
- Figure 60: Middle East & Africa USA Oil and Gas Market Volume (Tonnes), by Midstream 2024 & 2032
- Figure 61: Middle East & Africa USA Oil and Gas Market Revenue Share (%), by Midstream 2024 & 2032
- Figure 62: Middle East & Africa USA Oil and Gas Market Volume Share (%), by Midstream 2024 & 2032
- Figure 63: Middle East & Africa USA Oil and Gas Market Revenue (Million), by Downstream 2024 & 2032
- Figure 64: Middle East & Africa USA Oil and Gas Market Volume (Tonnes), by Downstream 2024 & 2032
- Figure 65: Middle East & Africa USA Oil and Gas Market Revenue Share (%), by Downstream 2024 & 2032
- Figure 66: Middle East & Africa USA Oil and Gas Market Volume Share (%), by Downstream 2024 & 2032
- Figure 67: Middle East & Africa USA Oil and Gas Market Revenue (Million), by Country 2024 & 2032
- Figure 68: Middle East & Africa USA Oil and Gas Market Volume (Tonnes), by Country 2024 & 2032
- Figure 69: Middle East & Africa USA Oil and Gas Market Revenue Share (%), by Country 2024 & 2032
- Figure 70: Middle East & Africa USA Oil and Gas Market Volume Share (%), by Country 2024 & 2032
- Figure 71: Asia Pacific USA Oil and Gas Market Revenue (Million), by Upstream 2024 & 2032
- Figure 72: Asia Pacific USA Oil and Gas Market Volume (Tonnes), by Upstream 2024 & 2032
- Figure 73: Asia Pacific USA Oil and Gas Market Revenue Share (%), by Upstream 2024 & 2032
- Figure 74: Asia Pacific USA Oil and Gas Market Volume Share (%), by Upstream 2024 & 2032
- Figure 75: Asia Pacific USA Oil and Gas Market Revenue (Million), by Midstream 2024 & 2032
- Figure 76: Asia Pacific USA Oil and Gas Market Volume (Tonnes), by Midstream 2024 & 2032
- Figure 77: Asia Pacific USA Oil and Gas Market Revenue Share (%), by Midstream 2024 & 2032
- Figure 78: Asia Pacific USA Oil and Gas Market Volume Share (%), by Midstream 2024 & 2032
- Figure 79: Asia Pacific USA Oil and Gas Market Revenue (Million), by Downstream 2024 & 2032
- Figure 80: Asia Pacific USA Oil and Gas Market Volume (Tonnes), by Downstream 2024 & 2032
- Figure 81: Asia Pacific USA Oil and Gas Market Revenue Share (%), by Downstream 2024 & 2032
- Figure 82: Asia Pacific USA Oil and Gas Market Volume Share (%), by Downstream 2024 & 2032
- Figure 83: Asia Pacific USA Oil and Gas Market Revenue (Million), by Country 2024 & 2032
- Figure 84: Asia Pacific USA Oil and Gas Market Volume (Tonnes), by Country 2024 & 2032
- Figure 85: Asia Pacific USA Oil and Gas Market Revenue Share (%), by Country 2024 & 2032
- Figure 86: Asia Pacific USA Oil and Gas Market Volume Share (%), by Country 2024 & 2032
List of Tables
- Table 1: Global USA Oil and Gas Market Revenue Million Forecast, by Region 2019 & 2032
- Table 2: Global USA Oil and Gas Market Volume Tonnes Forecast, by Region 2019 & 2032
- Table 3: Global USA Oil and Gas Market Revenue Million Forecast, by Upstream 2019 & 2032
- Table 4: Global USA Oil and Gas Market Volume Tonnes Forecast, by Upstream 2019 & 2032
- Table 5: Global USA Oil and Gas Market Revenue Million Forecast, by Midstream 2019 & 2032
- Table 6: Global USA Oil and Gas Market Volume Tonnes Forecast, by Midstream 2019 & 2032
- Table 7: Global USA Oil and Gas Market Revenue Million Forecast, by Downstream 2019 & 2032
- Table 8: Global USA Oil and Gas Market Volume Tonnes Forecast, by Downstream 2019 & 2032
- Table 9: Global USA Oil and Gas Market Revenue Million Forecast, by Region 2019 & 2032
- Table 10: Global USA Oil and Gas Market Volume Tonnes Forecast, by Region 2019 & 2032
- Table 11: Global USA Oil and Gas Market Revenue Million Forecast, by Country 2019 & 2032
- Table 12: Global USA Oil and Gas Market Volume Tonnes Forecast, by Country 2019 & 2032
- Table 13: Northeast USA Oil and Gas Market Revenue (Million) Forecast, by Application 2019 & 2032
- Table 14: Northeast USA Oil and Gas Market Volume (Tonnes) Forecast, by Application 2019 & 2032
- Table 15: Southeast USA Oil and Gas Market Revenue (Million) Forecast, by Application 2019 & 2032
- Table 16: Southeast USA Oil and Gas Market Volume (Tonnes) Forecast, by Application 2019 & 2032
- Table 17: Midwest USA Oil and Gas Market Revenue (Million) Forecast, by Application 2019 & 2032
- Table 18: Midwest USA Oil and Gas Market Volume (Tonnes) Forecast, by Application 2019 & 2032
- Table 19: Southwest USA Oil and Gas Market Revenue (Million) Forecast, by Application 2019 & 2032
- Table 20: Southwest USA Oil and Gas Market Volume (Tonnes) Forecast, by Application 2019 & 2032
- Table 21: West USA Oil and Gas Market Revenue (Million) Forecast, by Application 2019 & 2032
- Table 22: West USA Oil and Gas Market Volume (Tonnes) Forecast, by Application 2019 & 2032
- Table 23: Global USA Oil and Gas Market Revenue Million Forecast, by Upstream 2019 & 2032
- Table 24: Global USA Oil and Gas Market Volume Tonnes Forecast, by Upstream 2019 & 2032
- Table 25: Global USA Oil and Gas Market Revenue Million Forecast, by Midstream 2019 & 2032
- Table 26: Global USA Oil and Gas Market Volume Tonnes Forecast, by Midstream 2019 & 2032
- Table 27: Global USA Oil and Gas Market Revenue Million Forecast, by Downstream 2019 & 2032
- Table 28: Global USA Oil and Gas Market Volume Tonnes Forecast, by Downstream 2019 & 2032
- Table 29: Global USA Oil and Gas Market Revenue Million Forecast, by Country 2019 & 2032
- Table 30: Global USA Oil and Gas Market Volume Tonnes Forecast, by Country 2019 & 2032
- Table 31: United States USA Oil and Gas Market Revenue (Million) Forecast, by Application 2019 & 2032
- Table 32: United States USA Oil and Gas Market Volume (Tonnes) Forecast, by Application 2019 & 2032
- Table 33: Canada USA Oil and Gas Market Revenue (Million) Forecast, by Application 2019 & 2032
- Table 34: Canada USA Oil and Gas Market Volume (Tonnes) Forecast, by Application 2019 & 2032
- Table 35: Mexico USA Oil and Gas Market Revenue (Million) Forecast, by Application 2019 & 2032
- Table 36: Mexico USA Oil and Gas Market Volume (Tonnes) Forecast, by Application 2019 & 2032
- Table 37: Global USA Oil and Gas Market Revenue Million Forecast, by Upstream 2019 & 2032
- Table 38: Global USA Oil and Gas Market Volume Tonnes Forecast, by Upstream 2019 & 2032
- Table 39: Global USA Oil and Gas Market Revenue Million Forecast, by Midstream 2019 & 2032
- Table 40: Global USA Oil and Gas Market Volume Tonnes Forecast, by Midstream 2019 & 2032
- Table 41: Global USA Oil and Gas Market Revenue Million Forecast, by Downstream 2019 & 2032
- Table 42: Global USA Oil and Gas Market Volume Tonnes Forecast, by Downstream 2019 & 2032
- Table 43: Global USA Oil and Gas Market Revenue Million Forecast, by Country 2019 & 2032
- Table 44: Global USA Oil and Gas Market Volume Tonnes Forecast, by Country 2019 & 2032
- Table 45: Brazil USA Oil and Gas Market Revenue (Million) Forecast, by Application 2019 & 2032
- Table 46: Brazil USA Oil and Gas Market Volume (Tonnes) Forecast, by Application 2019 & 2032
- Table 47: Argentina USA Oil and Gas Market Revenue (Million) Forecast, by Application 2019 & 2032
- Table 48: Argentina USA Oil and Gas Market Volume (Tonnes) Forecast, by Application 2019 & 2032
- Table 49: Rest of South America USA Oil and Gas Market Revenue (Million) Forecast, by Application 2019 & 2032
- Table 50: Rest of South America USA Oil and Gas Market Volume (Tonnes) Forecast, by Application 2019 & 2032
- Table 51: Global USA Oil and Gas Market Revenue Million Forecast, by Upstream 2019 & 2032
- Table 52: Global USA Oil and Gas Market Volume Tonnes Forecast, by Upstream 2019 & 2032
- Table 53: Global USA Oil and Gas Market Revenue Million Forecast, by Midstream 2019 & 2032
- Table 54: Global USA Oil and Gas Market Volume Tonnes Forecast, by Midstream 2019 & 2032
- Table 55: Global USA Oil and Gas Market Revenue Million Forecast, by Downstream 2019 & 2032
- Table 56: Global USA Oil and Gas Market Volume Tonnes Forecast, by Downstream 2019 & 2032
- Table 57: Global USA Oil and Gas Market Revenue Million Forecast, by Country 2019 & 2032
- Table 58: Global USA Oil and Gas Market Volume Tonnes Forecast, by Country 2019 & 2032
- Table 59: United Kingdom USA Oil and Gas Market Revenue (Million) Forecast, by Application 2019 & 2032
- Table 60: United Kingdom USA Oil and Gas Market Volume (Tonnes) Forecast, by Application 2019 & 2032
- Table 61: Germany USA Oil and Gas Market Revenue (Million) Forecast, by Application 2019 & 2032
- Table 62: Germany USA Oil and Gas Market Volume (Tonnes) Forecast, by Application 2019 & 2032
- Table 63: France USA Oil and Gas Market Revenue (Million) Forecast, by Application 2019 & 2032
- Table 64: France USA Oil and Gas Market Volume (Tonnes) Forecast, by Application 2019 & 2032
- Table 65: Italy USA Oil and Gas Market Revenue (Million) Forecast, by Application 2019 & 2032
- Table 66: Italy USA Oil and Gas Market Volume (Tonnes) Forecast, by Application 2019 & 2032
- Table 67: Spain USA Oil and Gas Market Revenue (Million) Forecast, by Application 2019 & 2032
- Table 68: Spain USA Oil and Gas Market Volume (Tonnes) Forecast, by Application 2019 & 2032
- Table 69: Russia USA Oil and Gas Market Revenue (Million) Forecast, by Application 2019 & 2032
- Table 70: Russia USA Oil and Gas Market Volume (Tonnes) Forecast, by Application 2019 & 2032
- Table 71: Benelux USA Oil and Gas Market Revenue (Million) Forecast, by Application 2019 & 2032
- Table 72: Benelux USA Oil and Gas Market Volume (Tonnes) Forecast, by Application 2019 & 2032
- Table 73: Nordics USA Oil and Gas Market Revenue (Million) Forecast, by Application 2019 & 2032
- Table 74: Nordics USA Oil and Gas Market Volume (Tonnes) Forecast, by Application 2019 & 2032
- Table 75: Rest of Europe USA Oil and Gas Market Revenue (Million) Forecast, by Application 2019 & 2032
- Table 76: Rest of Europe USA Oil and Gas Market Volume (Tonnes) Forecast, by Application 2019 & 2032
- Table 77: Global USA Oil and Gas Market Revenue Million Forecast, by Upstream 2019 & 2032
- Table 78: Global USA Oil and Gas Market Volume Tonnes Forecast, by Upstream 2019 & 2032
- Table 79: Global USA Oil and Gas Market Revenue Million Forecast, by Midstream 2019 & 2032
- Table 80: Global USA Oil and Gas Market Volume Tonnes Forecast, by Midstream 2019 & 2032
- Table 81: Global USA Oil and Gas Market Revenue Million Forecast, by Downstream 2019 & 2032
- Table 82: Global USA Oil and Gas Market Volume Tonnes Forecast, by Downstream 2019 & 2032
- Table 83: Global USA Oil and Gas Market Revenue Million Forecast, by Country 2019 & 2032
- Table 84: Global USA Oil and Gas Market Volume Tonnes Forecast, by Country 2019 & 2032
- Table 85: Turkey USA Oil and Gas Market Revenue (Million) Forecast, by Application 2019 & 2032
- Table 86: Turkey USA Oil and Gas Market Volume (Tonnes) Forecast, by Application 2019 & 2032
- Table 87: Israel USA Oil and Gas Market Revenue (Million) Forecast, by Application 2019 & 2032
- Table 88: Israel USA Oil and Gas Market Volume (Tonnes) Forecast, by Application 2019 & 2032
- Table 89: GCC USA Oil and Gas Market Revenue (Million) Forecast, by Application 2019 & 2032
- Table 90: GCC USA Oil and Gas Market Volume (Tonnes) Forecast, by Application 2019 & 2032
- Table 91: North Africa USA Oil and Gas Market Revenue (Million) Forecast, by Application 2019 & 2032
- Table 92: North Africa USA Oil and Gas Market Volume (Tonnes) Forecast, by Application 2019 & 2032
- Table 93: South Africa USA Oil and Gas Market Revenue (Million) Forecast, by Application 2019 & 2032
- Table 94: South Africa USA Oil and Gas Market Volume (Tonnes) Forecast, by Application 2019 & 2032
- Table 95: Rest of Middle East & Africa USA Oil and Gas Market Revenue (Million) Forecast, by Application 2019 & 2032
- Table 96: Rest of Middle East & Africa USA Oil and Gas Market Volume (Tonnes) Forecast, by Application 2019 & 2032
- Table 97: Global USA Oil and Gas Market Revenue Million Forecast, by Upstream 2019 & 2032
- Table 98: Global USA Oil and Gas Market Volume Tonnes Forecast, by Upstream 2019 & 2032
- Table 99: Global USA Oil and Gas Market Revenue Million Forecast, by Midstream 2019 & 2032
- Table 100: Global USA Oil and Gas Market Volume Tonnes Forecast, by Midstream 2019 & 2032
- Table 101: Global USA Oil and Gas Market Revenue Million Forecast, by Downstream 2019 & 2032
- Table 102: Global USA Oil and Gas Market Volume Tonnes Forecast, by Downstream 2019 & 2032
- Table 103: Global USA Oil and Gas Market Revenue Million Forecast, by Country 2019 & 2032
- Table 104: Global USA Oil and Gas Market Volume Tonnes Forecast, by Country 2019 & 2032
- Table 105: China USA Oil and Gas Market Revenue (Million) Forecast, by Application 2019 & 2032
- Table 106: China USA Oil and Gas Market Volume (Tonnes) Forecast, by Application 2019 & 2032
- Table 107: India USA Oil and Gas Market Revenue (Million) Forecast, by Application 2019 & 2032
- Table 108: India USA Oil and Gas Market Volume (Tonnes) Forecast, by Application 2019 & 2032
- Table 109: Japan USA Oil and Gas Market Revenue (Million) Forecast, by Application 2019 & 2032
- Table 110: Japan USA Oil and Gas Market Volume (Tonnes) Forecast, by Application 2019 & 2032
- Table 111: South Korea USA Oil and Gas Market Revenue (Million) Forecast, by Application 2019 & 2032
- Table 112: South Korea USA Oil and Gas Market Volume (Tonnes) Forecast, by Application 2019 & 2032
- Table 113: ASEAN USA Oil and Gas Market Revenue (Million) Forecast, by Application 2019 & 2032
- Table 114: ASEAN USA Oil and Gas Market Volume (Tonnes) Forecast, by Application 2019 & 2032
- Table 115: Oceania USA Oil and Gas Market Revenue (Million) Forecast, by Application 2019 & 2032
- Table 116: Oceania USA Oil and Gas Market Volume (Tonnes) Forecast, by Application 2019 & 2032
- Table 117: Rest of Asia Pacific USA Oil and Gas Market Revenue (Million) Forecast, by Application 2019 & 2032
- Table 118: Rest of Asia Pacific USA Oil and Gas Market Volume (Tonnes) Forecast, by Application 2019 & 2032
Frequently Asked Questions
1. What is the projected Compound Annual Growth Rate (CAGR) of the USA Oil and Gas Market?
The projected CAGR is approximately > 4.00%.
2. Which companies are prominent players in the USA Oil and Gas Market?
Key companies in the market include Shell PLC, Hess Corporation, ExxonMobil Corporation, Marathon Petroleum Corporation, Occidental Petroleum, Chevron Corporation, ConocoPhillips Company, Valero Energy, EOG Resources, Total Energies SE, Phillips, BP PLC.
3. What are the main segments of the USA Oil and Gas Market?
The market segments include Upstream, Midstream, Downstream.
4. Can you provide details about the market size?
The market size is estimated to be USD XX Million as of 2022.
5. What are some drivers contributing to market growth?
4.; Modernization and Upgrades of Existing Military Aircraft Fleets4.; Increasing Defense Budgets.
6. What are the notable trends driving market growth?
Upstream Sector Expected Witness Significant Growth.
7. Are there any restraints impacting market growth?
4.; Shift Toward Unmanned Aircraft.
8. Can you provide examples of recent developments in the market?
March 2022: The United States' President Joe Biden agreed to a landmark energy supply deal with the European Union. Under this deal, the United States was expected to increase transatlantic gas deliveries. This deal is important to reduce dependence on Russia after the Russia-Ukraine War.
9. What pricing options are available for accessing the report?
Pricing options include single-user, multi-user, and enterprise licenses priced at USD 3800, USD 4500, and USD 5800 respectively.
10. Is the market size provided in terms of value or volume?
The market size is provided in terms of value, measured in Million and volume, measured in Tonnes.
11. Are there any specific market keywords associated with the report?
Yes, the market keyword associated with the report is "USA Oil and Gas Market," which aids in identifying and referencing the specific market segment covered.
12. How do I determine which pricing option suits my needs best?
The pricing options vary based on user requirements and access needs. Individual users may opt for single-user licenses, while businesses requiring broader access may choose multi-user or enterprise licenses for cost-effective access to the report.
13. Are there any additional resources or data provided in the USA Oil and Gas Market report?
While the report offers comprehensive insights, it's advisable to review the specific contents or supplementary materials provided to ascertain if additional resources or data are available.
14. How can I stay updated on further developments or reports in the USA Oil and Gas Market?
To stay informed about further developments, trends, and reports in the USA Oil and Gas Market, consider subscribing to industry newsletters, following relevant companies and organizations, or regularly checking reputable industry news sources and publications.
Methodology
Step 1 - Identification of Relevant Samples Size from Population Database


Step 2 - Approaches for Defining Global Market Size (Value, Volume* & Price*)

Note*: In applicable scenarios
Step 3 - Data Sources
Primary Research
- Web Analytics
- Survey Reports
- Research Institute
- Latest Research Reports
- Opinion Leaders
Secondary Research
- Annual Reports
- White Paper
- Latest Press Release
- Industry Association
- Paid Database
- Investor Presentations

Step 4 - Data Triangulation
Involves using different sources of information in order to increase the validity of a study
These sources are likely to be stakeholders in a program - participants, other researchers, program staff, other community members, and so on.
Then we put all data in single framework & apply various statistical tools to find out the dynamic on the market.
During the analysis stage, feedback from the stakeholder groups would be compared to determine areas of agreement as well as areas of divergence
