

Key Insights
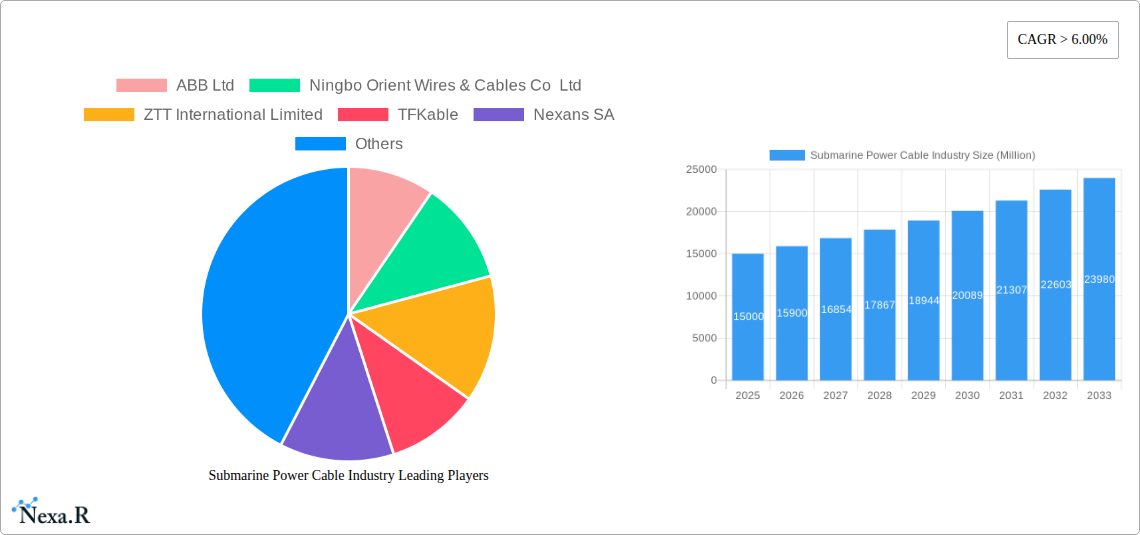
The submarine power cable industry is experiencing robust growth, driven by the increasing demand for renewable energy integration, offshore wind farm development, and the expansion of interconnected power grids. A compound annual growth rate (CAGR) exceeding 6% indicates a significant market expansion from 2019 to 2033. The market is segmented primarily by cable type: High-Voltage Direct Current (HVDC) and High-Voltage Alternating Current (HVAC). HVDC cables are favored for long-distance, high-capacity transmission, particularly in offshore wind projects, while HVAC cables remain prevalent for shorter distances and lower capacity needs. Key players like ABB, Nexans, and Prysmian Group dominate the market, leveraging their technological expertise and global reach. Regional growth varies, with North America and Asia-Pacific showing substantial potential, fueled by large-scale renewable energy initiatives and infrastructure investments in these regions. Challenges include the high initial investment costs associated with submarine cable installation and maintenance, as well as the complex regulatory environment governing offshore energy projects. However, the long-term benefits of reliable and efficient power transmission, coupled with government incentives promoting renewable energy adoption, are expected to outweigh these restraints, contributing to continued market expansion.
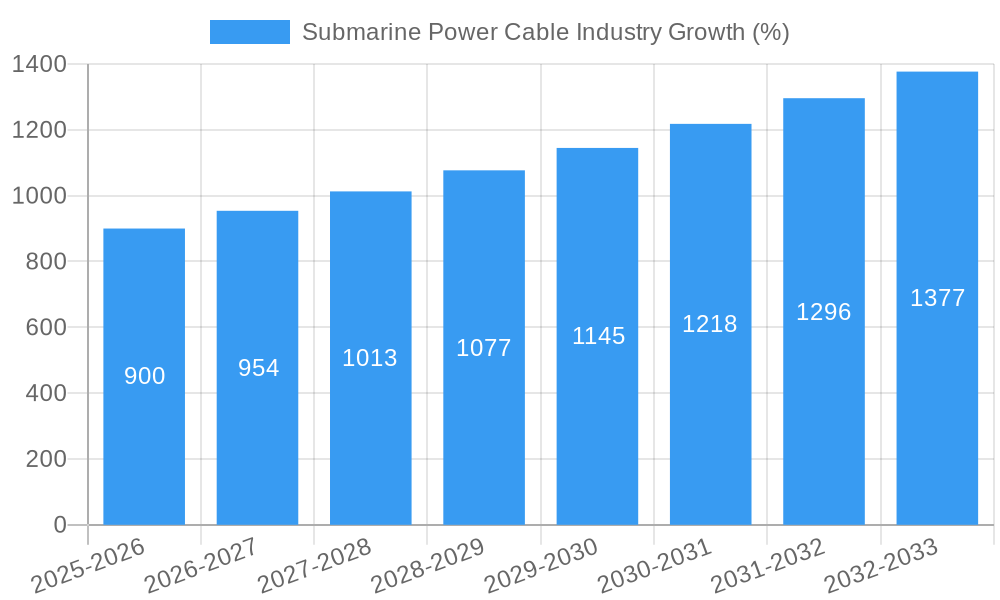
The forecast period (2025-2033) anticipates a significant rise in market value, with a projected increase significantly influenced by the rising global energy demands and the accelerated development of offshore wind farms. Continued technological advancements, leading to increased cable capacity and efficiency, will further drive market growth. The competitive landscape is expected to remain intensely competitive, with existing players striving for innovation and market share expansion while new entrants potentially emerging with niche technologies or regional expertise. Strategic partnerships and mergers & acquisitions are likely to shape the industry's competitive dynamics. The market’s future success will depend on mitigating risks associated with cable lifespan, environmental considerations (particularly marine life impact), and the effective management of complex supply chains.
Submarine Power Cable Industry Market Report: 2019-2033
This comprehensive report provides an in-depth analysis of the global submarine power cable industry, offering invaluable insights for industry professionals, investors, and strategic decision-makers. The report covers the period 2019-2033, with a base year of 2025 and a forecast period of 2025-2033. Market values are presented in millions of units.
Submarine Power Cable Industry Market Dynamics & Structure
The submarine power cable market is characterized by moderate concentration, with key players like ABB Ltd, Nexans SA, and Prysmian Group holding significant market share. However, the presence of several regional players and emerging companies indicates a dynamic competitive landscape. Technological innovation, particularly in HVDC (High Voltage Direct Current) cable technology, is a key driver, alongside the growing demand for renewable energy integration and offshore wind farm development. Stringent regulatory frameworks governing cable installation and safety standards influence market dynamics. While fiber optic cables represent a substitute for communication purposes, the demand for efficient power transmission remains strong. The market exhibits significant M&A activity, reflecting strategic efforts for expansion and technological advancement. For instance, the global M&A deal volume in the power cable sector reached xx Million in 2024, showing a xx% increase from the previous year.
- Market Concentration: Moderately concentrated, with top 5 players holding approximately xx% market share in 2024.
- Technological Innovation: Focus on HVDC technology for long-distance transmission and increased capacity.
- Regulatory Landscape: Stringent safety and environmental regulations impacting installation and operations.
- Competitive Substitutes: Limited direct substitutes, although fiber optic cables offer competition in some applications.
- End-User Demographics: Primarily energy companies, government entities, and offshore wind farm developers.
- M&A Trends: Significant consolidation through mergers and acquisitions, increasing vertical integration and expanding geographic reach.
Submarine Power Cable Industry Growth Trends & Insights
The global submarine power cable market experienced substantial growth during the historical period (2019-2024), driven by the increasing demand for renewable energy sources, the rise of offshore wind farms, and the expansion of interconnector projects. The market size reached xx Million in 2024, exhibiting a CAGR of xx% during the historical period. Technological advancements such as higher voltage capacity cables and improved manufacturing processes have further fueled market expansion. The adoption rate of HVDC technology is increasing significantly, driven by its efficiency in long-distance power transmission. Shifting consumer behavior towards sustainable energy sources continues to positively impact market growth, and is expected to propel the market to xx Million by 2033, with a projected CAGR of xx% during the forecast period (2025-2033).
Dominant Regions, Countries, or Segments in Submarine Power Cable Industry
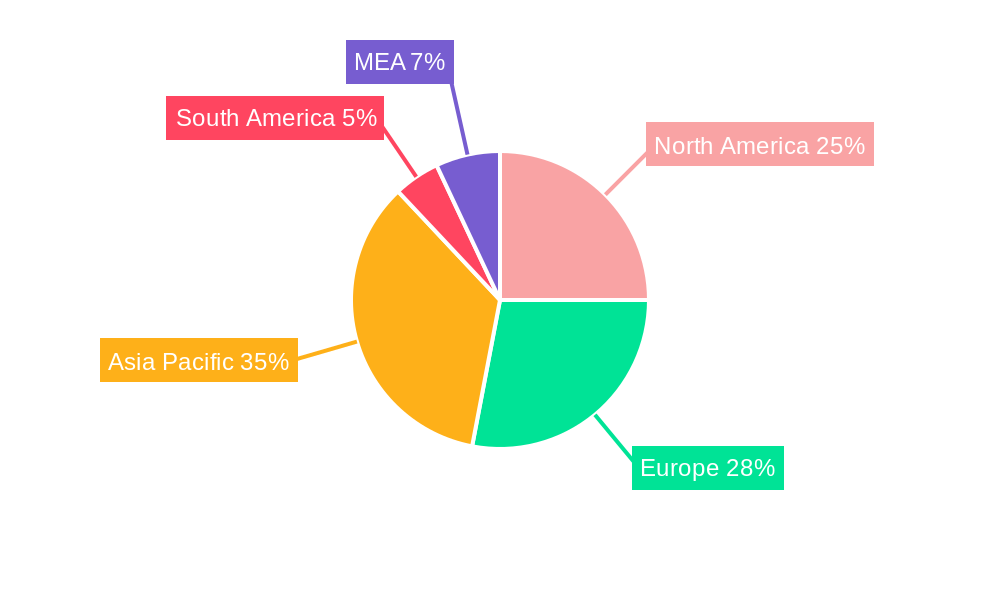
The Asia-Pacific region, particularly China, dominates the global submarine power cable market, driven by substantial investments in renewable energy infrastructure, offshore wind power development, and expanding electricity grids. Europe and North America also represent significant markets, with ongoing expansion of offshore wind farms and interconnector projects. Among cable types, HVDC cables are witnessing faster growth due to their superior long-distance transmission capabilities, accounting for approximately xx% of the market share in 2024.
- Asia-Pacific: Strong growth fueled by substantial renewable energy investments and expanding electricity grids.
- Europe: Significant market driven by the expansion of offshore wind farms and interconnector projects.
- North America: Steady growth, primarily focused on offshore wind projects and grid modernization efforts.
- HVDC segment: Dominates due to efficiency in long-distance power transmission.
- HVAC segment: Remains a significant part of the market, driven by ongoing upgrades and expansions in existing grids.
Submarine Power Cable Industry Product Landscape
Submarine power cables are designed to withstand immense water pressure and diverse environmental conditions. Recent innovations focus on improved insulation materials, higher voltage capacities, and enhanced durability. Key performance metrics include voltage rating, current carrying capacity, and lifespan. Manufacturers leverage advanced materials and manufacturing techniques to offer products with superior performance characteristics, including increased transmission capacity, reduced energy losses, and longer operational lifetimes. Unique selling propositions include advanced cable designs for extreme depths and environmental conditions, and optimized manufacturing processes for cost-effectiveness.
Key Drivers, Barriers & Challenges in Submarine Power Cable Industry
Key Drivers:
- The rising demand for renewable energy sources (especially offshore wind).
- The expansion of electricity grids and the need for long-distance power transmission.
- Government initiatives promoting sustainable energy and grid modernization.
Key Challenges & Restraints:
- High installation costs associated with submarine cable deployment.
- Complex regulatory approvals and permitting processes.
- Potential risks associated with underwater cable maintenance and repairs.
- The intense competition within the submarine power cable industry. This has led to price pressure.
- Supply chain disruptions have impacted manufacturing timelines and costs.
Emerging Opportunities in Submarine Power Cable Industry
- The growth of offshore wind farms globally offers significant untapped market potential.
- Innovations in cable materials and designs offer opportunities for enhanced efficiency and cost reduction.
- The increasing demand for energy storage solutions creates opportunities for integrated cable systems.
Growth Accelerators in the Submarine Power Cable Industry Industry
Technological advancements in cable design, insulation, and manufacturing processes, coupled with strategic partnerships to secure new projects and enter emerging markets, are key growth accelerators. The development of advanced manufacturing techniques and the implementation of efficient supply chain management will further enhance the industry's potential.
Key Players Shaping the Submarine Power Cable Industry Market
- ABB Ltd
- Ningbo Orient Wires & Cables Co Ltd
- ZTT International Limited
- TFKable
- Nexans SA
- Furukawa Electric Co Ltd
- NKT A/S
- Prysmian Group
- Sumitomo Electric Industries Limited
- KEI Industries Limited
- LS Cable & System Ltd
Notable Milestones in Submarine Power Cable Industry Sector
- November 2022: LS Cable & System Ltd. becomes the largest shareholder of KT Submarine Co., strengthening its position in the submarine cable market.
In-Depth Submarine Power Cable Industry Market Outlook
The submarine power cable industry is poised for substantial growth over the next decade, driven by the ongoing expansion of renewable energy infrastructure, the increasing demand for long-distance power transmission, and continuous technological advancements. Strategic partnerships and investments in research and development will play a crucial role in shaping the future of this dynamic market. The focus on sustainable energy solutions and increasing governmental support for renewable energy infrastructure will continue to drive the demand for submarine power cables.
Submarine Power Cable Industry Segmentation
-
1. Type of Current
- 1.1. HVDC
- 1.2. HVAC
Submarine Power Cable Industry Segmentation By Geography
- 1. North America
- 2. Europe
- 3. Asia Pacific
- 4. South America
- 5. Middle East and Africa
Submarine Power Cable Industry REPORT HIGHLIGHTS
| Aspects | Details |
|---|---|
| Study Period | 2019-2033 |
| Base Year | 2024 |
| Estimated Year | 2025 |
| Forecast Period | 2025-2033 |
| Historical Period | 2019-2024 |
| Growth Rate | CAGR of > 6.00% from 2019-2033 |
| Segmentation |
|
Table of Contents
- 1. Introduction
- 1.1. Research Scope
- 1.2. Market Segmentation
- 1.3. Research Methodology
- 1.4. Definitions and Assumptions
- 2. Executive Summary
- 2.1. Introduction
- 3. Market Dynamics
- 3.1. Introduction
- 3.2. Market Drivers
- 3.2.1. HVDC submarine cables are increasingly preferred for long-distance power transmission due to their efficiency and lower energy losses compared to alternating current (AC) systems. The adoption of HVDC technology is a significant driver in the submarine power cable market.
- 3.3. Market Restrains
- 3.3.1 The deployment and maintenance of submarine power cables involve substantial financial investments. The complex installation procedures
- 3.3.2 specialized equipment requirements
- 3.3.3 and the need for expert personnel contribute to these high costs.
- 3.4. Market Trends
- 3.4.1 There is a notable trend towards integrating renewable energy sources
- 3.4.2 such as offshore wind and solar power
- 3.4.3 into existing power grids. Submarine power cables play a crucial role in this integration by connecting remote renewable energy sites to onshore grids
- 4. Market Factor Analysis
- 4.1. Porters Five Forces
- 4.2. Supply/Value Chain
- 4.3. PESTEL analysis
- 4.4. Market Entropy
- 4.5. Patent/Trademark Analysis
- 5. Global Submarine Power Cable Industry Analysis, Insights and Forecast, 2019-2031
- 5.1. Market Analysis, Insights and Forecast - by Type of Current
- 5.1.1. HVDC
- 5.1.2. HVAC
- 5.2. Market Analysis, Insights and Forecast - by Region
- 5.2.1. North America
- 5.2.2. Europe
- 5.2.3. Asia Pacific
- 5.2.4. South America
- 5.2.5. Middle East and Africa
- 5.1. Market Analysis, Insights and Forecast - by Type of Current
- 6. North America Submarine Power Cable Industry Analysis, Insights and Forecast, 2019-2031
- 6.1. Market Analysis, Insights and Forecast - by Type of Current
- 6.1.1. HVDC
- 6.1.2. HVAC
- 6.1. Market Analysis, Insights and Forecast - by Type of Current
- 7. Europe Submarine Power Cable Industry Analysis, Insights and Forecast, 2019-2031
- 7.1. Market Analysis, Insights and Forecast - by Type of Current
- 7.1.1. HVDC
- 7.1.2. HVAC
- 7.1. Market Analysis, Insights and Forecast - by Type of Current
- 8. Asia Pacific Submarine Power Cable Industry Analysis, Insights and Forecast, 2019-2031
- 8.1. Market Analysis, Insights and Forecast - by Type of Current
- 8.1.1. HVDC
- 8.1.2. HVAC
- 8.1. Market Analysis, Insights and Forecast - by Type of Current
- 9. South America Submarine Power Cable Industry Analysis, Insights and Forecast, 2019-2031
- 9.1. Market Analysis, Insights and Forecast - by Type of Current
- 9.1.1. HVDC
- 9.1.2. HVAC
- 9.1. Market Analysis, Insights and Forecast - by Type of Current
- 10. Middle East and Africa Submarine Power Cable Industry Analysis, Insights and Forecast, 2019-2031
- 10.1. Market Analysis, Insights and Forecast - by Type of Current
- 10.1.1. HVDC
- 10.1.2. HVAC
- 10.1. Market Analysis, Insights and Forecast - by Type of Current
- 11. North America Submarine Power Cable Industry Analysis, Insights and Forecast, 2019-2031
- 11.1. Market Analysis, Insights and Forecast - By Country/Sub-region
- 11.1.1 United States
- 11.1.2 Canada
- 11.1.3 Mexico
- 12. Europe Submarine Power Cable Industry Analysis, Insights and Forecast, 2019-2031
- 12.1. Market Analysis, Insights and Forecast - By Country/Sub-region
- 12.1.1 Germany
- 12.1.2 United Kingdom
- 12.1.3 France
- 12.1.4 Spain
- 12.1.5 Italy
- 12.1.6 Spain
- 12.1.7 Belgium
- 12.1.8 Netherland
- 12.1.9 Nordics
- 12.1.10 Rest of Europe
- 13. Asia Pacific Submarine Power Cable Industry Analysis, Insights and Forecast, 2019-2031
- 13.1. Market Analysis, Insights and Forecast - By Country/Sub-region
- 13.1.1 China
- 13.1.2 Japan
- 13.1.3 India
- 13.1.4 South Korea
- 13.1.5 Southeast Asia
- 13.1.6 Australia
- 13.1.7 Indonesia
- 13.1.8 Phillipes
- 13.1.9 Singapore
- 13.1.10 Thailandc
- 13.1.11 Rest of Asia Pacific
- 14. South America Submarine Power Cable Industry Analysis, Insights and Forecast, 2019-2031
- 14.1. Market Analysis, Insights and Forecast - By Country/Sub-region
- 14.1.1 Brazil
- 14.1.2 Argentina
- 14.1.3 Peru
- 14.1.4 Chile
- 14.1.5 Colombia
- 14.1.6 Ecuador
- 14.1.7 Venezuela
- 14.1.8 Rest of South America
- 15. North America Submarine Power Cable Industry Analysis, Insights and Forecast, 2019-2031
- 15.1. Market Analysis, Insights and Forecast - By Country/Sub-region
- 15.1.1 United States
- 15.1.2 Canada
- 15.1.3 Mexico
- 16. MEA Submarine Power Cable Industry Analysis, Insights and Forecast, 2019-2031
- 16.1. Market Analysis, Insights and Forecast - By Country/Sub-region
- 16.1.1 United Arab Emirates
- 16.1.2 Saudi Arabia
- 16.1.3 South Africa
- 16.1.4 Rest of Middle East and Africa
- 17. Competitive Analysis
- 17.1. Global Market Share Analysis 2024
- 17.2. Company Profiles
- 17.2.1 ABB Ltd
- 17.2.1.1. Overview
- 17.2.1.2. Products
- 17.2.1.3. SWOT Analysis
- 17.2.1.4. Recent Developments
- 17.2.1.5. Financials (Based on Availability)
- 17.2.2 Ningbo Orient Wires & Cables Co Ltd
- 17.2.2.1. Overview
- 17.2.2.2. Products
- 17.2.2.3. SWOT Analysis
- 17.2.2.4. Recent Developments
- 17.2.2.5. Financials (Based on Availability)
- 17.2.3 ZTT International Limited
- 17.2.3.1. Overview
- 17.2.3.2. Products
- 17.2.3.3. SWOT Analysis
- 17.2.3.4. Recent Developments
- 17.2.3.5. Financials (Based on Availability)
- 17.2.4 TFKable
- 17.2.4.1. Overview
- 17.2.4.2. Products
- 17.2.4.3. SWOT Analysis
- 17.2.4.4. Recent Developments
- 17.2.4.5. Financials (Based on Availability)
- 17.2.5 Nexans SA
- 17.2.5.1. Overview
- 17.2.5.2. Products
- 17.2.5.3. SWOT Analysis
- 17.2.5.4. Recent Developments
- 17.2.5.5. Financials (Based on Availability)
- 17.2.6 Furukawa Electric Co Ltd
- 17.2.6.1. Overview
- 17.2.6.2. Products
- 17.2.6.3. SWOT Analysis
- 17.2.6.4. Recent Developments
- 17.2.6.5. Financials (Based on Availability)
- 17.2.7 NKT A/S
- 17.2.7.1. Overview
- 17.2.7.2. Products
- 17.2.7.3. SWOT Analysis
- 17.2.7.4. Recent Developments
- 17.2.7.5. Financials (Based on Availability)
- 17.2.8 Prysmian Group
- 17.2.8.1. Overview
- 17.2.8.2. Products
- 17.2.8.3. SWOT Analysis
- 17.2.8.4. Recent Developments
- 17.2.8.5. Financials (Based on Availability)
- 17.2.9 Sumitomo Electric Industries Limited
- 17.2.9.1. Overview
- 17.2.9.2. Products
- 17.2.9.3. SWOT Analysis
- 17.2.9.4. Recent Developments
- 17.2.9.5. Financials (Based on Availability)
- 17.2.10 KEI Industries Limited
- 17.2.10.1. Overview
- 17.2.10.2. Products
- 17.2.10.3. SWOT Analysis
- 17.2.10.4. Recent Developments
- 17.2.10.5. Financials (Based on Availability)
- 17.2.11 LS Cable & System Ltd
- 17.2.11.1. Overview
- 17.2.11.2. Products
- 17.2.11.3. SWOT Analysis
- 17.2.11.4. Recent Developments
- 17.2.11.5. Financials (Based on Availability)
- 17.2.1 ABB Ltd
List of Figures
- Figure 1: Global Submarine Power Cable Industry Revenue Breakdown (Million, %) by Region 2024 & 2032
- Figure 2: North America Submarine Power Cable Industry Revenue (Million), by Country 2024 & 2032
- Figure 3: North America Submarine Power Cable Industry Revenue Share (%), by Country 2024 & 2032
- Figure 4: Europe Submarine Power Cable Industry Revenue (Million), by Country 2024 & 2032
- Figure 5: Europe Submarine Power Cable Industry Revenue Share (%), by Country 2024 & 2032
- Figure 6: Asia Pacific Submarine Power Cable Industry Revenue (Million), by Country 2024 & 2032
- Figure 7: Asia Pacific Submarine Power Cable Industry Revenue Share (%), by Country 2024 & 2032
- Figure 8: South America Submarine Power Cable Industry Revenue (Million), by Country 2024 & 2032
- Figure 9: South America Submarine Power Cable Industry Revenue Share (%), by Country 2024 & 2032
- Figure 10: North America Submarine Power Cable Industry Revenue (Million), by Country 2024 & 2032
- Figure 11: North America Submarine Power Cable Industry Revenue Share (%), by Country 2024 & 2032
- Figure 12: MEA Submarine Power Cable Industry Revenue (Million), by Country 2024 & 2032
- Figure 13: MEA Submarine Power Cable Industry Revenue Share (%), by Country 2024 & 2032
- Figure 14: North America Submarine Power Cable Industry Revenue (Million), by Type of Current 2024 & 2032
- Figure 15: North America Submarine Power Cable Industry Revenue Share (%), by Type of Current 2024 & 2032
- Figure 16: North America Submarine Power Cable Industry Revenue (Million), by Country 2024 & 2032
- Figure 17: North America Submarine Power Cable Industry Revenue Share (%), by Country 2024 & 2032
- Figure 18: Europe Submarine Power Cable Industry Revenue (Million), by Type of Current 2024 & 2032
- Figure 19: Europe Submarine Power Cable Industry Revenue Share (%), by Type of Current 2024 & 2032
- Figure 20: Europe Submarine Power Cable Industry Revenue (Million), by Country 2024 & 2032
- Figure 21: Europe Submarine Power Cable Industry Revenue Share (%), by Country 2024 & 2032
- Figure 22: Asia Pacific Submarine Power Cable Industry Revenue (Million), by Type of Current 2024 & 2032
- Figure 23: Asia Pacific Submarine Power Cable Industry Revenue Share (%), by Type of Current 2024 & 2032
- Figure 24: Asia Pacific Submarine Power Cable Industry Revenue (Million), by Country 2024 & 2032
- Figure 25: Asia Pacific Submarine Power Cable Industry Revenue Share (%), by Country 2024 & 2032
- Figure 26: South America Submarine Power Cable Industry Revenue (Million), by Type of Current 2024 & 2032
- Figure 27: South America Submarine Power Cable Industry Revenue Share (%), by Type of Current 2024 & 2032
- Figure 28: South America Submarine Power Cable Industry Revenue (Million), by Country 2024 & 2032
- Figure 29: South America Submarine Power Cable Industry Revenue Share (%), by Country 2024 & 2032
- Figure 30: Middle East and Africa Submarine Power Cable Industry Revenue (Million), by Type of Current 2024 & 2032
- Figure 31: Middle East and Africa Submarine Power Cable Industry Revenue Share (%), by Type of Current 2024 & 2032
- Figure 32: Middle East and Africa Submarine Power Cable Industry Revenue (Million), by Country 2024 & 2032
- Figure 33: Middle East and Africa Submarine Power Cable Industry Revenue Share (%), by Country 2024 & 2032
List of Tables
- Table 1: Global Submarine Power Cable Industry Revenue Million Forecast, by Region 2019 & 2032
- Table 2: Global Submarine Power Cable Industry Revenue Million Forecast, by Type of Current 2019 & 2032
- Table 3: Global Submarine Power Cable Industry Revenue Million Forecast, by Region 2019 & 2032
- Table 4: Global Submarine Power Cable Industry Revenue Million Forecast, by Country 2019 & 2032
- Table 5: United States Submarine Power Cable Industry Revenue (Million) Forecast, by Application 2019 & 2032
- Table 6: Canada Submarine Power Cable Industry Revenue (Million) Forecast, by Application 2019 & 2032
- Table 7: Mexico Submarine Power Cable Industry Revenue (Million) Forecast, by Application 2019 & 2032
- Table 8: Global Submarine Power Cable Industry Revenue Million Forecast, by Country 2019 & 2032
- Table 9: Germany Submarine Power Cable Industry Revenue (Million) Forecast, by Application 2019 & 2032
- Table 10: United Kingdom Submarine Power Cable Industry Revenue (Million) Forecast, by Application 2019 & 2032
- Table 11: France Submarine Power Cable Industry Revenue (Million) Forecast, by Application 2019 & 2032
- Table 12: Spain Submarine Power Cable Industry Revenue (Million) Forecast, by Application 2019 & 2032
- Table 13: Italy Submarine Power Cable Industry Revenue (Million) Forecast, by Application 2019 & 2032
- Table 14: Spain Submarine Power Cable Industry Revenue (Million) Forecast, by Application 2019 & 2032
- Table 15: Belgium Submarine Power Cable Industry Revenue (Million) Forecast, by Application 2019 & 2032
- Table 16: Netherland Submarine Power Cable Industry Revenue (Million) Forecast, by Application 2019 & 2032
- Table 17: Nordics Submarine Power Cable Industry Revenue (Million) Forecast, by Application 2019 & 2032
- Table 18: Rest of Europe Submarine Power Cable Industry Revenue (Million) Forecast, by Application 2019 & 2032
- Table 19: Global Submarine Power Cable Industry Revenue Million Forecast, by Country 2019 & 2032
- Table 20: China Submarine Power Cable Industry Revenue (Million) Forecast, by Application 2019 & 2032
- Table 21: Japan Submarine Power Cable Industry Revenue (Million) Forecast, by Application 2019 & 2032
- Table 22: India Submarine Power Cable Industry Revenue (Million) Forecast, by Application 2019 & 2032
- Table 23: South Korea Submarine Power Cable Industry Revenue (Million) Forecast, by Application 2019 & 2032
- Table 24: Southeast Asia Submarine Power Cable Industry Revenue (Million) Forecast, by Application 2019 & 2032
- Table 25: Australia Submarine Power Cable Industry Revenue (Million) Forecast, by Application 2019 & 2032
- Table 26: Indonesia Submarine Power Cable Industry Revenue (Million) Forecast, by Application 2019 & 2032
- Table 27: Phillipes Submarine Power Cable Industry Revenue (Million) Forecast, by Application 2019 & 2032
- Table 28: Singapore Submarine Power Cable Industry Revenue (Million) Forecast, by Application 2019 & 2032
- Table 29: Thailandc Submarine Power Cable Industry Revenue (Million) Forecast, by Application 2019 & 2032
- Table 30: Rest of Asia Pacific Submarine Power Cable Industry Revenue (Million) Forecast, by Application 2019 & 2032
- Table 31: Global Submarine Power Cable Industry Revenue Million Forecast, by Country 2019 & 2032
- Table 32: Brazil Submarine Power Cable Industry Revenue (Million) Forecast, by Application 2019 & 2032
- Table 33: Argentina Submarine Power Cable Industry Revenue (Million) Forecast, by Application 2019 & 2032
- Table 34: Peru Submarine Power Cable Industry Revenue (Million) Forecast, by Application 2019 & 2032
- Table 35: Chile Submarine Power Cable Industry Revenue (Million) Forecast, by Application 2019 & 2032
- Table 36: Colombia Submarine Power Cable Industry Revenue (Million) Forecast, by Application 2019 & 2032
- Table 37: Ecuador Submarine Power Cable Industry Revenue (Million) Forecast, by Application 2019 & 2032
- Table 38: Venezuela Submarine Power Cable Industry Revenue (Million) Forecast, by Application 2019 & 2032
- Table 39: Rest of South America Submarine Power Cable Industry Revenue (Million) Forecast, by Application 2019 & 2032
- Table 40: Global Submarine Power Cable Industry Revenue Million Forecast, by Country 2019 & 2032
- Table 41: United States Submarine Power Cable Industry Revenue (Million) Forecast, by Application 2019 & 2032
- Table 42: Canada Submarine Power Cable Industry Revenue (Million) Forecast, by Application 2019 & 2032
- Table 43: Mexico Submarine Power Cable Industry Revenue (Million) Forecast, by Application 2019 & 2032
- Table 44: Global Submarine Power Cable Industry Revenue Million Forecast, by Country 2019 & 2032
- Table 45: United Arab Emirates Submarine Power Cable Industry Revenue (Million) Forecast, by Application 2019 & 2032
- Table 46: Saudi Arabia Submarine Power Cable Industry Revenue (Million) Forecast, by Application 2019 & 2032
- Table 47: South Africa Submarine Power Cable Industry Revenue (Million) Forecast, by Application 2019 & 2032
- Table 48: Rest of Middle East and Africa Submarine Power Cable Industry Revenue (Million) Forecast, by Application 2019 & 2032
- Table 49: Global Submarine Power Cable Industry Revenue Million Forecast, by Type of Current 2019 & 2032
- Table 50: Global Submarine Power Cable Industry Revenue Million Forecast, by Country 2019 & 2032
- Table 51: Global Submarine Power Cable Industry Revenue Million Forecast, by Type of Current 2019 & 2032
- Table 52: Global Submarine Power Cable Industry Revenue Million Forecast, by Country 2019 & 2032
- Table 53: Global Submarine Power Cable Industry Revenue Million Forecast, by Type of Current 2019 & 2032
- Table 54: Global Submarine Power Cable Industry Revenue Million Forecast, by Country 2019 & 2032
- Table 55: Global Submarine Power Cable Industry Revenue Million Forecast, by Type of Current 2019 & 2032
- Table 56: Global Submarine Power Cable Industry Revenue Million Forecast, by Country 2019 & 2032
- Table 57: Global Submarine Power Cable Industry Revenue Million Forecast, by Type of Current 2019 & 2032
- Table 58: Global Submarine Power Cable Industry Revenue Million Forecast, by Country 2019 & 2032
Frequently Asked Questions
1. What is the projected Compound Annual Growth Rate (CAGR) of the Submarine Power Cable Industry?
The projected CAGR is approximately > 6.00%.
2. Which companies are prominent players in the Submarine Power Cable Industry?
Key companies in the market include ABB Ltd, Ningbo Orient Wires & Cables Co Ltd, ZTT International Limited, TFKable, Nexans SA, Furukawa Electric Co Ltd, NKT A/S, Prysmian Group, Sumitomo Electric Industries Limited, KEI Industries Limited, LS Cable & System Ltd.
3. What are the main segments of the Submarine Power Cable Industry?
The market segments include Type of Current.
4. Can you provide details about the market size?
The market size is estimated to be USD XX Million as of 2022.
5. What are some drivers contributing to market growth?
HVDC submarine cables are increasingly preferred for long-distance power transmission due to their efficiency and lower energy losses compared to alternating current (AC) systems. The adoption of HVDC technology is a significant driver in the submarine power cable market..
6. What are the notable trends driving market growth?
There is a notable trend towards integrating renewable energy sources. such as offshore wind and solar power. into existing power grids. Submarine power cables play a crucial role in this integration by connecting remote renewable energy sites to onshore grids.
7. Are there any restraints impacting market growth?
The deployment and maintenance of submarine power cables involve substantial financial investments. The complex installation procedures. specialized equipment requirements. and the need for expert personnel contribute to these high costs..
8. Can you provide examples of recent developments in the market?
In November 2022, South Korea's leading cable manufacturer, LS Cable & System Ltd., became the largest shareholder of KT Submarine Co., a company specializing in undersea cable construction. This strategic investment aimed to strengthen LS Cable's position in the submarine cable market and expand its capabilities in undersea cable projects.
9. What pricing options are available for accessing the report?
Pricing options include single-user, multi-user, and enterprise licenses priced at USD 4750, USD 5250, and USD 8750 respectively.
10. Is the market size provided in terms of value or volume?
The market size is provided in terms of value, measured in Million.
11. Are there any specific market keywords associated with the report?
Yes, the market keyword associated with the report is "Submarine Power Cable Industry," which aids in identifying and referencing the specific market segment covered.
12. How do I determine which pricing option suits my needs best?
The pricing options vary based on user requirements and access needs. Individual users may opt for single-user licenses, while businesses requiring broader access may choose multi-user or enterprise licenses for cost-effective access to the report.
13. Are there any additional resources or data provided in the Submarine Power Cable Industry report?
While the report offers comprehensive insights, it's advisable to review the specific contents or supplementary materials provided to ascertain if additional resources or data are available.
14. How can I stay updated on further developments or reports in the Submarine Power Cable Industry?
To stay informed about further developments, trends, and reports in the Submarine Power Cable Industry, consider subscribing to industry newsletters, following relevant companies and organizations, or regularly checking reputable industry news sources and publications.
Methodology
Step 1 - Identification of Relevant Samples Size from Population Database


Step 2 - Approaches for Defining Global Market Size (Value, Volume* & Price*)

Note*: In applicable scenarios
Step 3 - Data Sources
Primary Research
- Web Analytics
- Survey Reports
- Research Institute
- Latest Research Reports
- Opinion Leaders
Secondary Research
- Annual Reports
- White Paper
- Latest Press Release
- Industry Association
- Paid Database
- Investor Presentations

Step 4 - Data Triangulation
Involves using different sources of information in order to increase the validity of a study
These sources are likely to be stakeholders in a program - participants, other researchers, program staff, other community members, and so on.
Then we put all data in single framework & apply various statistical tools to find out the dynamic on the market.
During the analysis stage, feedback from the stakeholder groups would be compared to determine areas of agreement as well as areas of divergence
