

Key Insights
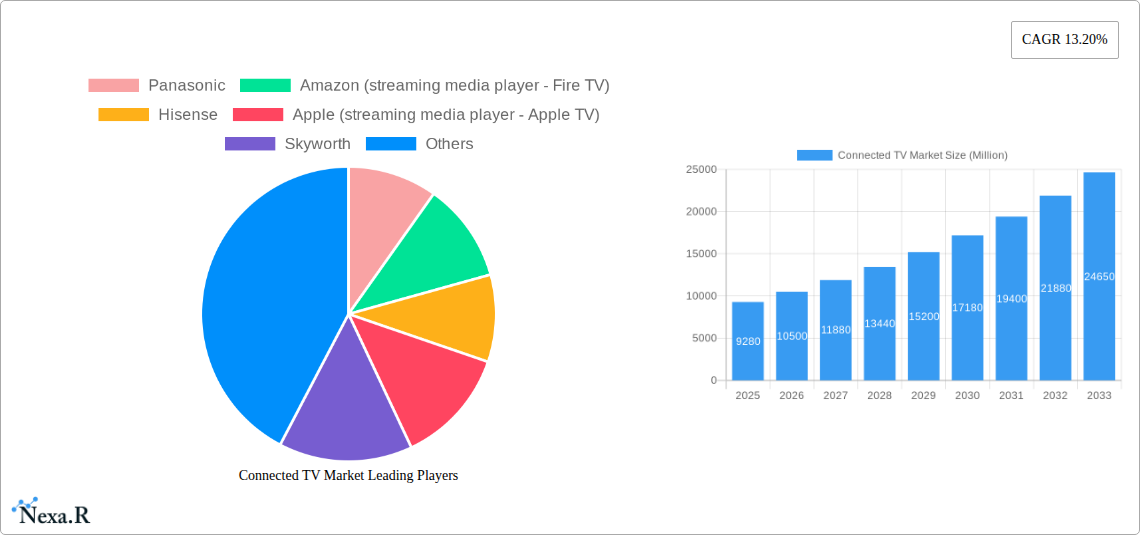
The Connected TV (CTV) market is experiencing robust growth, projected to reach a market size of $9.28 billion in 2025, exhibiting a Compound Annual Growth Rate (CAGR) of 13.20%. This expansion is fueled by several key drivers. The increasing adoption of streaming services and the rising demand for high-resolution viewing experiences (4K, 8K) are significantly boosting market growth. Consumers are increasingly cutting the cord, opting for more affordable and flexible streaming options delivered via Smart TVs and streaming media players. Technological advancements, such as improved internet speeds and the development of more sophisticated streaming platforms, further contribute to this expansion. The diverse range of content available on streaming platforms, encompassing both live and on-demand programming, caters to a broad spectrum of viewer preferences, solidifying the appeal of CTV. Competition among manufacturers like Samsung, LG, Sony, Amazon, Roku, and Google is driving innovation and affordability, making CTV accessible to a wider consumer base. Geographic expansion, particularly within rapidly developing economies in Asia-Pacific and Latin America, also presents substantial growth opportunities.
However, the market faces certain restraints. The high initial cost of purchasing premium Smart TVs with advanced features like 8K resolution could limit penetration in certain market segments. Concerns regarding data privacy and security within the CTV ecosystem are also significant factors influencing consumer behavior. Further, the market's growth is intrinsically linked to the broader evolution of internet infrastructure, with areas lacking reliable high-speed internet access posing a limitation. Despite these challenges, the long-term outlook for the CTV market remains positive, driven by continuous technological innovation, evolving consumer preferences towards streaming, and the expanding availability of high-quality content. The market is expected to demonstrate sustained growth throughout the forecast period (2025-2033), propelled by the continuous integration of advanced features into Smart TVs and streaming devices.
Connected TV Market: A Comprehensive Report (2019-2033)
This in-depth report provides a comprehensive analysis of the Connected TV market, encompassing market dynamics, growth trends, regional dominance, product landscape, key players, and future outlook. The study period covers 2019-2033, with 2025 as the base and estimated year. This report is crucial for industry professionals, investors, and strategists seeking to understand and capitalize on the evolving landscape of this dynamic market. The report analyzes both parent markets (Connected TVs) and child markets (Smart TVs and Streaming Media Players) to provide a holistic perspective.
Connected TV Market Dynamics & Structure
The Connected TV market is characterized by high competition among established players and emerging entrants. Market concentration is moderate, with several key players holding significant market share, while numerous smaller players compete in niche segments. Technological innovation, particularly in display resolution (4K, 8K, etc.) and streaming capabilities, is a major growth driver. Regulatory frameworks concerning data privacy and content licensing play a significant role in shaping market dynamics. The rise of streaming services and the decline of traditional cable TV represent significant competitive product substitutes. End-user demographics are shifting towards younger audiences, influencing content consumption patterns and product preferences. M&A activity is moderate, with strategic acquisitions aimed at expanding product portfolios and enhancing technological capabilities. Over the period 2020-2024, we estimate xx M&A deals occurred in the Connected TV market, with a total value of xx million USD.
- Market Concentration: Moderate, with top 5 players holding approximately xx% market share in 2024.
- Technological Innovation: Key drivers include advancements in display technologies (Mini-LED, OLED, QLED), increased processing power, and improved streaming capabilities.
- Regulatory Frameworks: Data privacy regulations and content licensing agreements significantly influence market operations.
- Competitive Substitutes: Streaming services and online content platforms pose significant competition to traditional cable TV.
- End-User Demographics: Shifting towards younger, digitally native consumers who prefer on-demand content.
- M&A Trends: Strategic acquisitions focused on technological integration and market expansion.
Connected TV Market Growth Trends & Insights
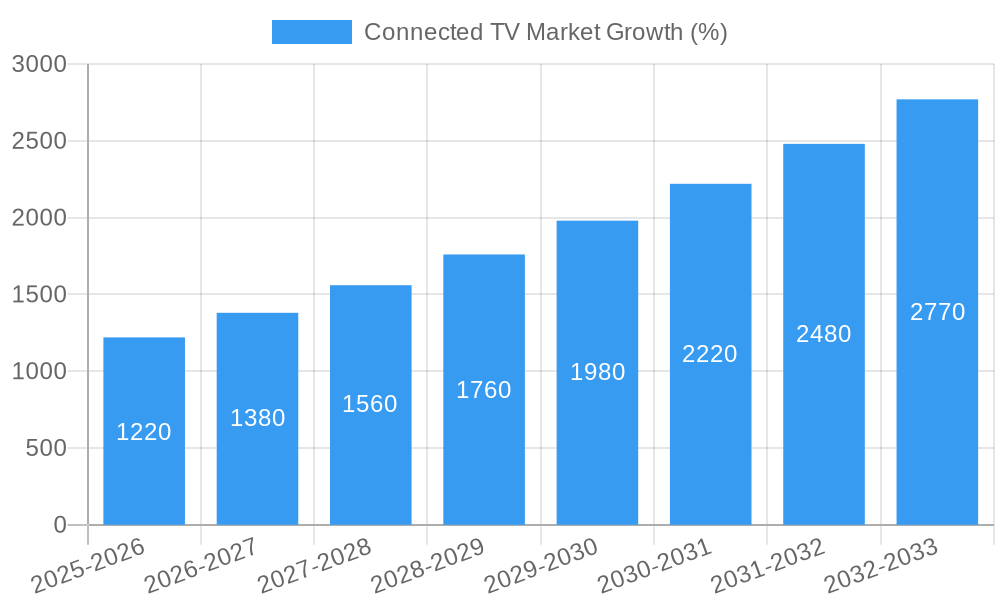
The Connected TV market experienced substantial growth during the historical period (2019-2024), driven by factors such as rising disposable incomes, increasing internet penetration, and the proliferation of streaming services. The market size expanded from xx million units in 2019 to xx million units in 2024, registering a Compound Annual Growth Rate (CAGR) of xx%. Adoption rates are particularly high in developed economies, with market penetration exceeding xx% in several regions. Technological disruptions, such as the introduction of 8K resolution TVs and advancements in HDR technology, have further accelerated market expansion. Consumer behavior is shifting towards personalized content consumption, fueling demand for smart TVs and streaming media players. The forecast period (2025-2033) anticipates continued growth, albeit at a slightly moderated pace, driven by sustained demand from developing economies and ongoing technological innovation. We project a CAGR of xx% for the forecast period, resulting in a market size of xx million units by 2033.
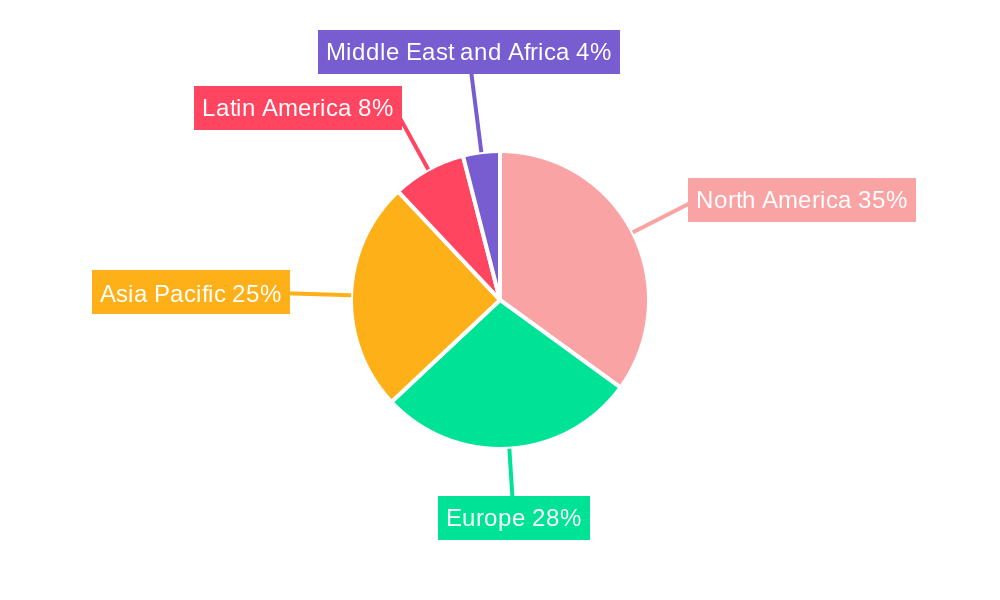
Dominant Regions, Countries, or Segments in Connected TV Market
North America and Asia-Pacific are the leading regions in the Connected TV market, driven by high internet penetration, strong consumer spending power, and significant technological advancements. Within these regions, countries like the United States, China, and Japan are key growth drivers. The Smart TV segment constitutes the largest portion of the Connected TV market, with xx million units shipped in 2024, representing xx% market share. Key shifts and trends in Smart TV resolution indicate a strong preference for 4K and Ultra HD, with 8K gradually gaining traction. The Streaming Media Player market is experiencing robust growth, with estimates indicating shipments of xx million units in 2020 increasing to xx million units in 2027.
- North America: High adoption rates, strong consumer spending, and early adoption of new technologies.
- Asia-Pacific: Rapid growth driven by rising disposable incomes, increasing internet penetration, and a large consumer base.
- Europe: Steady growth, driven by increasing demand for high-quality content and smart features.
- Smart TV Segment: Dominates the market with high adoption rates and continuous technological upgrades.
- Streaming Media Player Segment: Experiencing rapid growth, fuelled by the rise of streaming services and diverse content offerings.
Connected TV Market Product Landscape
The Connected TV market features a diverse range of products, including Smart TVs with varying screen sizes, resolutions (4K, 8K), and smart features, along with a wide array of Streaming Media Players offering diverse functionalities, operating systems, and content access options. Key product innovations include advancements in display technology (OLED, QLED, Mini-LED), improved processing power for smoother streaming experiences, and the integration of voice assistants and AI features for enhanced user experience. The unique selling propositions (USPs) of many products focus on superior picture quality, immersive sound, seamless user interfaces, and extensive content libraries.
Key Drivers, Barriers & Challenges in Connected TV Market
Key Drivers:
- Rising disposable incomes and increasing internet penetration globally.
- Growing popularity of streaming services and on-demand content.
- Advancements in display technologies (4K, 8K, HDR).
- Integration of smart features, voice assistants, and AI.
Challenges:
- Intense competition among manufacturers, leading to price wars and reduced profit margins.
- Supply chain disruptions impacting the availability of key components.
- Regulatory hurdles related to data privacy and content licensing.
- Concerns regarding energy consumption and environmental impact of manufacturing.
Emerging Opportunities in Connected TV Market
- Expansion into untapped markets in developing economies.
- Development of innovative applications like interactive gaming and immersive entertainment experiences.
- Integration of advanced features like personalized content recommendations and improved user interface designs.
- Growth of advertising-based video-on-demand (AVOD) platforms.
Growth Accelerators in the Connected TV Market Industry
The Connected TV market's long-term growth will be driven by several factors. Technological breakthroughs in display technologies, such as micro-LED and improved HDR, will continue to enhance the viewing experience. Strategic partnerships between content providers and device manufacturers will further expand content libraries and user engagement. Market expansion into emerging economies with growing internet penetration will unlock significant growth opportunities. Finally, the development and adoption of innovative features, like advanced AI-powered functionalities, will create new value propositions and attract a wider user base.
Key Players Shaping the Connected TV Market Market
- Panasonic
- Amazon (streaming media player - Fire TV)
- Hisense
- Apple (streaming media player - Apple TV)
- Skyworth
- Google (Chromecast)
- Sharp Electronics
- Xiaomi Corporation
- TCL
- Haier Group
- Vizio Inc
- Roku (streaming media player - Roku)
- Samsung Corporation
- LG Electronics
- Sony Corporation
Notable Milestones in Connected TV Market Sector
- May 2023: Blaupunkt and Flipkart partnered to launch the 40-inch Android TV Sigma series, featuring a bezel-less design and enhanced features. This partnership expands Blaupunkt's market reach in India.
- May 2023: Hisense launched its ULED X and U8 TV products in the UAE, significantly boosting its brand awareness by 25 percentage points. This demonstrates successful market penetration and brand building strategies.
- November 2022: Samsung launched the Samsung Crystal 55AU7700 55-inch Ultra HD 4K Smart LED TV in India, reinforcing its presence in the growing Indian market.
In-Depth Connected TV Market Market Outlook
The future of the Connected TV market is bright, with continued growth driven by technological advancements, expanding content libraries, and increasing internet penetration globally. Strategic opportunities exist for manufacturers to innovate in display technology, user interface design, and content integration. Companies that can successfully leverage AI and personalized content recommendations will gain a competitive advantage. The market is poised for continued expansion, driven by both established players and innovative startups entering the space, creating a dynamic and evolving landscape with significant potential for growth and innovation.
Connected TV Market Segmentation
-
1. Device
-
1.1. Smart TV
- 1.1.1. Smart TV
- 1.1.2. Smart TV
- 1.1.3. Key shif
- 1.2. Streamin
-
1.1. Smart TV
Connected TV Market Segmentation By Geography
-
1. North America
- 1.1. United States
- 1.2. Canada
-
2. Europe
- 2.1. United Kingdom
- 2.2. Germany
- 2.3. France
-
3. Asia
- 3.1. China
- 3.2. India
- 3.3. Japan
- 3.4. Australia and New Zealand
- 4. Latin America
- 5. Middle East and Africa
Connected TV Market REPORT HIGHLIGHTS
| Aspects | Details |
|---|---|
| Study Period | 2019-2033 |
| Base Year | 2024 |
| Estimated Year | 2025 |
| Forecast Period | 2025-2033 |
| Historical Period | 2019-2024 |
| Growth Rate | CAGR of 13.20% from 2019-2033 |
| Segmentation |
|
Table of Contents
- 1. Introduction
- 1.1. Research Scope
- 1.2. Market Segmentation
- 1.3. Research Methodology
- 1.4. Definitions and Assumptions
- 2. Executive Summary
- 2.1. Introduction
- 3. Market Dynamics
- 3.1. Introduction
- 3.2. Market Drivers
- 3.2.1. Growing internet penetration and anticipated shift from conventional TVs; Industry collaborations and favorable market conditions (shift from internet TV to smart TV)
- 3.3. Market Restrains
- 3.3.1. The Need for High Investment in Content Creation and Broadcasting; Bandwidth Allocation for 4K Resolution
- 3.4. Market Trends
- 3.4.1. Smart TV Accounts for the Largest Market Share
- 4. Market Factor Analysis
- 4.1. Porters Five Forces
- 4.2. Supply/Value Chain
- 4.3. PESTEL analysis
- 4.4. Market Entropy
- 4.5. Patent/Trademark Analysis
- 5. Global Connected TV Market Analysis, Insights and Forecast, 2019-2031
- 5.1. Market Analysis, Insights and Forecast - by Device
- 5.1.1. Smart TV
- 5.1.1.1. Smart TV
- 5.1.1.2. Smart TV
- 5.1.1.3. Key shif
- 5.1.2. Streamin
- 5.1.1. Smart TV
- 5.2. Market Analysis, Insights and Forecast - by Region
- 5.2.1. North America
- 5.2.2. Europe
- 5.2.3. Asia
- 5.2.4. Latin America
- 5.2.5. Middle East and Africa
- 5.1. Market Analysis, Insights and Forecast - by Device
- 6. North America Connected TV Market Analysis, Insights and Forecast, 2019-2031
- 6.1. Market Analysis, Insights and Forecast - by Device
- 6.1.1. Smart TV
- 6.1.1.1. Smart TV
- 6.1.1.2. Smart TV
- 6.1.1.3. Key shif
- 6.1.2. Streamin
- 6.1.1. Smart TV
- 6.1. Market Analysis, Insights and Forecast - by Device
- 7. Europe Connected TV Market Analysis, Insights and Forecast, 2019-2031
- 7.1. Market Analysis, Insights and Forecast - by Device
- 7.1.1. Smart TV
- 7.1.1.1. Smart TV
- 7.1.1.2. Smart TV
- 7.1.1.3. Key shif
- 7.1.2. Streamin
- 7.1.1. Smart TV
- 7.1. Market Analysis, Insights and Forecast - by Device
- 8. Asia Connected TV Market Analysis, Insights and Forecast, 2019-2031
- 8.1. Market Analysis, Insights and Forecast - by Device
- 8.1.1. Smart TV
- 8.1.1.1. Smart TV
- 8.1.1.2. Smart TV
- 8.1.1.3. Key shif
- 8.1.2. Streamin
- 8.1.1. Smart TV
- 8.1. Market Analysis, Insights and Forecast - by Device
- 9. Latin America Connected TV Market Analysis, Insights and Forecast, 2019-2031
- 9.1. Market Analysis, Insights and Forecast - by Device
- 9.1.1. Smart TV
- 9.1.1.1. Smart TV
- 9.1.1.2. Smart TV
- 9.1.1.3. Key shif
- 9.1.2. Streamin
- 9.1.1. Smart TV
- 9.1. Market Analysis, Insights and Forecast - by Device
- 10. Middle East and Africa Connected TV Market Analysis, Insights and Forecast, 2019-2031
- 10.1. Market Analysis, Insights and Forecast - by Device
- 10.1.1. Smart TV
- 10.1.1.1. Smart TV
- 10.1.1.2. Smart TV
- 10.1.1.3. Key shif
- 10.1.2. Streamin
- 10.1.1. Smart TV
- 10.1. Market Analysis, Insights and Forecast - by Device
- 11. North America Connected TV Market Analysis, Insights and Forecast, 2019-2031
- 11.1. Market Analysis, Insights and Forecast - By Country/Sub-region
- 11.1.1 United States
- 11.1.2 Canada
- 12. Europe Connected TV Market Analysis, Insights and Forecast, 2019-2031
- 12.1. Market Analysis, Insights and Forecast - By Country/Sub-region
- 12.1.1 United Kingdom
- 12.1.2 Germany
- 12.1.3 France
- 12.1.4 Rest of Europe
- 13. Asia Pacific Connected TV Market Analysis, Insights and Forecast, 2019-2031
- 13.1. Market Analysis, Insights and Forecast - By Country/Sub-region
- 13.1.1 China
- 13.1.2 India
- 13.1.3 Japan
- 13.1.4 Rest of Asia Pacific
- 14. Latin America Connected TV Market Analysis, Insights and Forecast, 2019-2031
- 14.1. Market Analysis, Insights and Forecast - By Country/Sub-region
- 14.1.1.
- 15. Middle East and Africa Connected TV Market Analysis, Insights and Forecast, 2019-2031
- 15.1. Market Analysis, Insights and Forecast - By Country/Sub-region
- 15.1.1.
- 16. Competitive Analysis
- 16.1. Global Market Share Analysis 2024
- 16.2. Company Profiles
- 16.2.1 Panasonic
- 16.2.1.1. Overview
- 16.2.1.2. Products
- 16.2.1.3. SWOT Analysis
- 16.2.1.4. Recent Developments
- 16.2.1.5. Financials (Based on Availability)
- 16.2.2 Amazon (streaming media player - Fire TV)
- 16.2.2.1. Overview
- 16.2.2.2. Products
- 16.2.2.3. SWOT Analysis
- 16.2.2.4. Recent Developments
- 16.2.2.5. Financials (Based on Availability)
- 16.2.3 Hisense
- 16.2.3.1. Overview
- 16.2.3.2. Products
- 16.2.3.3. SWOT Analysis
- 16.2.3.4. Recent Developments
- 16.2.3.5. Financials (Based on Availability)
- 16.2.4 Apple (streaming media player - Apple TV)
- 16.2.4.1. Overview
- 16.2.4.2. Products
- 16.2.4.3. SWOT Analysis
- 16.2.4.4. Recent Developments
- 16.2.4.5. Financials (Based on Availability)
- 16.2.5 Skyworth
- 16.2.5.1. Overview
- 16.2.5.2. Products
- 16.2.5.3. SWOT Analysis
- 16.2.5.4. Recent Developments
- 16.2.5.5. Financials (Based on Availability)
- 16.2.6 Google (Chromecast)*List Not Exhaustive
- 16.2.6.1. Overview
- 16.2.6.2. Products
- 16.2.6.3. SWOT Analysis
- 16.2.6.4. Recent Developments
- 16.2.6.5. Financials (Based on Availability)
- 16.2.7 Sharp Electronics
- 16.2.7.1. Overview
- 16.2.7.2. Products
- 16.2.7.3. SWOT Analysis
- 16.2.7.4. Recent Developments
- 16.2.7.5. Financials (Based on Availability)
- 16.2.8 Xiaomi Corporation
- 16.2.8.1. Overview
- 16.2.8.2. Products
- 16.2.8.3. SWOT Analysis
- 16.2.8.4. Recent Developments
- 16.2.8.5. Financials (Based on Availability)
- 16.2.9 TCL
- 16.2.9.1. Overview
- 16.2.9.2. Products
- 16.2.9.3. SWOT Analysis
- 16.2.9.4. Recent Developments
- 16.2.9.5. Financials (Based on Availability)
- 16.2.10 Haier Group
- 16.2.10.1. Overview
- 16.2.10.2. Products
- 16.2.10.3. SWOT Analysis
- 16.2.10.4. Recent Developments
- 16.2.10.5. Financials (Based on Availability)
- 16.2.11 Vizio Inc
- 16.2.11.1. Overview
- 16.2.11.2. Products
- 16.2.11.3. SWOT Analysis
- 16.2.11.4. Recent Developments
- 16.2.11.5. Financials (Based on Availability)
- 16.2.12 Roku (streaming media player - Roku)
- 16.2.12.1. Overview
- 16.2.12.2. Products
- 16.2.12.3. SWOT Analysis
- 16.2.12.4. Recent Developments
- 16.2.12.5. Financials (Based on Availability)
- 16.2.13 Samsung Corporation
- 16.2.13.1. Overview
- 16.2.13.2. Products
- 16.2.13.3. SWOT Analysis
- 16.2.13.4. Recent Developments
- 16.2.13.5. Financials (Based on Availability)
- 16.2.14 LG Electronics
- 16.2.14.1. Overview
- 16.2.14.2. Products
- 16.2.14.3. SWOT Analysis
- 16.2.14.4. Recent Developments
- 16.2.14.5. Financials (Based on Availability)
- 16.2.15 Sony Corporation
- 16.2.15.1. Overview
- 16.2.15.2. Products
- 16.2.15.3. SWOT Analysis
- 16.2.15.4. Recent Developments
- 16.2.15.5. Financials (Based on Availability)
- 16.2.1 Panasonic
List of Figures
- Figure 1: Global Connected TV Market Revenue Breakdown (Million, %) by Region 2024 & 2032
- Figure 2: North America Connected TV Market Revenue (Million), by Country 2024 & 2032
- Figure 3: North America Connected TV Market Revenue Share (%), by Country 2024 & 2032
- Figure 4: Europe Connected TV Market Revenue (Million), by Country 2024 & 2032
- Figure 5: Europe Connected TV Market Revenue Share (%), by Country 2024 & 2032
- Figure 6: Asia Pacific Connected TV Market Revenue (Million), by Country 2024 & 2032
- Figure 7: Asia Pacific Connected TV Market Revenue Share (%), by Country 2024 & 2032
- Figure 8: Latin America Connected TV Market Revenue (Million), by Country 2024 & 2032
- Figure 9: Latin America Connected TV Market Revenue Share (%), by Country 2024 & 2032
- Figure 10: Middle East and Africa Connected TV Market Revenue (Million), by Country 2024 & 2032
- Figure 11: Middle East and Africa Connected TV Market Revenue Share (%), by Country 2024 & 2032
- Figure 12: North America Connected TV Market Revenue (Million), by Device 2024 & 2032
- Figure 13: North America Connected TV Market Revenue Share (%), by Device 2024 & 2032
- Figure 14: North America Connected TV Market Revenue (Million), by Country 2024 & 2032
- Figure 15: North America Connected TV Market Revenue Share (%), by Country 2024 & 2032
- Figure 16: Europe Connected TV Market Revenue (Million), by Device 2024 & 2032
- Figure 17: Europe Connected TV Market Revenue Share (%), by Device 2024 & 2032
- Figure 18: Europe Connected TV Market Revenue (Million), by Country 2024 & 2032
- Figure 19: Europe Connected TV Market Revenue Share (%), by Country 2024 & 2032
- Figure 20: Asia Connected TV Market Revenue (Million), by Device 2024 & 2032
- Figure 21: Asia Connected TV Market Revenue Share (%), by Device 2024 & 2032
- Figure 22: Asia Connected TV Market Revenue (Million), by Country 2024 & 2032
- Figure 23: Asia Connected TV Market Revenue Share (%), by Country 2024 & 2032
- Figure 24: Latin America Connected TV Market Revenue (Million), by Device 2024 & 2032
- Figure 25: Latin America Connected TV Market Revenue Share (%), by Device 2024 & 2032
- Figure 26: Latin America Connected TV Market Revenue (Million), by Country 2024 & 2032
- Figure 27: Latin America Connected TV Market Revenue Share (%), by Country 2024 & 2032
- Figure 28: Middle East and Africa Connected TV Market Revenue (Million), by Device 2024 & 2032
- Figure 29: Middle East and Africa Connected TV Market Revenue Share (%), by Device 2024 & 2032
- Figure 30: Middle East and Africa Connected TV Market Revenue (Million), by Country 2024 & 2032
- Figure 31: Middle East and Africa Connected TV Market Revenue Share (%), by Country 2024 & 2032
List of Tables
- Table 1: Global Connected TV Market Revenue Million Forecast, by Region 2019 & 2032
- Table 2: Global Connected TV Market Revenue Million Forecast, by Device 2019 & 2032
- Table 3: Global Connected TV Market Revenue Million Forecast, by Region 2019 & 2032
- Table 4: Global Connected TV Market Revenue Million Forecast, by Country 2019 & 2032
- Table 5: United States Connected TV Market Revenue (Million) Forecast, by Application 2019 & 2032
- Table 6: Canada Connected TV Market Revenue (Million) Forecast, by Application 2019 & 2032
- Table 7: Global Connected TV Market Revenue Million Forecast, by Country 2019 & 2032
- Table 8: United Kingdom Connected TV Market Revenue (Million) Forecast, by Application 2019 & 2032
- Table 9: Germany Connected TV Market Revenue (Million) Forecast, by Application 2019 & 2032
- Table 10: France Connected TV Market Revenue (Million) Forecast, by Application 2019 & 2032
- Table 11: Rest of Europe Connected TV Market Revenue (Million) Forecast, by Application 2019 & 2032
- Table 12: Global Connected TV Market Revenue Million Forecast, by Country 2019 & 2032
- Table 13: China Connected TV Market Revenue (Million) Forecast, by Application 2019 & 2032
- Table 14: India Connected TV Market Revenue (Million) Forecast, by Application 2019 & 2032
- Table 15: Japan Connected TV Market Revenue (Million) Forecast, by Application 2019 & 2032
- Table 16: Rest of Asia Pacific Connected TV Market Revenue (Million) Forecast, by Application 2019 & 2032
- Table 17: Global Connected TV Market Revenue Million Forecast, by Country 2019 & 2032
- Table 18: Connected TV Market Revenue (Million) Forecast, by Application 2019 & 2032
- Table 19: Global Connected TV Market Revenue Million Forecast, by Country 2019 & 2032
- Table 20: Connected TV Market Revenue (Million) Forecast, by Application 2019 & 2032
- Table 21: Global Connected TV Market Revenue Million Forecast, by Device 2019 & 2032
- Table 22: Global Connected TV Market Revenue Million Forecast, by Country 2019 & 2032
- Table 23: United States Connected TV Market Revenue (Million) Forecast, by Application 2019 & 2032
- Table 24: Canada Connected TV Market Revenue (Million) Forecast, by Application 2019 & 2032
- Table 25: Global Connected TV Market Revenue Million Forecast, by Device 2019 & 2032
- Table 26: Global Connected TV Market Revenue Million Forecast, by Country 2019 & 2032
- Table 27: United Kingdom Connected TV Market Revenue (Million) Forecast, by Application 2019 & 2032
- Table 28: Germany Connected TV Market Revenue (Million) Forecast, by Application 2019 & 2032
- Table 29: France Connected TV Market Revenue (Million) Forecast, by Application 2019 & 2032
- Table 30: Global Connected TV Market Revenue Million Forecast, by Device 2019 & 2032
- Table 31: Global Connected TV Market Revenue Million Forecast, by Country 2019 & 2032
- Table 32: China Connected TV Market Revenue (Million) Forecast, by Application 2019 & 2032
- Table 33: India Connected TV Market Revenue (Million) Forecast, by Application 2019 & 2032
- Table 34: Japan Connected TV Market Revenue (Million) Forecast, by Application 2019 & 2032
- Table 35: Australia and New Zealand Connected TV Market Revenue (Million) Forecast, by Application 2019 & 2032
- Table 36: Global Connected TV Market Revenue Million Forecast, by Device 2019 & 2032
- Table 37: Global Connected TV Market Revenue Million Forecast, by Country 2019 & 2032
- Table 38: Global Connected TV Market Revenue Million Forecast, by Device 2019 & 2032
- Table 39: Global Connected TV Market Revenue Million Forecast, by Country 2019 & 2032
Frequently Asked Questions
1. What is the projected Compound Annual Growth Rate (CAGR) of the Connected TV Market?
The projected CAGR is approximately 13.20%.
2. Which companies are prominent players in the Connected TV Market?
Key companies in the market include Panasonic, Amazon (streaming media player - Fire TV), Hisense, Apple (streaming media player - Apple TV), Skyworth, Google (Chromecast)*List Not Exhaustive, Sharp Electronics, Xiaomi Corporation, TCL, Haier Group, Vizio Inc, Roku (streaming media player - Roku), Samsung Corporation, LG Electronics, Sony Corporation.
3. What are the main segments of the Connected TV Market?
The market segments include Device.
4. Can you provide details about the market size?
The market size is estimated to be USD 9.28 Million as of 2022.
5. What are some drivers contributing to market growth?
Growing internet penetration and anticipated shift from conventional TVs; Industry collaborations and favorable market conditions (shift from internet TV to smart TV).
6. What are the notable trends driving market growth?
Smart TV Accounts for the Largest Market Share.
7. Are there any restraints impacting market growth?
The Need for High Investment in Content Creation and Broadcasting; Bandwidth Allocation for 4K Resolution.
8. Can you provide examples of recent developments in the market?
May 2023: Blaupunkt and Flipkart announced a partnership to launch the 40-inch Android TV Sigma series. The new Blaupunkt Sigma Series Android TV has a bezel-less design, 512 MB RAM, 4 GB ROM, two bottom-firing built-in speakers with surround sound technology, and 3 HDMI and 2 USB ports.
9. What pricing options are available for accessing the report?
Pricing options include single-user, multi-user, and enterprise licenses priced at USD 4750, USD 5250, and USD 8750 respectively.
10. Is the market size provided in terms of value or volume?
The market size is provided in terms of value, measured in Million.
11. Are there any specific market keywords associated with the report?
Yes, the market keyword associated with the report is "Connected TV Market," which aids in identifying and referencing the specific market segment covered.
12. How do I determine which pricing option suits my needs best?
The pricing options vary based on user requirements and access needs. Individual users may opt for single-user licenses, while businesses requiring broader access may choose multi-user or enterprise licenses for cost-effective access to the report.
13. Are there any additional resources or data provided in the Connected TV Market report?
While the report offers comprehensive insights, it's advisable to review the specific contents or supplementary materials provided to ascertain if additional resources or data are available.
14. How can I stay updated on further developments or reports in the Connected TV Market?
To stay informed about further developments, trends, and reports in the Connected TV Market, consider subscribing to industry newsletters, following relevant companies and organizations, or regularly checking reputable industry news sources and publications.
Methodology
Step 1 - Identification of Relevant Samples Size from Population Database


Step 2 - Approaches for Defining Global Market Size (Value, Volume* & Price*)

Note*: In applicable scenarios
Step 3 - Data Sources
Primary Research
- Web Analytics
- Survey Reports
- Research Institute
- Latest Research Reports
- Opinion Leaders
Secondary Research
- Annual Reports
- White Paper
- Latest Press Release
- Industry Association
- Paid Database
- Investor Presentations

Step 4 - Data Triangulation
Involves using different sources of information in order to increase the validity of a study
These sources are likely to be stakeholders in a program - participants, other researchers, program staff, other community members, and so on.
Then we put all data in single framework & apply various statistical tools to find out the dynamic on the market.
During the analysis stage, feedback from the stakeholder groups would be compared to determine areas of agreement as well as areas of divergence
