

Key Insights
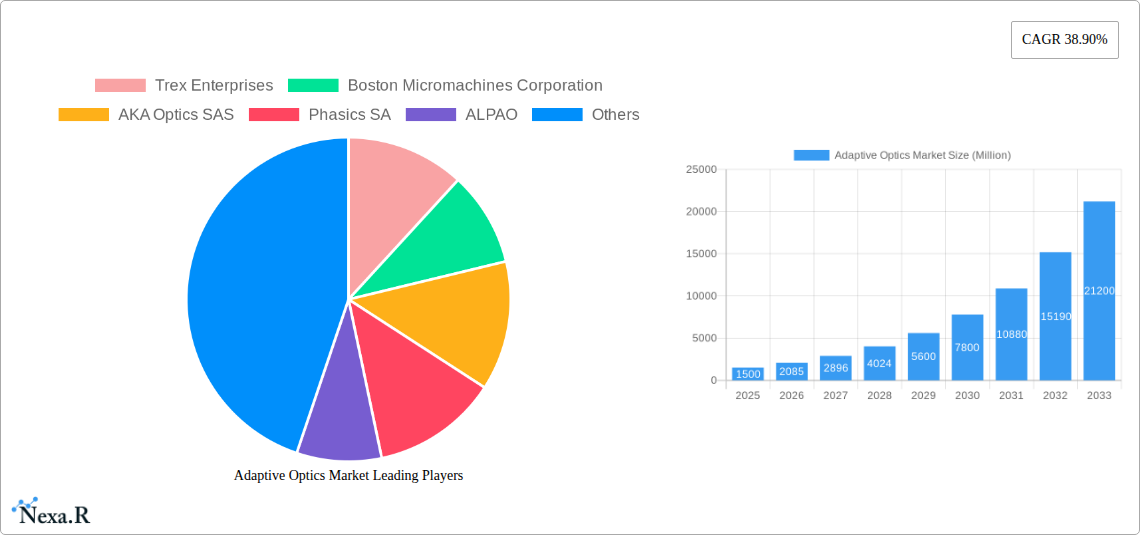
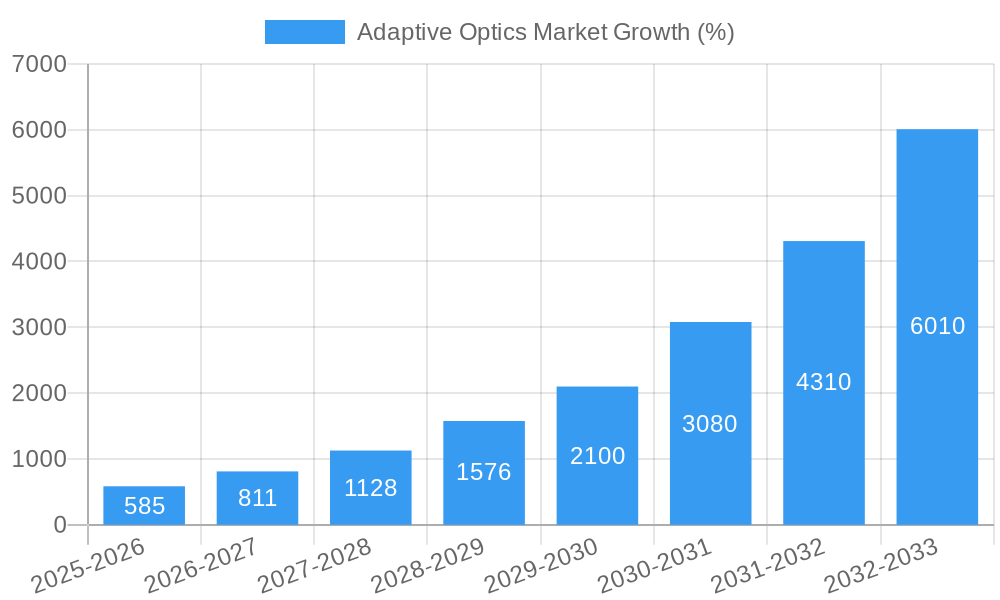
The Adaptive Optics market is experiencing robust growth, projected to reach a significant market size by 2033, driven by a remarkable Compound Annual Growth Rate (CAGR) of 38.90% from 2025 to 2033. This expansion is fueled by increasing demand across diverse sectors, primarily in military & defense, medical imaging, and astronomy. Technological advancements leading to improved image resolution and precision are key drivers. The integration of adaptive optics into laser-based systems for defense applications, coupled with the rising need for minimally invasive surgeries in the medical field, are significantly boosting market growth. Furthermore, the expanding consumer electronics sector, particularly in high-resolution displays and imaging devices, presents a considerable growth opportunity. However, the market faces challenges including the high cost of implementation and maintenance of adaptive optics systems, as well as technical complexities involved in designing and manufacturing these sophisticated devices. Nevertheless, ongoing research and development initiatives focused on cost-effective solutions and simplified system designs are likely to mitigate these restraints. The market segmentation by end-user industry highlights the significant contribution of military and defense applications, followed by the medical sector, which is expected to witness substantial growth due to ongoing technological innovations in ophthalmic imaging and microsurgery.
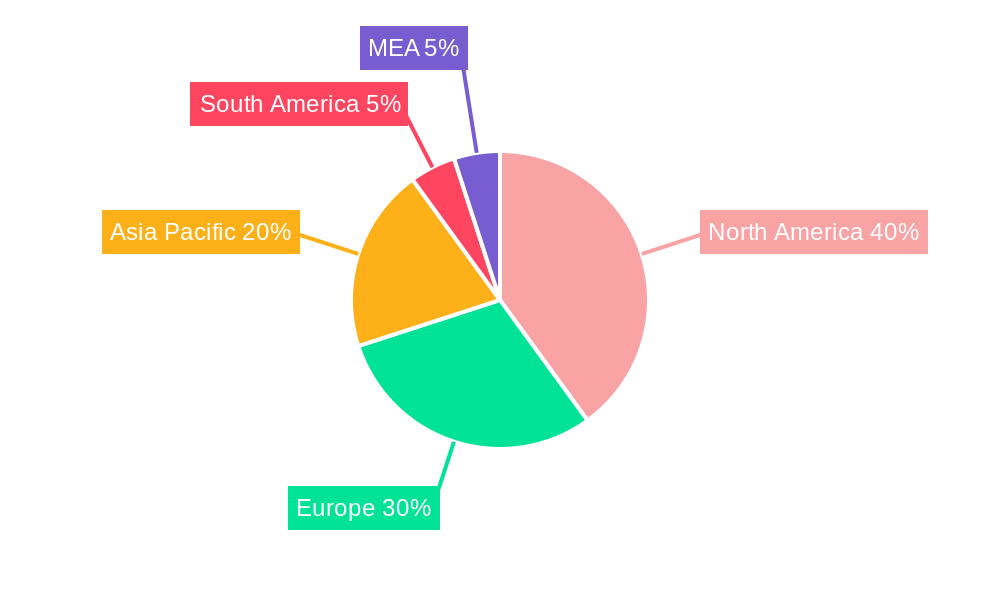
The regional analysis indicates a strong presence of the Adaptive Optics market across North America, Europe, and Asia Pacific. North America currently holds a significant market share, driven by robust technological advancements and high investments in research & development. However, the Asia Pacific region is anticipated to exhibit the fastest growth, fueled by increasing government investments in defense and technological advancements in emerging economies such as China, India, and South Korea. Europe maintains a strong position, with key players based in countries like Germany and France contributing substantially to the market's overall development. The competitive landscape is characterized by both established players and emerging companies vying for market share. This competition is stimulating innovation and driving down costs, which is expected to further enhance market penetration across various application areas. The forecast period of 2025-2033 promises further expansion, with the market poised to capitalize on emerging applications and technological breakthroughs.
Adaptive Optics Market Report: 2019-2033
This comprehensive report provides a detailed analysis of the Adaptive Optics Market, encompassing market dynamics, growth trends, regional analysis, product landscape, key players, and future outlook. The study period covers 2019-2033, with 2025 as the base and estimated year. The report offers invaluable insights for industry professionals, investors, and stakeholders seeking to understand and capitalize on the opportunities within this rapidly evolving market. The market size is projected to reach xx Million by 2033.
Adaptive Optics Market Dynamics & Structure
The Adaptive Optics market is characterized by moderate concentration, with key players holding significant market share. Technological innovation, particularly in areas like deformable mirrors and wavefront sensors, is a primary growth driver. Stringent regulatory frameworks in certain end-user industries (e.g., medical) influence market penetration. The market faces competition from alternative technologies, such as traditional optical systems, limiting adoption in price-sensitive sectors. End-user demographics are shifting towards increased adoption in the medical and astronomy sectors, driving future growth. Recent years have witnessed a moderate level of mergers and acquisitions (M&A) activity, indicating consolidation within the market.
- Market Concentration: Moderately concentrated, with top 5 players holding approximately xx% market share in 2025.
- Technological Innovation: Significant advancements in deformable mirror technology, wavefront sensing, and control algorithms are driving market expansion.
- Regulatory Landscape: Stringent regulations in medical and defense sectors impact market entry and growth, particularly in specific geographies.
- Competitive Substitutes: Traditional optical systems and alternative imaging techniques pose a competitive challenge.
- End-User Demographics: Growing demand from medical and astronomy sectors is driving market growth.
- M&A Activity: Moderate M&A activity observed, with approximately xx deals completed between 2019 and 2024.
Adaptive Optics Market Growth Trends & Insights
The Adaptive Optics market experienced steady growth during the historical period (2019-2024), with a CAGR of xx%. This growth is projected to accelerate during the forecast period (2025-2033), reaching a CAGR of xx%. Increased adoption rates across diverse end-user industries, particularly in medical imaging and astronomy, are key drivers. Technological disruptions, such as the development of more compact and cost-effective adaptive optics systems, are further fueling market expansion. Consumer behavior shifts, including a greater awareness of the benefits of high-resolution imaging, are also contributing factors. Market penetration is expected to increase significantly in emerging economies, driving future growth.
Dominant Regions, Countries, or Segments in Adaptive Optics Market
The North American region currently holds the largest market share in the Adaptive Optics market, driven by strong government funding in defense and astronomy, as well as a robust medical imaging sector. Within North America, the United States is the dominant country, benefitting from its large defense budget and active research and development initiatives. The European Union is another significant market, with strong presence in the medical and industrial sectors.
- Key Drivers (North America):
- High defense spending.
- Significant investments in astronomical research.
- Advanced medical imaging infrastructure.
- Key Drivers (European Union):
- Strong presence of technology-driven companies.
- Investments in medical device technology.
- Growing focus on industrial automation.
- Segment Dominance: The medical segment is projected to exhibit the highest growth rate among all end-user industries during the forecast period due to its extensive applications in ophthalmology, retinal imaging, and other areas, driven by increasing demand for precise and clear images.
Adaptive Optics Market Product Landscape
The Adaptive Optics market offers a range of products, including deformable mirrors, wavefront sensors, and control systems. Recent innovations have focused on miniaturization, improved performance, and reduced costs. These advancements have broadened the applications of adaptive optics, enabling its use in various fields. Unique selling propositions include enhanced image resolution, improved contrast, and correction of atmospheric distortions. Technological advancements are centered on developing more compact, robust, and cost-effective systems, particularly for applications outside of traditional high-end research settings.
Key Drivers, Barriers & Challenges in Adaptive Optics Market
Key Drivers:
- Technological advancements leading to improved performance and reduced costs.
- Increasing demand for high-resolution imaging across various industries.
- Government funding for research and development in defense and astronomy.
Key Challenges:
- High initial investment costs associated with adaptive optics systems.
- Complex integration and maintenance requirements.
- Competition from alternative technologies.
Emerging Opportunities in Adaptive Optics Market
Emerging opportunities lie in the expansion into untapped markets, such as consumer electronics and industrial automation. Innovative applications, such as augmented reality and virtual reality, are also creating new possibilities. Evolving consumer preferences, including a demand for better imaging quality in smartphones and other devices, further fuel market growth.
Growth Accelerators in the Adaptive Optics Market Industry
Technological breakthroughs in micro-optics and integrated photonics are accelerating market growth. Strategic partnerships between research institutions and commercial enterprises are fostering innovation and driving market expansion. The development of cost-effective and compact adaptive optics systems is expanding market reach, particularly in sectors with price-sensitive consumers.
Key Players Shaping the Adaptive Optics Market Market
- Trex Enterprises
- Boston Micromachines Corporation
- AKA Optics SAS
- Phasics SA
- ALPAO
- Imagine Optics Inc
- CILAS Ariane Group
- Iris AO Inc
- Thorlabs Inc
- Active Optical Systems
- Optos Plc
- Northrop Grumman Corporation
- Flexible Optical B V
Notable Milestones in Adaptive Optics Market Sector
- 2020: Launch of a new compact deformable mirror by Thorlabs Inc.
- 2021: Acquisition of Imagine Optics Inc. by a larger optics company.
- 2022: Significant investment in R&D by Northrop Grumman for defense applications.
In-Depth Adaptive Optics Market Market Outlook
The Adaptive Optics market is poised for continued growth, driven by technological innovation, increasing adoption in diverse sectors, and strategic partnerships. Future market potential is substantial, with significant opportunities for companies that can develop cost-effective, high-performance systems. Strategic focus should be placed on expanding into new markets, developing innovative applications, and fostering collaborations to accelerate market penetration.
Adaptive Optics Market Segmentation
-
1. End-user Industry
- 1.1. Military & Defence
- 1.2. Medical
- 1.3. Industrial
- 1.4. Consumer Electronics
- 1.5. Astronomy
- 1.6. Other End-user Industries
Adaptive Optics Market Segmentation By Geography
- 1. North America
- 2. Europe
- 3. Asia Pacific
- 4. Rest of the World
Adaptive Optics Market REPORT HIGHLIGHTS
| Aspects | Details |
|---|---|
| Study Period | 2019-2033 |
| Base Year | 2024 |
| Estimated Year | 2025 |
| Forecast Period | 2025-2033 |
| Historical Period | 2019-2024 |
| Growth Rate | CAGR of 38.90% from 2019-2033 |
| Segmentation |
|
Table of Contents
- 1. Introduction
- 1.1. Research Scope
- 1.2. Market Segmentation
- 1.3. Research Methodology
- 1.4. Definitions and Assumptions
- 2. Executive Summary
- 2.1. Introduction
- 3. Market Dynamics
- 3.1. Introduction
- 3.2. Market Drivers
- 3.2.1. ; Adoption of Adaptive Optics in Ophthalmology and Retinal Imaging; Increased Government Funding
- 3.3. Market Restrains
- 3.3.1. ; Complex Designing Techniques and High Initial Costs
- 3.4. Market Trends
- 3.4.1. Application in the Field of Astronomy is Expected to Grow Significantly
- 4. Market Factor Analysis
- 4.1. Porters Five Forces
- 4.2. Supply/Value Chain
- 4.3. PESTEL analysis
- 4.4. Market Entropy
- 4.5. Patent/Trademark Analysis
- 5. Global Adaptive Optics Market Analysis, Insights and Forecast, 2019-2031
- 5.1. Market Analysis, Insights and Forecast - by End-user Industry
- 5.1.1. Military & Defence
- 5.1.2. Medical
- 5.1.3. Industrial
- 5.1.4. Consumer Electronics
- 5.1.5. Astronomy
- 5.1.6. Other End-user Industries
- 5.2. Market Analysis, Insights and Forecast - by Region
- 5.2.1. North America
- 5.2.2. Europe
- 5.2.3. Asia Pacific
- 5.2.4. Rest of the World
- 5.1. Market Analysis, Insights and Forecast - by End-user Industry
- 6. North America Adaptive Optics Market Analysis, Insights and Forecast, 2019-2031
- 6.1. Market Analysis, Insights and Forecast - by End-user Industry
- 6.1.1. Military & Defence
- 6.1.2. Medical
- 6.1.3. Industrial
- 6.1.4. Consumer Electronics
- 6.1.5. Astronomy
- 6.1.6. Other End-user Industries
- 6.1. Market Analysis, Insights and Forecast - by End-user Industry
- 7. Europe Adaptive Optics Market Analysis, Insights and Forecast, 2019-2031
- 7.1. Market Analysis, Insights and Forecast - by End-user Industry
- 7.1.1. Military & Defence
- 7.1.2. Medical
- 7.1.3. Industrial
- 7.1.4. Consumer Electronics
- 7.1.5. Astronomy
- 7.1.6. Other End-user Industries
- 7.1. Market Analysis, Insights and Forecast - by End-user Industry
- 8. Asia Pacific Adaptive Optics Market Analysis, Insights and Forecast, 2019-2031
- 8.1. Market Analysis, Insights and Forecast - by End-user Industry
- 8.1.1. Military & Defence
- 8.1.2. Medical
- 8.1.3. Industrial
- 8.1.4. Consumer Electronics
- 8.1.5. Astronomy
- 8.1.6. Other End-user Industries
- 8.1. Market Analysis, Insights and Forecast - by End-user Industry
- 9. Rest of the World Adaptive Optics Market Analysis, Insights and Forecast, 2019-2031
- 9.1. Market Analysis, Insights and Forecast - by End-user Industry
- 9.1.1. Military & Defence
- 9.1.2. Medical
- 9.1.3. Industrial
- 9.1.4. Consumer Electronics
- 9.1.5. Astronomy
- 9.1.6. Other End-user Industries
- 9.1. Market Analysis, Insights and Forecast - by End-user Industry
- 10. North America Adaptive Optics Market Analysis, Insights and Forecast, 2019-2031
- 10.1. Market Analysis, Insights and Forecast - By Country/Sub-region
- 10.1.1 United States
- 10.1.2 Canada
- 10.1.3 Mexico
- 11. Europe Adaptive Optics Market Analysis, Insights and Forecast, 2019-2031
- 11.1. Market Analysis, Insights and Forecast - By Country/Sub-region
- 11.1.1 Germany
- 11.1.2 United Kingdom
- 11.1.3 France
- 11.1.4 Spain
- 11.1.5 Italy
- 11.1.6 Spain
- 11.1.7 Belgium
- 11.1.8 Netherland
- 11.1.9 Nordics
- 11.1.10 Rest of Europe
- 12. Asia Pacific Adaptive Optics Market Analysis, Insights and Forecast, 2019-2031
- 12.1. Market Analysis, Insights and Forecast - By Country/Sub-region
- 12.1.1 China
- 12.1.2 Japan
- 12.1.3 India
- 12.1.4 South Korea
- 12.1.5 Southeast Asia
- 12.1.6 Australia
- 12.1.7 Indonesia
- 12.1.8 Phillipes
- 12.1.9 Singapore
- 12.1.10 Thailandc
- 12.1.11 Rest of Asia Pacific
- 13. South America Adaptive Optics Market Analysis, Insights and Forecast, 2019-2031
- 13.1. Market Analysis, Insights and Forecast - By Country/Sub-region
- 13.1.1 Brazil
- 13.1.2 Argentina
- 13.1.3 Peru
- 13.1.4 Chile
- 13.1.5 Colombia
- 13.1.6 Ecuador
- 13.1.7 Venezuela
- 13.1.8 Rest of South America
- 14. North America Adaptive Optics Market Analysis, Insights and Forecast, 2019-2031
- 14.1. Market Analysis, Insights and Forecast - By Country/Sub-region
- 14.1.1 United States
- 14.1.2 Canada
- 14.1.3 Mexico
- 15. MEA Adaptive Optics Market Analysis, Insights and Forecast, 2019-2031
- 15.1. Market Analysis, Insights and Forecast - By Country/Sub-region
- 15.1.1 United Arab Emirates
- 15.1.2 Saudi Arabia
- 15.1.3 South Africa
- 15.1.4 Rest of Middle East and Africa
- 16. Competitive Analysis
- 16.1. Global Market Share Analysis 2024
- 16.2. Company Profiles
- 16.2.1 Trex Enterprises
- 16.2.1.1. Overview
- 16.2.1.2. Products
- 16.2.1.3. SWOT Analysis
- 16.2.1.4. Recent Developments
- 16.2.1.5. Financials (Based on Availability)
- 16.2.2 Boston Micromachines Corporation
- 16.2.2.1. Overview
- 16.2.2.2. Products
- 16.2.2.3. SWOT Analysis
- 16.2.2.4. Recent Developments
- 16.2.2.5. Financials (Based on Availability)
- 16.2.3 AKA Optics SAS
- 16.2.3.1. Overview
- 16.2.3.2. Products
- 16.2.3.3. SWOT Analysis
- 16.2.3.4. Recent Developments
- 16.2.3.5. Financials (Based on Availability)
- 16.2.4 Phasics SA
- 16.2.4.1. Overview
- 16.2.4.2. Products
- 16.2.4.3. SWOT Analysis
- 16.2.4.4. Recent Developments
- 16.2.4.5. Financials (Based on Availability)
- 16.2.5 ALPAO
- 16.2.5.1. Overview
- 16.2.5.2. Products
- 16.2.5.3. SWOT Analysis
- 16.2.5.4. Recent Developments
- 16.2.5.5. Financials (Based on Availability)
- 16.2.6 Imagine Optics Inc
- 16.2.6.1. Overview
- 16.2.6.2. Products
- 16.2.6.3. SWOT Analysis
- 16.2.6.4. Recent Developments
- 16.2.6.5. Financials (Based on Availability)
- 16.2.7 CILAS Ariane Group
- 16.2.7.1. Overview
- 16.2.7.2. Products
- 16.2.7.3. SWOT Analysis
- 16.2.7.4. Recent Developments
- 16.2.7.5. Financials (Based on Availability)
- 16.2.8 Iris AO Inc
- 16.2.8.1. Overview
- 16.2.8.2. Products
- 16.2.8.3. SWOT Analysis
- 16.2.8.4. Recent Developments
- 16.2.8.5. Financials (Based on Availability)
- 16.2.9 Thorlabs Inc
- 16.2.9.1. Overview
- 16.2.9.2. Products
- 16.2.9.3. SWOT Analysis
- 16.2.9.4. Recent Developments
- 16.2.9.5. Financials (Based on Availability)
- 16.2.10 Active Optical Systems
- 16.2.10.1. Overview
- 16.2.10.2. Products
- 16.2.10.3. SWOT Analysis
- 16.2.10.4. Recent Developments
- 16.2.10.5. Financials (Based on Availability)
- 16.2.11 Optos Plc
- 16.2.11.1. Overview
- 16.2.11.2. Products
- 16.2.11.3. SWOT Analysis
- 16.2.11.4. Recent Developments
- 16.2.11.5. Financials (Based on Availability)
- 16.2.12 Northrop Grumman Corporation
- 16.2.12.1. Overview
- 16.2.12.2. Products
- 16.2.12.3. SWOT Analysis
- 16.2.12.4. Recent Developments
- 16.2.12.5. Financials (Based on Availability)
- 16.2.13 Flexible Optical B V
- 16.2.13.1. Overview
- 16.2.13.2. Products
- 16.2.13.3. SWOT Analysis
- 16.2.13.4. Recent Developments
- 16.2.13.5. Financials (Based on Availability)
- 16.2.1 Trex Enterprises
List of Figures
- Figure 1: Global Adaptive Optics Market Revenue Breakdown (Million, %) by Region 2024 & 2032
- Figure 2: North America Adaptive Optics Market Revenue (Million), by Country 2024 & 2032
- Figure 3: North America Adaptive Optics Market Revenue Share (%), by Country 2024 & 2032
- Figure 4: Europe Adaptive Optics Market Revenue (Million), by Country 2024 & 2032
- Figure 5: Europe Adaptive Optics Market Revenue Share (%), by Country 2024 & 2032
- Figure 6: Asia Pacific Adaptive Optics Market Revenue (Million), by Country 2024 & 2032
- Figure 7: Asia Pacific Adaptive Optics Market Revenue Share (%), by Country 2024 & 2032
- Figure 8: South America Adaptive Optics Market Revenue (Million), by Country 2024 & 2032
- Figure 9: South America Adaptive Optics Market Revenue Share (%), by Country 2024 & 2032
- Figure 10: North America Adaptive Optics Market Revenue (Million), by Country 2024 & 2032
- Figure 11: North America Adaptive Optics Market Revenue Share (%), by Country 2024 & 2032
- Figure 12: MEA Adaptive Optics Market Revenue (Million), by Country 2024 & 2032
- Figure 13: MEA Adaptive Optics Market Revenue Share (%), by Country 2024 & 2032
- Figure 14: North America Adaptive Optics Market Revenue (Million), by End-user Industry 2024 & 2032
- Figure 15: North America Adaptive Optics Market Revenue Share (%), by End-user Industry 2024 & 2032
- Figure 16: North America Adaptive Optics Market Revenue (Million), by Country 2024 & 2032
- Figure 17: North America Adaptive Optics Market Revenue Share (%), by Country 2024 & 2032
- Figure 18: Europe Adaptive Optics Market Revenue (Million), by End-user Industry 2024 & 2032
- Figure 19: Europe Adaptive Optics Market Revenue Share (%), by End-user Industry 2024 & 2032
- Figure 20: Europe Adaptive Optics Market Revenue (Million), by Country 2024 & 2032
- Figure 21: Europe Adaptive Optics Market Revenue Share (%), by Country 2024 & 2032
- Figure 22: Asia Pacific Adaptive Optics Market Revenue (Million), by End-user Industry 2024 & 2032
- Figure 23: Asia Pacific Adaptive Optics Market Revenue Share (%), by End-user Industry 2024 & 2032
- Figure 24: Asia Pacific Adaptive Optics Market Revenue (Million), by Country 2024 & 2032
- Figure 25: Asia Pacific Adaptive Optics Market Revenue Share (%), by Country 2024 & 2032
- Figure 26: Rest of the World Adaptive Optics Market Revenue (Million), by End-user Industry 2024 & 2032
- Figure 27: Rest of the World Adaptive Optics Market Revenue Share (%), by End-user Industry 2024 & 2032
- Figure 28: Rest of the World Adaptive Optics Market Revenue (Million), by Country 2024 & 2032
- Figure 29: Rest of the World Adaptive Optics Market Revenue Share (%), by Country 2024 & 2032
List of Tables
- Table 1: Global Adaptive Optics Market Revenue Million Forecast, by Region 2019 & 2032
- Table 2: Global Adaptive Optics Market Revenue Million Forecast, by End-user Industry 2019 & 2032
- Table 3: Global Adaptive Optics Market Revenue Million Forecast, by Region 2019 & 2032
- Table 4: Global Adaptive Optics Market Revenue Million Forecast, by Country 2019 & 2032
- Table 5: United States Adaptive Optics Market Revenue (Million) Forecast, by Application 2019 & 2032
- Table 6: Canada Adaptive Optics Market Revenue (Million) Forecast, by Application 2019 & 2032
- Table 7: Mexico Adaptive Optics Market Revenue (Million) Forecast, by Application 2019 & 2032
- Table 8: Global Adaptive Optics Market Revenue Million Forecast, by Country 2019 & 2032
- Table 9: Germany Adaptive Optics Market Revenue (Million) Forecast, by Application 2019 & 2032
- Table 10: United Kingdom Adaptive Optics Market Revenue (Million) Forecast, by Application 2019 & 2032
- Table 11: France Adaptive Optics Market Revenue (Million) Forecast, by Application 2019 & 2032
- Table 12: Spain Adaptive Optics Market Revenue (Million) Forecast, by Application 2019 & 2032
- Table 13: Italy Adaptive Optics Market Revenue (Million) Forecast, by Application 2019 & 2032
- Table 14: Spain Adaptive Optics Market Revenue (Million) Forecast, by Application 2019 & 2032
- Table 15: Belgium Adaptive Optics Market Revenue (Million) Forecast, by Application 2019 & 2032
- Table 16: Netherland Adaptive Optics Market Revenue (Million) Forecast, by Application 2019 & 2032
- Table 17: Nordics Adaptive Optics Market Revenue (Million) Forecast, by Application 2019 & 2032
- Table 18: Rest of Europe Adaptive Optics Market Revenue (Million) Forecast, by Application 2019 & 2032
- Table 19: Global Adaptive Optics Market Revenue Million Forecast, by Country 2019 & 2032
- Table 20: China Adaptive Optics Market Revenue (Million) Forecast, by Application 2019 & 2032
- Table 21: Japan Adaptive Optics Market Revenue (Million) Forecast, by Application 2019 & 2032
- Table 22: India Adaptive Optics Market Revenue (Million) Forecast, by Application 2019 & 2032
- Table 23: South Korea Adaptive Optics Market Revenue (Million) Forecast, by Application 2019 & 2032
- Table 24: Southeast Asia Adaptive Optics Market Revenue (Million) Forecast, by Application 2019 & 2032
- Table 25: Australia Adaptive Optics Market Revenue (Million) Forecast, by Application 2019 & 2032
- Table 26: Indonesia Adaptive Optics Market Revenue (Million) Forecast, by Application 2019 & 2032
- Table 27: Phillipes Adaptive Optics Market Revenue (Million) Forecast, by Application 2019 & 2032
- Table 28: Singapore Adaptive Optics Market Revenue (Million) Forecast, by Application 2019 & 2032
- Table 29: Thailandc Adaptive Optics Market Revenue (Million) Forecast, by Application 2019 & 2032
- Table 30: Rest of Asia Pacific Adaptive Optics Market Revenue (Million) Forecast, by Application 2019 & 2032
- Table 31: Global Adaptive Optics Market Revenue Million Forecast, by Country 2019 & 2032
- Table 32: Brazil Adaptive Optics Market Revenue (Million) Forecast, by Application 2019 & 2032
- Table 33: Argentina Adaptive Optics Market Revenue (Million) Forecast, by Application 2019 & 2032
- Table 34: Peru Adaptive Optics Market Revenue (Million) Forecast, by Application 2019 & 2032
- Table 35: Chile Adaptive Optics Market Revenue (Million) Forecast, by Application 2019 & 2032
- Table 36: Colombia Adaptive Optics Market Revenue (Million) Forecast, by Application 2019 & 2032
- Table 37: Ecuador Adaptive Optics Market Revenue (Million) Forecast, by Application 2019 & 2032
- Table 38: Venezuela Adaptive Optics Market Revenue (Million) Forecast, by Application 2019 & 2032
- Table 39: Rest of South America Adaptive Optics Market Revenue (Million) Forecast, by Application 2019 & 2032
- Table 40: Global Adaptive Optics Market Revenue Million Forecast, by Country 2019 & 2032
- Table 41: United States Adaptive Optics Market Revenue (Million) Forecast, by Application 2019 & 2032
- Table 42: Canada Adaptive Optics Market Revenue (Million) Forecast, by Application 2019 & 2032
- Table 43: Mexico Adaptive Optics Market Revenue (Million) Forecast, by Application 2019 & 2032
- Table 44: Global Adaptive Optics Market Revenue Million Forecast, by Country 2019 & 2032
- Table 45: United Arab Emirates Adaptive Optics Market Revenue (Million) Forecast, by Application 2019 & 2032
- Table 46: Saudi Arabia Adaptive Optics Market Revenue (Million) Forecast, by Application 2019 & 2032
- Table 47: South Africa Adaptive Optics Market Revenue (Million) Forecast, by Application 2019 & 2032
- Table 48: Rest of Middle East and Africa Adaptive Optics Market Revenue (Million) Forecast, by Application 2019 & 2032
- Table 49: Global Adaptive Optics Market Revenue Million Forecast, by End-user Industry 2019 & 2032
- Table 50: Global Adaptive Optics Market Revenue Million Forecast, by Country 2019 & 2032
- Table 51: Global Adaptive Optics Market Revenue Million Forecast, by End-user Industry 2019 & 2032
- Table 52: Global Adaptive Optics Market Revenue Million Forecast, by Country 2019 & 2032
- Table 53: Global Adaptive Optics Market Revenue Million Forecast, by End-user Industry 2019 & 2032
- Table 54: Global Adaptive Optics Market Revenue Million Forecast, by Country 2019 & 2032
- Table 55: Global Adaptive Optics Market Revenue Million Forecast, by End-user Industry 2019 & 2032
- Table 56: Global Adaptive Optics Market Revenue Million Forecast, by Country 2019 & 2032
Frequently Asked Questions
1. What is the projected Compound Annual Growth Rate (CAGR) of the Adaptive Optics Market?
The projected CAGR is approximately 38.90%.
2. Which companies are prominent players in the Adaptive Optics Market?
Key companies in the market include Trex Enterprises, Boston Micromachines Corporation, AKA Optics SAS, Phasics SA, ALPAO, Imagine Optics Inc, CILAS Ariane Group, Iris AO Inc, Thorlabs Inc, Active Optical Systems, Optos Plc, Northrop Grumman Corporation, Flexible Optical B V.
3. What are the main segments of the Adaptive Optics Market?
The market segments include End-user Industry.
4. Can you provide details about the market size?
The market size is estimated to be USD XX Million as of 2022.
5. What are some drivers contributing to market growth?
; Adoption of Adaptive Optics in Ophthalmology and Retinal Imaging; Increased Government Funding.
6. What are the notable trends driving market growth?
Application in the Field of Astronomy is Expected to Grow Significantly.
7. Are there any restraints impacting market growth?
; Complex Designing Techniques and High Initial Costs.
8. Can you provide examples of recent developments in the market?
N/A
9. What pricing options are available for accessing the report?
Pricing options include single-user, multi-user, and enterprise licenses priced at USD 4750, USD 5250, and USD 8750 respectively.
10. Is the market size provided in terms of value or volume?
The market size is provided in terms of value, measured in Million.
11. Are there any specific market keywords associated with the report?
Yes, the market keyword associated with the report is "Adaptive Optics Market," which aids in identifying and referencing the specific market segment covered.
12. How do I determine which pricing option suits my needs best?
The pricing options vary based on user requirements and access needs. Individual users may opt for single-user licenses, while businesses requiring broader access may choose multi-user or enterprise licenses for cost-effective access to the report.
13. Are there any additional resources or data provided in the Adaptive Optics Market report?
While the report offers comprehensive insights, it's advisable to review the specific contents or supplementary materials provided to ascertain if additional resources or data are available.
14. How can I stay updated on further developments or reports in the Adaptive Optics Market?
To stay informed about further developments, trends, and reports in the Adaptive Optics Market, consider subscribing to industry newsletters, following relevant companies and organizations, or regularly checking reputable industry news sources and publications.
Methodology
Step 1 - Identification of Relevant Samples Size from Population Database


Step 2 - Approaches for Defining Global Market Size (Value, Volume* & Price*)

Note*: In applicable scenarios
Step 3 - Data Sources
Primary Research
- Web Analytics
- Survey Reports
- Research Institute
- Latest Research Reports
- Opinion Leaders
Secondary Research
- Annual Reports
- White Paper
- Latest Press Release
- Industry Association
- Paid Database
- Investor Presentations

Step 4 - Data Triangulation
Involves using different sources of information in order to increase the validity of a study
These sources are likely to be stakeholders in a program - participants, other researchers, program staff, other community members, and so on.
Then we put all data in single framework & apply various statistical tools to find out the dynamic on the market.
During the analysis stage, feedback from the stakeholder groups would be compared to determine areas of agreement as well as areas of divergence
