

Key Insights
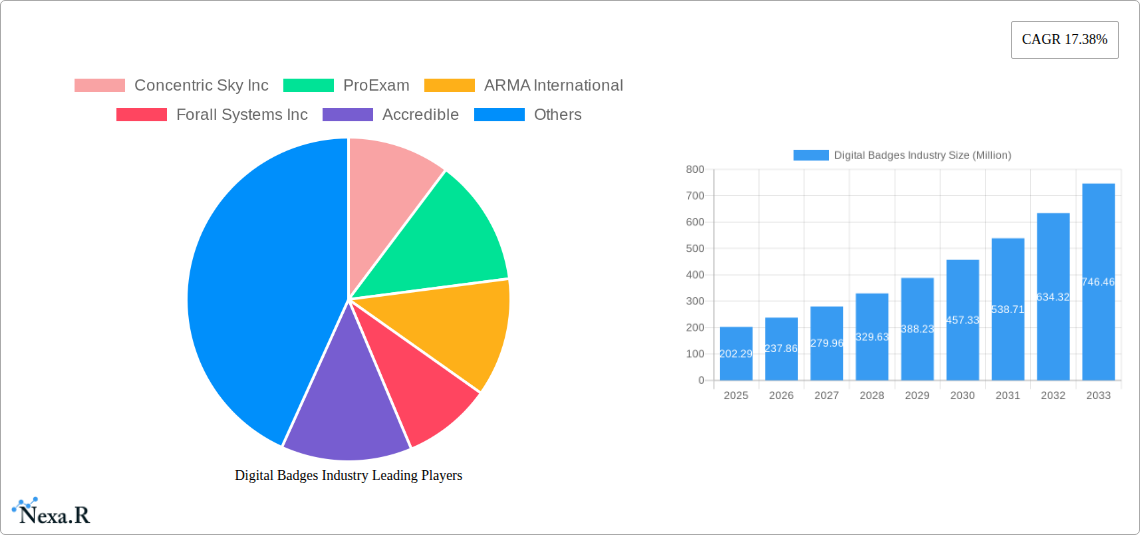
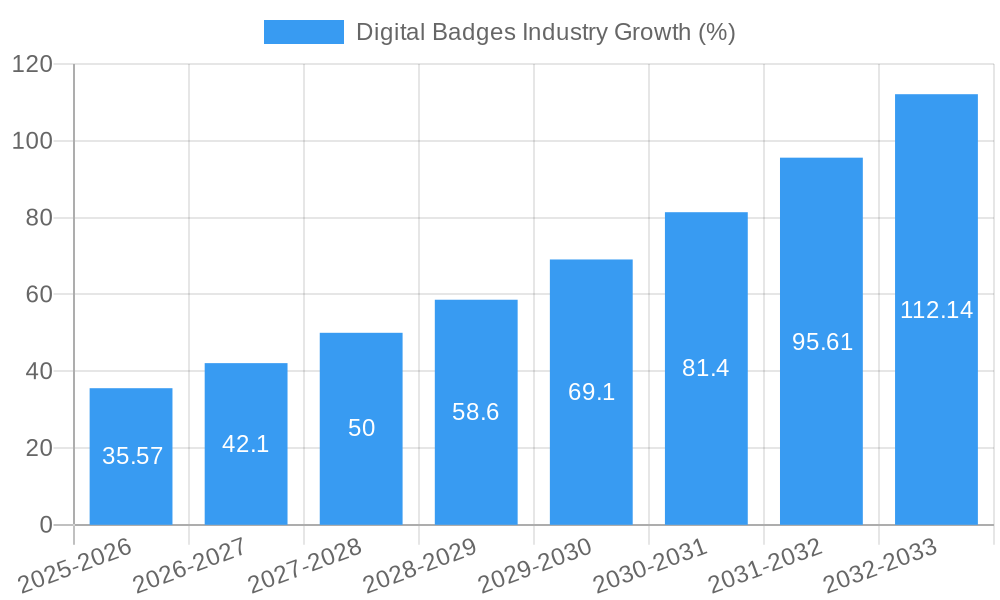
The digital badges market, valued at $202.29 million in 2025, is experiencing robust growth, projected to expand at a compound annual growth rate (CAGR) of 17.38% from 2025 to 2033. This significant expansion is driven by several key factors. Firstly, the increasing adoption of micro-credentialing and skills-based hiring is fueling demand for verifiable and easily shareable credentials. Organizations are increasingly recognizing the value of digital badges in showcasing employee skills and achievements, leading to higher engagement and improved talent management. Secondly, technological advancements, particularly in blockchain technology, are enhancing the security and trustworthiness of digital badges, making them more attractive to both issuers and recipients. Furthermore, the growing emphasis on lifelong learning and upskilling initiatives is contributing to the market's expansion, as individuals seek to demonstrate their competencies effectively to potential employers. The academic sector remains a key adopter, utilizing digital badges to recognize student accomplishments and track progress.
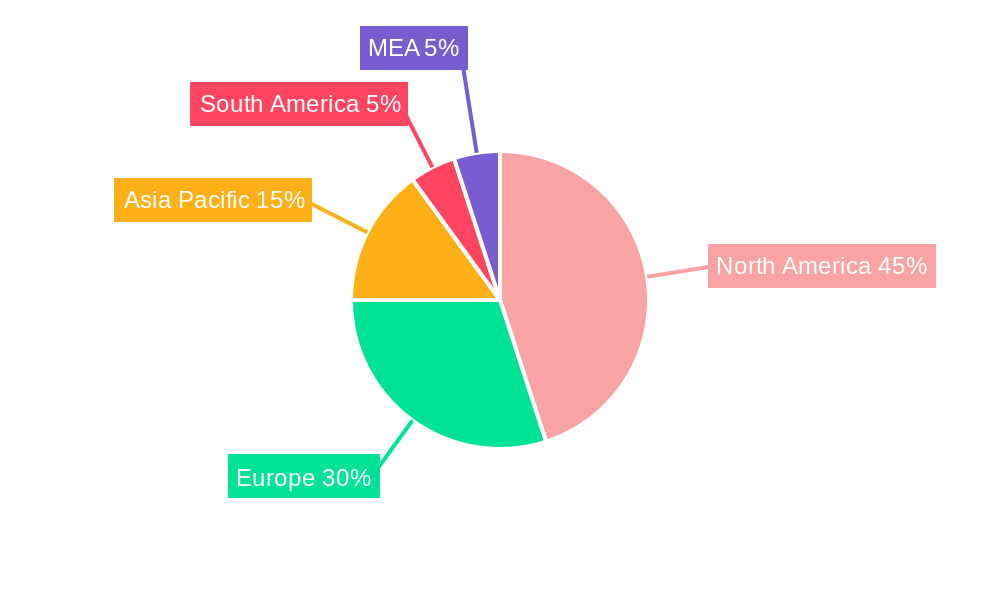
The market segmentation reveals significant opportunities within both the academic and corporate end-user segments. North America currently dominates the market, but strong growth is anticipated in the Asia-Pacific region, fueled by increasing internet penetration and a rising focus on skill development. Competitive landscape analysis reveals a mix of established players and emerging startups, indicating a dynamic and innovative market. While challenges exist, such as standardization issues and concerns regarding the credibility of certain badge issuers, the overall outlook for the digital badges market remains highly positive, driven by the inherent value proposition of micro-credentials and the ongoing evolution of learning and talent management practices. The market's expansion is expected to continue its trajectory, driven by both established trends and the emergence of novel applications for digital badges across various sectors.
This comprehensive report provides a detailed analysis of the Digital Badges market, encompassing market dynamics, growth trends, regional dominance, product landscape, key players, and future outlook. The study period covers 2019-2033, with a base year of 2025 and a forecast period of 2025-2033. This report is essential for industry professionals, investors, and strategists seeking to understand and capitalize on the evolving digital badges landscape. The market is segmented by end-user (Academic, Corporate) and further analyzed across various geographic regions.
Digital Badges Industry Market Dynamics & Structure
The digital badges market is characterized by moderate concentration, with several key players vying for market share. Technological innovation, particularly in areas like blockchain integration and AI-driven verification, is a key driver. Regulatory frameworks are still evolving, impacting the standardization and acceptance of digital badges across different sectors. Competitive substitutes include traditional certifications and transcripts, although digital badges offer advantages in terms of accessibility, verification, and cost-effectiveness. The end-user demographics are expanding, with increasing adoption across both academic and corporate settings. M&A activity has been moderate, with a predicted xx number of deals in 2024, reflecting consolidation efforts and expansion strategies within the industry.
- Market Concentration: Moderately concentrated, with top 5 players holding an estimated xx% market share in 2025.
- Technological Innovation: Blockchain technology for enhanced security and verification, AI for automated issuance and validation.
- Regulatory Frameworks: Still evolving; lack of standardized guidelines poses a challenge to wider adoption.
- Competitive Substitutes: Traditional certificates, transcripts; digital badges offer enhanced portability and verification.
- End-User Demographics: Growing adoption in both academic and corporate sectors, driven by increased demand for skills validation.
- M&A Trends: Predicted xx M&A deals in 2024, driven by consolidation and expansion strategies.
Digital Badges Industry Growth Trends & Insights
The global digital badges market is experiencing robust growth, fueled by the rising demand for skills validation and the increasing adoption of digital learning platforms. The market size is estimated at $XX million in 2025 and is projected to reach $XX million by 2033, exhibiting a CAGR of xx% during the forecast period. This growth is driven by factors such as the increasing need for verifiable credentials in the job market, the growing popularity of online learning platforms, and the rising awareness of the benefits of digital badges among educational institutions and corporations. Technological advancements, such as the integration of blockchain technology, are further accelerating market growth. Consumer behavior shifts towards digital solutions and the growing acceptance of online credentials are also contributing factors. Market penetration is expected to increase from xx% in 2025 to xx% by 2033.
Dominant Regions, Countries, or Segments in Digital Badges Industry
The corporate segment is currently the dominant driver of market growth, accounting for an estimated xx% of the market share in 2025. This is primarily due to the increasing demand for upskilling and reskilling initiatives within organizations, which are leveraging digital badges to recognize employee achievements and showcase skills. The North American region currently holds the largest market share, driven by factors such as high technology adoption rates, a strong focus on talent development, and a well-established digital learning ecosystem.
- Key Drivers for Corporate Segment:
- Growing focus on skills gap closure and talent development initiatives.
- Increased demand for verifiable employee credentials and skill demonstration.
- Adoption of Learning Management Systems (LMS) and digital learning platforms.
- Key Drivers for North American Region:
- High technology adoption rates and a strong digital learning infrastructure.
- Well-established corporate training and development programs.
- Supportive regulatory environment and government initiatives promoting skills development.
Digital Badges Industry Product Landscape
The digital badges market offers a range of products, from basic digital badges to more sophisticated solutions that integrate blockchain technology and AI for enhanced security and verification. Innovations focus on improving user experience, providing seamless integration with learning management systems, and offering advanced analytics to track badge usage and effectiveness. These solutions are designed to enhance the portability, credibility, and overall value of digital credentials. Unique selling propositions include advanced verification mechanisms, customizable badge designs, and seamless integration with various platforms.
Key Drivers, Barriers & Challenges in Digital Badges Industry
Key Drivers:
The growing demand for skills validation, the rising adoption of online learning platforms, and the increasing need for verifiable credentials are key drivers of market growth. Technological advancements, such as blockchain integration and AI-powered verification, are also propelling market expansion. Furthermore, government initiatives promoting digital literacy and skills development further support the growth trajectory.
Key Barriers & Challenges:
Lack of standardization and interoperability across different digital badge platforms, security concerns related to data privacy and integrity, and skepticism from some employers about the value of digital badges are significant challenges. High initial implementation costs and the need for extensive training for both issuers and recipients also hinder widespread adoption. Estimated xx% of organizations cite these factors as significant impediments to adoption in 2025.
Emerging Opportunities in Digital Badges Industry
Untapped markets in developing economies and the potential for integration with emerging technologies like the metaverse present significant opportunities. The growing focus on micro-credentials and the increasing demand for continuous learning offer avenues for innovation. Personalized learning pathways, incorporating digital badges as milestones, present a substantial opportunity for growth.
Growth Accelerators in the Digital Badges Industry
Strategic partnerships between digital badge platforms and learning management systems are key growth accelerators. Technological advancements in blockchain and AI, enabling enhanced security and automated verification, further drive growth. Government initiatives supporting digital skills development and the expansion of digital badges into new sectors like healthcare and finance create additional momentum.
Key Players Shaping the Digital Badges Industry Market
- Concentric Sky Inc
- ProExam
- ARMA International
- Forall Systems Inc
- Accredible
- Badgecraft
- Skillsoft Corporation
- Portfolium Inc
- AXELOS
- Credly Inc
- International Institute of Business Analysis
Notable Milestones in Digital Badges Industry Sector
- June 2023: Skilljar partners with Accredible, creating seamless integration between training content and credentialing programs.
- January 2023: Digital Nasional Berhad and Ericsson launch a free online academic program in Malaysia, awarding digital badges upon completion.
In-Depth Digital Badges Industry Market Outlook
The future of the digital badges market is bright, with continued growth driven by technological advancements, strategic partnerships, and increasing adoption across various sectors. The expanding use of digital badges in micro-credentialing, combined with rising demand for continuous learning and skills development, presents significant opportunities for market expansion and innovation. The market's potential lies in its ability to address the skills gap, enhance employability, and provide transparent and verifiable credentials. The integration of blockchain and AI promises further growth by addressing concerns over security and scalability.
Digital Badges Industry Segmentation
-
1. End-user
- 1.1. Academic
- 1.2. Corporate
Digital Badges Industry Segmentation By Geography
- 1. North America
- 2. Europe
- 3. Asia Pacific
- 4. Rest of the World
Digital Badges Industry REPORT HIGHLIGHTS
| Aspects | Details |
|---|---|
| Study Period | 2019-2033 |
| Base Year | 2024 |
| Estimated Year | 2025 |
| Forecast Period | 2025-2033 |
| Historical Period | 2019-2024 |
| Growth Rate | CAGR of 17.38% from 2019-2033 |
| Segmentation |
|
Table of Contents
- 1. Introduction
- 1.1. Research Scope
- 1.2. Market Segmentation
- 1.3. Research Methodology
- 1.4. Definitions and Assumptions
- 2. Executive Summary
- 2.1. Introduction
- 3. Market Dynamics
- 3.1. Introduction
- 3.2. Market Drivers
- 3.2.1. Increasing Focus on Online Learning
- 3.3. Market Restrains
- 3.3.1. Lack of IT Infrastructure in Developing Regions
- 3.4. Market Trends
- 3.4.1. Academic Segment to Occupy a Significant Market Share
- 4. Market Factor Analysis
- 4.1. Porters Five Forces
- 4.2. Supply/Value Chain
- 4.3. PESTEL analysis
- 4.4. Market Entropy
- 4.5. Patent/Trademark Analysis
- 5. Global Digital Badges Industry Analysis, Insights and Forecast, 2019-2031
- 5.1. Market Analysis, Insights and Forecast - by End-user
- 5.1.1. Academic
- 5.1.2. Corporate
- 5.2. Market Analysis, Insights and Forecast - by Region
- 5.2.1. North America
- 5.2.2. Europe
- 5.2.3. Asia Pacific
- 5.2.4. Rest of the World
- 5.1. Market Analysis, Insights and Forecast - by End-user
- 6. North America Digital Badges Industry Analysis, Insights and Forecast, 2019-2031
- 6.1. Market Analysis, Insights and Forecast - by End-user
- 6.1.1. Academic
- 6.1.2. Corporate
- 6.1. Market Analysis, Insights and Forecast - by End-user
- 7. Europe Digital Badges Industry Analysis, Insights and Forecast, 2019-2031
- 7.1. Market Analysis, Insights and Forecast - by End-user
- 7.1.1. Academic
- 7.1.2. Corporate
- 7.1. Market Analysis, Insights and Forecast - by End-user
- 8. Asia Pacific Digital Badges Industry Analysis, Insights and Forecast, 2019-2031
- 8.1. Market Analysis, Insights and Forecast - by End-user
- 8.1.1. Academic
- 8.1.2. Corporate
- 8.1. Market Analysis, Insights and Forecast - by End-user
- 9. Rest of the World Digital Badges Industry Analysis, Insights and Forecast, 2019-2031
- 9.1. Market Analysis, Insights and Forecast - by End-user
- 9.1.1. Academic
- 9.1.2. Corporate
- 9.1. Market Analysis, Insights and Forecast - by End-user
- 10. North America Digital Badges Industry Analysis, Insights and Forecast, 2019-2031
- 10.1. Market Analysis, Insights and Forecast - By Country/Sub-region
- 10.1.1 United States
- 10.1.2 Canada
- 10.1.3 Mexico
- 11. Europe Digital Badges Industry Analysis, Insights and Forecast, 2019-2031
- 11.1. Market Analysis, Insights and Forecast - By Country/Sub-region
- 11.1.1 Germany
- 11.1.2 United Kingdom
- 11.1.3 France
- 11.1.4 Spain
- 11.1.5 Italy
- 11.1.6 Spain
- 11.1.7 Belgium
- 11.1.8 Netherland
- 11.1.9 Nordics
- 11.1.10 Rest of Europe
- 12. Asia Pacific Digital Badges Industry Analysis, Insights and Forecast, 2019-2031
- 12.1. Market Analysis, Insights and Forecast - By Country/Sub-region
- 12.1.1 China
- 12.1.2 Japan
- 12.1.3 India
- 12.1.4 South Korea
- 12.1.5 Southeast Asia
- 12.1.6 Australia
- 12.1.7 Indonesia
- 12.1.8 Phillipes
- 12.1.9 Singapore
- 12.1.10 Thailandc
- 12.1.11 Rest of Asia Pacific
- 13. South America Digital Badges Industry Analysis, Insights and Forecast, 2019-2031
- 13.1. Market Analysis, Insights and Forecast - By Country/Sub-region
- 13.1.1 Brazil
- 13.1.2 Argentina
- 13.1.3 Peru
- 13.1.4 Chile
- 13.1.5 Colombia
- 13.1.6 Ecuador
- 13.1.7 Venezuela
- 13.1.8 Rest of South America
- 14. North America Digital Badges Industry Analysis, Insights and Forecast, 2019-2031
- 14.1. Market Analysis, Insights and Forecast - By Country/Sub-region
- 14.1.1 United States
- 14.1.2 Canada
- 14.1.3 Mexico
- 15. MEA Digital Badges Industry Analysis, Insights and Forecast, 2019-2031
- 15.1. Market Analysis, Insights and Forecast - By Country/Sub-region
- 15.1.1 United Arab Emirates
- 15.1.2 Saudi Arabia
- 15.1.3 South Africa
- 15.1.4 Rest of Middle East and Africa
- 16. Competitive Analysis
- 16.1. Global Market Share Analysis 2024
- 16.2. Company Profiles
- 16.2.1 Concentric Sky Inc
- 16.2.1.1. Overview
- 16.2.1.2. Products
- 16.2.1.3. SWOT Analysis
- 16.2.1.4. Recent Developments
- 16.2.1.5. Financials (Based on Availability)
- 16.2.2 ProExam
- 16.2.2.1. Overview
- 16.2.2.2. Products
- 16.2.2.3. SWOT Analysis
- 16.2.2.4. Recent Developments
- 16.2.2.5. Financials (Based on Availability)
- 16.2.3 ARMA International
- 16.2.3.1. Overview
- 16.2.3.2. Products
- 16.2.3.3. SWOT Analysis
- 16.2.3.4. Recent Developments
- 16.2.3.5. Financials (Based on Availability)
- 16.2.4 Forall Systems Inc
- 16.2.4.1. Overview
- 16.2.4.2. Products
- 16.2.4.3. SWOT Analysis
- 16.2.4.4. Recent Developments
- 16.2.4.5. Financials (Based on Availability)
- 16.2.5 Accredible
- 16.2.5.1. Overview
- 16.2.5.2. Products
- 16.2.5.3. SWOT Analysis
- 16.2.5.4. Recent Developments
- 16.2.5.5. Financials (Based on Availability)
- 16.2.6 Badgecraf
- 16.2.6.1. Overview
- 16.2.6.2. Products
- 16.2.6.3. SWOT Analysis
- 16.2.6.4. Recent Developments
- 16.2.6.5. Financials (Based on Availability)
- 16.2.7 Skillsoft Corporation
- 16.2.7.1. Overview
- 16.2.7.2. Products
- 16.2.7.3. SWOT Analysis
- 16.2.7.4. Recent Developments
- 16.2.7.5. Financials (Based on Availability)
- 16.2.8 Portfolium Inc
- 16.2.8.1. Overview
- 16.2.8.2. Products
- 16.2.8.3. SWOT Analysis
- 16.2.8.4. Recent Developments
- 16.2.8.5. Financials (Based on Availability)
- 16.2.9 AXELOS
- 16.2.9.1. Overview
- 16.2.9.2. Products
- 16.2.9.3. SWOT Analysis
- 16.2.9.4. Recent Developments
- 16.2.9.5. Financials (Based on Availability)
- 16.2.10 Credly Inc
- 16.2.10.1. Overview
- 16.2.10.2. Products
- 16.2.10.3. SWOT Analysis
- 16.2.10.4. Recent Developments
- 16.2.10.5. Financials (Based on Availability)
- 16.2.11 International Institute of Business Analysis
- 16.2.11.1. Overview
- 16.2.11.2. Products
- 16.2.11.3. SWOT Analysis
- 16.2.11.4. Recent Developments
- 16.2.11.5. Financials (Based on Availability)
- 16.2.1 Concentric Sky Inc
List of Figures
- Figure 1: Global Digital Badges Industry Revenue Breakdown (Million, %) by Region 2024 & 2032
- Figure 2: Global Digital Badges Industry Volume Breakdown (K Unit, %) by Region 2024 & 2032
- Figure 3: North America Digital Badges Industry Revenue (Million), by Country 2024 & 2032
- Figure 4: North America Digital Badges Industry Volume (K Unit), by Country 2024 & 2032
- Figure 5: North America Digital Badges Industry Revenue Share (%), by Country 2024 & 2032
- Figure 6: North America Digital Badges Industry Volume Share (%), by Country 2024 & 2032
- Figure 7: Europe Digital Badges Industry Revenue (Million), by Country 2024 & 2032
- Figure 8: Europe Digital Badges Industry Volume (K Unit), by Country 2024 & 2032
- Figure 9: Europe Digital Badges Industry Revenue Share (%), by Country 2024 & 2032
- Figure 10: Europe Digital Badges Industry Volume Share (%), by Country 2024 & 2032
- Figure 11: Asia Pacific Digital Badges Industry Revenue (Million), by Country 2024 & 2032
- Figure 12: Asia Pacific Digital Badges Industry Volume (K Unit), by Country 2024 & 2032
- Figure 13: Asia Pacific Digital Badges Industry Revenue Share (%), by Country 2024 & 2032
- Figure 14: Asia Pacific Digital Badges Industry Volume Share (%), by Country 2024 & 2032
- Figure 15: South America Digital Badges Industry Revenue (Million), by Country 2024 & 2032
- Figure 16: South America Digital Badges Industry Volume (K Unit), by Country 2024 & 2032
- Figure 17: South America Digital Badges Industry Revenue Share (%), by Country 2024 & 2032
- Figure 18: South America Digital Badges Industry Volume Share (%), by Country 2024 & 2032
- Figure 19: North America Digital Badges Industry Revenue (Million), by Country 2024 & 2032
- Figure 20: North America Digital Badges Industry Volume (K Unit), by Country 2024 & 2032
- Figure 21: North America Digital Badges Industry Revenue Share (%), by Country 2024 & 2032
- Figure 22: North America Digital Badges Industry Volume Share (%), by Country 2024 & 2032
- Figure 23: MEA Digital Badges Industry Revenue (Million), by Country 2024 & 2032
- Figure 24: MEA Digital Badges Industry Volume (K Unit), by Country 2024 & 2032
- Figure 25: MEA Digital Badges Industry Revenue Share (%), by Country 2024 & 2032
- Figure 26: MEA Digital Badges Industry Volume Share (%), by Country 2024 & 2032
- Figure 27: North America Digital Badges Industry Revenue (Million), by End-user 2024 & 2032
- Figure 28: North America Digital Badges Industry Volume (K Unit), by End-user 2024 & 2032
- Figure 29: North America Digital Badges Industry Revenue Share (%), by End-user 2024 & 2032
- Figure 30: North America Digital Badges Industry Volume Share (%), by End-user 2024 & 2032
- Figure 31: North America Digital Badges Industry Revenue (Million), by Country 2024 & 2032
- Figure 32: North America Digital Badges Industry Volume (K Unit), by Country 2024 & 2032
- Figure 33: North America Digital Badges Industry Revenue Share (%), by Country 2024 & 2032
- Figure 34: North America Digital Badges Industry Volume Share (%), by Country 2024 & 2032
- Figure 35: Europe Digital Badges Industry Revenue (Million), by End-user 2024 & 2032
- Figure 36: Europe Digital Badges Industry Volume (K Unit), by End-user 2024 & 2032
- Figure 37: Europe Digital Badges Industry Revenue Share (%), by End-user 2024 & 2032
- Figure 38: Europe Digital Badges Industry Volume Share (%), by End-user 2024 & 2032
- Figure 39: Europe Digital Badges Industry Revenue (Million), by Country 2024 & 2032
- Figure 40: Europe Digital Badges Industry Volume (K Unit), by Country 2024 & 2032
- Figure 41: Europe Digital Badges Industry Revenue Share (%), by Country 2024 & 2032
- Figure 42: Europe Digital Badges Industry Volume Share (%), by Country 2024 & 2032
- Figure 43: Asia Pacific Digital Badges Industry Revenue (Million), by End-user 2024 & 2032
- Figure 44: Asia Pacific Digital Badges Industry Volume (K Unit), by End-user 2024 & 2032
- Figure 45: Asia Pacific Digital Badges Industry Revenue Share (%), by End-user 2024 & 2032
- Figure 46: Asia Pacific Digital Badges Industry Volume Share (%), by End-user 2024 & 2032
- Figure 47: Asia Pacific Digital Badges Industry Revenue (Million), by Country 2024 & 2032
- Figure 48: Asia Pacific Digital Badges Industry Volume (K Unit), by Country 2024 & 2032
- Figure 49: Asia Pacific Digital Badges Industry Revenue Share (%), by Country 2024 & 2032
- Figure 50: Asia Pacific Digital Badges Industry Volume Share (%), by Country 2024 & 2032
- Figure 51: Rest of the World Digital Badges Industry Revenue (Million), by End-user 2024 & 2032
- Figure 52: Rest of the World Digital Badges Industry Volume (K Unit), by End-user 2024 & 2032
- Figure 53: Rest of the World Digital Badges Industry Revenue Share (%), by End-user 2024 & 2032
- Figure 54: Rest of the World Digital Badges Industry Volume Share (%), by End-user 2024 & 2032
- Figure 55: Rest of the World Digital Badges Industry Revenue (Million), by Country 2024 & 2032
- Figure 56: Rest of the World Digital Badges Industry Volume (K Unit), by Country 2024 & 2032
- Figure 57: Rest of the World Digital Badges Industry Revenue Share (%), by Country 2024 & 2032
- Figure 58: Rest of the World Digital Badges Industry Volume Share (%), by Country 2024 & 2032
List of Tables
- Table 1: Global Digital Badges Industry Revenue Million Forecast, by Region 2019 & 2032
- Table 2: Global Digital Badges Industry Volume K Unit Forecast, by Region 2019 & 2032
- Table 3: Global Digital Badges Industry Revenue Million Forecast, by End-user 2019 & 2032
- Table 4: Global Digital Badges Industry Volume K Unit Forecast, by End-user 2019 & 2032
- Table 5: Global Digital Badges Industry Revenue Million Forecast, by Region 2019 & 2032
- Table 6: Global Digital Badges Industry Volume K Unit Forecast, by Region 2019 & 2032
- Table 7: Global Digital Badges Industry Revenue Million Forecast, by Country 2019 & 2032
- Table 8: Global Digital Badges Industry Volume K Unit Forecast, by Country 2019 & 2032
- Table 9: United States Digital Badges Industry Revenue (Million) Forecast, by Application 2019 & 2032
- Table 10: United States Digital Badges Industry Volume (K Unit) Forecast, by Application 2019 & 2032
- Table 11: Canada Digital Badges Industry Revenue (Million) Forecast, by Application 2019 & 2032
- Table 12: Canada Digital Badges Industry Volume (K Unit) Forecast, by Application 2019 & 2032
- Table 13: Mexico Digital Badges Industry Revenue (Million) Forecast, by Application 2019 & 2032
- Table 14: Mexico Digital Badges Industry Volume (K Unit) Forecast, by Application 2019 & 2032
- Table 15: Global Digital Badges Industry Revenue Million Forecast, by Country 2019 & 2032
- Table 16: Global Digital Badges Industry Volume K Unit Forecast, by Country 2019 & 2032
- Table 17: Germany Digital Badges Industry Revenue (Million) Forecast, by Application 2019 & 2032
- Table 18: Germany Digital Badges Industry Volume (K Unit) Forecast, by Application 2019 & 2032
- Table 19: United Kingdom Digital Badges Industry Revenue (Million) Forecast, by Application 2019 & 2032
- Table 20: United Kingdom Digital Badges Industry Volume (K Unit) Forecast, by Application 2019 & 2032
- Table 21: France Digital Badges Industry Revenue (Million) Forecast, by Application 2019 & 2032
- Table 22: France Digital Badges Industry Volume (K Unit) Forecast, by Application 2019 & 2032
- Table 23: Spain Digital Badges Industry Revenue (Million) Forecast, by Application 2019 & 2032
- Table 24: Spain Digital Badges Industry Volume (K Unit) Forecast, by Application 2019 & 2032
- Table 25: Italy Digital Badges Industry Revenue (Million) Forecast, by Application 2019 & 2032
- Table 26: Italy Digital Badges Industry Volume (K Unit) Forecast, by Application 2019 & 2032
- Table 27: Spain Digital Badges Industry Revenue (Million) Forecast, by Application 2019 & 2032
- Table 28: Spain Digital Badges Industry Volume (K Unit) Forecast, by Application 2019 & 2032
- Table 29: Belgium Digital Badges Industry Revenue (Million) Forecast, by Application 2019 & 2032
- Table 30: Belgium Digital Badges Industry Volume (K Unit) Forecast, by Application 2019 & 2032
- Table 31: Netherland Digital Badges Industry Revenue (Million) Forecast, by Application 2019 & 2032
- Table 32: Netherland Digital Badges Industry Volume (K Unit) Forecast, by Application 2019 & 2032
- Table 33: Nordics Digital Badges Industry Revenue (Million) Forecast, by Application 2019 & 2032
- Table 34: Nordics Digital Badges Industry Volume (K Unit) Forecast, by Application 2019 & 2032
- Table 35: Rest of Europe Digital Badges Industry Revenue (Million) Forecast, by Application 2019 & 2032
- Table 36: Rest of Europe Digital Badges Industry Volume (K Unit) Forecast, by Application 2019 & 2032
- Table 37: Global Digital Badges Industry Revenue Million Forecast, by Country 2019 & 2032
- Table 38: Global Digital Badges Industry Volume K Unit Forecast, by Country 2019 & 2032
- Table 39: China Digital Badges Industry Revenue (Million) Forecast, by Application 2019 & 2032
- Table 40: China Digital Badges Industry Volume (K Unit) Forecast, by Application 2019 & 2032
- Table 41: Japan Digital Badges Industry Revenue (Million) Forecast, by Application 2019 & 2032
- Table 42: Japan Digital Badges Industry Volume (K Unit) Forecast, by Application 2019 & 2032
- Table 43: India Digital Badges Industry Revenue (Million) Forecast, by Application 2019 & 2032
- Table 44: India Digital Badges Industry Volume (K Unit) Forecast, by Application 2019 & 2032
- Table 45: South Korea Digital Badges Industry Revenue (Million) Forecast, by Application 2019 & 2032
- Table 46: South Korea Digital Badges Industry Volume (K Unit) Forecast, by Application 2019 & 2032
- Table 47: Southeast Asia Digital Badges Industry Revenue (Million) Forecast, by Application 2019 & 2032
- Table 48: Southeast Asia Digital Badges Industry Volume (K Unit) Forecast, by Application 2019 & 2032
- Table 49: Australia Digital Badges Industry Revenue (Million) Forecast, by Application 2019 & 2032
- Table 50: Australia Digital Badges Industry Volume (K Unit) Forecast, by Application 2019 & 2032
- Table 51: Indonesia Digital Badges Industry Revenue (Million) Forecast, by Application 2019 & 2032
- Table 52: Indonesia Digital Badges Industry Volume (K Unit) Forecast, by Application 2019 & 2032
- Table 53: Phillipes Digital Badges Industry Revenue (Million) Forecast, by Application 2019 & 2032
- Table 54: Phillipes Digital Badges Industry Volume (K Unit) Forecast, by Application 2019 & 2032
- Table 55: Singapore Digital Badges Industry Revenue (Million) Forecast, by Application 2019 & 2032
- Table 56: Singapore Digital Badges Industry Volume (K Unit) Forecast, by Application 2019 & 2032
- Table 57: Thailandc Digital Badges Industry Revenue (Million) Forecast, by Application 2019 & 2032
- Table 58: Thailandc Digital Badges Industry Volume (K Unit) Forecast, by Application 2019 & 2032
- Table 59: Rest of Asia Pacific Digital Badges Industry Revenue (Million) Forecast, by Application 2019 & 2032
- Table 60: Rest of Asia Pacific Digital Badges Industry Volume (K Unit) Forecast, by Application 2019 & 2032
- Table 61: Global Digital Badges Industry Revenue Million Forecast, by Country 2019 & 2032
- Table 62: Global Digital Badges Industry Volume K Unit Forecast, by Country 2019 & 2032
- Table 63: Brazil Digital Badges Industry Revenue (Million) Forecast, by Application 2019 & 2032
- Table 64: Brazil Digital Badges Industry Volume (K Unit) Forecast, by Application 2019 & 2032
- Table 65: Argentina Digital Badges Industry Revenue (Million) Forecast, by Application 2019 & 2032
- Table 66: Argentina Digital Badges Industry Volume (K Unit) Forecast, by Application 2019 & 2032
- Table 67: Peru Digital Badges Industry Revenue (Million) Forecast, by Application 2019 & 2032
- Table 68: Peru Digital Badges Industry Volume (K Unit) Forecast, by Application 2019 & 2032
- Table 69: Chile Digital Badges Industry Revenue (Million) Forecast, by Application 2019 & 2032
- Table 70: Chile Digital Badges Industry Volume (K Unit) Forecast, by Application 2019 & 2032
- Table 71: Colombia Digital Badges Industry Revenue (Million) Forecast, by Application 2019 & 2032
- Table 72: Colombia Digital Badges Industry Volume (K Unit) Forecast, by Application 2019 & 2032
- Table 73: Ecuador Digital Badges Industry Revenue (Million) Forecast, by Application 2019 & 2032
- Table 74: Ecuador Digital Badges Industry Volume (K Unit) Forecast, by Application 2019 & 2032
- Table 75: Venezuela Digital Badges Industry Revenue (Million) Forecast, by Application 2019 & 2032
- Table 76: Venezuela Digital Badges Industry Volume (K Unit) Forecast, by Application 2019 & 2032
- Table 77: Rest of South America Digital Badges Industry Revenue (Million) Forecast, by Application 2019 & 2032
- Table 78: Rest of South America Digital Badges Industry Volume (K Unit) Forecast, by Application 2019 & 2032
- Table 79: Global Digital Badges Industry Revenue Million Forecast, by Country 2019 & 2032
- Table 80: Global Digital Badges Industry Volume K Unit Forecast, by Country 2019 & 2032
- Table 81: United States Digital Badges Industry Revenue (Million) Forecast, by Application 2019 & 2032
- Table 82: United States Digital Badges Industry Volume (K Unit) Forecast, by Application 2019 & 2032
- Table 83: Canada Digital Badges Industry Revenue (Million) Forecast, by Application 2019 & 2032
- Table 84: Canada Digital Badges Industry Volume (K Unit) Forecast, by Application 2019 & 2032
- Table 85: Mexico Digital Badges Industry Revenue (Million) Forecast, by Application 2019 & 2032
- Table 86: Mexico Digital Badges Industry Volume (K Unit) Forecast, by Application 2019 & 2032
- Table 87: Global Digital Badges Industry Revenue Million Forecast, by Country 2019 & 2032
- Table 88: Global Digital Badges Industry Volume K Unit Forecast, by Country 2019 & 2032
- Table 89: United Arab Emirates Digital Badges Industry Revenue (Million) Forecast, by Application 2019 & 2032
- Table 90: United Arab Emirates Digital Badges Industry Volume (K Unit) Forecast, by Application 2019 & 2032
- Table 91: Saudi Arabia Digital Badges Industry Revenue (Million) Forecast, by Application 2019 & 2032
- Table 92: Saudi Arabia Digital Badges Industry Volume (K Unit) Forecast, by Application 2019 & 2032
- Table 93: South Africa Digital Badges Industry Revenue (Million) Forecast, by Application 2019 & 2032
- Table 94: South Africa Digital Badges Industry Volume (K Unit) Forecast, by Application 2019 & 2032
- Table 95: Rest of Middle East and Africa Digital Badges Industry Revenue (Million) Forecast, by Application 2019 & 2032
- Table 96: Rest of Middle East and Africa Digital Badges Industry Volume (K Unit) Forecast, by Application 2019 & 2032
- Table 97: Global Digital Badges Industry Revenue Million Forecast, by End-user 2019 & 2032
- Table 98: Global Digital Badges Industry Volume K Unit Forecast, by End-user 2019 & 2032
- Table 99: Global Digital Badges Industry Revenue Million Forecast, by Country 2019 & 2032
- Table 100: Global Digital Badges Industry Volume K Unit Forecast, by Country 2019 & 2032
- Table 101: Global Digital Badges Industry Revenue Million Forecast, by End-user 2019 & 2032
- Table 102: Global Digital Badges Industry Volume K Unit Forecast, by End-user 2019 & 2032
- Table 103: Global Digital Badges Industry Revenue Million Forecast, by Country 2019 & 2032
- Table 104: Global Digital Badges Industry Volume K Unit Forecast, by Country 2019 & 2032
- Table 105: Global Digital Badges Industry Revenue Million Forecast, by End-user 2019 & 2032
- Table 106: Global Digital Badges Industry Volume K Unit Forecast, by End-user 2019 & 2032
- Table 107: Global Digital Badges Industry Revenue Million Forecast, by Country 2019 & 2032
- Table 108: Global Digital Badges Industry Volume K Unit Forecast, by Country 2019 & 2032
- Table 109: Global Digital Badges Industry Revenue Million Forecast, by End-user 2019 & 2032
- Table 110: Global Digital Badges Industry Volume K Unit Forecast, by End-user 2019 & 2032
- Table 111: Global Digital Badges Industry Revenue Million Forecast, by Country 2019 & 2032
- Table 112: Global Digital Badges Industry Volume K Unit Forecast, by Country 2019 & 2032
Frequently Asked Questions
1. What is the projected Compound Annual Growth Rate (CAGR) of the Digital Badges Industry?
The projected CAGR is approximately 17.38%.
2. Which companies are prominent players in the Digital Badges Industry?
Key companies in the market include Concentric Sky Inc, ProExam, ARMA International, Forall Systems Inc, Accredible, Badgecraf, Skillsoft Corporation, Portfolium Inc, AXELOS, Credly Inc, International Institute of Business Analysis.
3. What are the main segments of the Digital Badges Industry?
The market segments include End-user.
4. Can you provide details about the market size?
The market size is estimated to be USD 202.29 Million as of 2022.
5. What are some drivers contributing to market growth?
Increasing Focus on Online Learning.
6. What are the notable trends driving market growth?
Academic Segment to Occupy a Significant Market Share.
7. Are there any restraints impacting market growth?
Lack of IT Infrastructure in Developing Regions.
8. Can you provide examples of recent developments in the market?
June 2023: Skilljar has announced a partnership with Accredible; Issuing organizations can seamlessly connect their Skilljar training content with their credentialing program through the new Accredible Integration with Skilljar. This API integration offers learners a more streamlined and engaging experience, enhancing your credentials' market value and relevance.
9. What pricing options are available for accessing the report?
Pricing options include single-user, multi-user, and enterprise licenses priced at USD 4750, USD 5250, and USD 8750 respectively.
10. Is the market size provided in terms of value or volume?
The market size is provided in terms of value, measured in Million and volume, measured in K Unit.
11. Are there any specific market keywords associated with the report?
Yes, the market keyword associated with the report is "Digital Badges Industry," which aids in identifying and referencing the specific market segment covered.
12. How do I determine which pricing option suits my needs best?
The pricing options vary based on user requirements and access needs. Individual users may opt for single-user licenses, while businesses requiring broader access may choose multi-user or enterprise licenses for cost-effective access to the report.
13. Are there any additional resources or data provided in the Digital Badges Industry report?
While the report offers comprehensive insights, it's advisable to review the specific contents or supplementary materials provided to ascertain if additional resources or data are available.
14. How can I stay updated on further developments or reports in the Digital Badges Industry?
To stay informed about further developments, trends, and reports in the Digital Badges Industry, consider subscribing to industry newsletters, following relevant companies and organizations, or regularly checking reputable industry news sources and publications.
Methodology
Step 1 - Identification of Relevant Samples Size from Population Database


Step 2 - Approaches for Defining Global Market Size (Value, Volume* & Price*)

Note*: In applicable scenarios
Step 3 - Data Sources
Primary Research
- Web Analytics
- Survey Reports
- Research Institute
- Latest Research Reports
- Opinion Leaders
Secondary Research
- Annual Reports
- White Paper
- Latest Press Release
- Industry Association
- Paid Database
- Investor Presentations

Step 4 - Data Triangulation
Involves using different sources of information in order to increase the validity of a study
These sources are likely to be stakeholders in a program - participants, other researchers, program staff, other community members, and so on.
Then we put all data in single framework & apply various statistical tools to find out the dynamic on the market.
During the analysis stage, feedback from the stakeholder groups would be compared to determine areas of agreement as well as areas of divergence
