

Key Insights
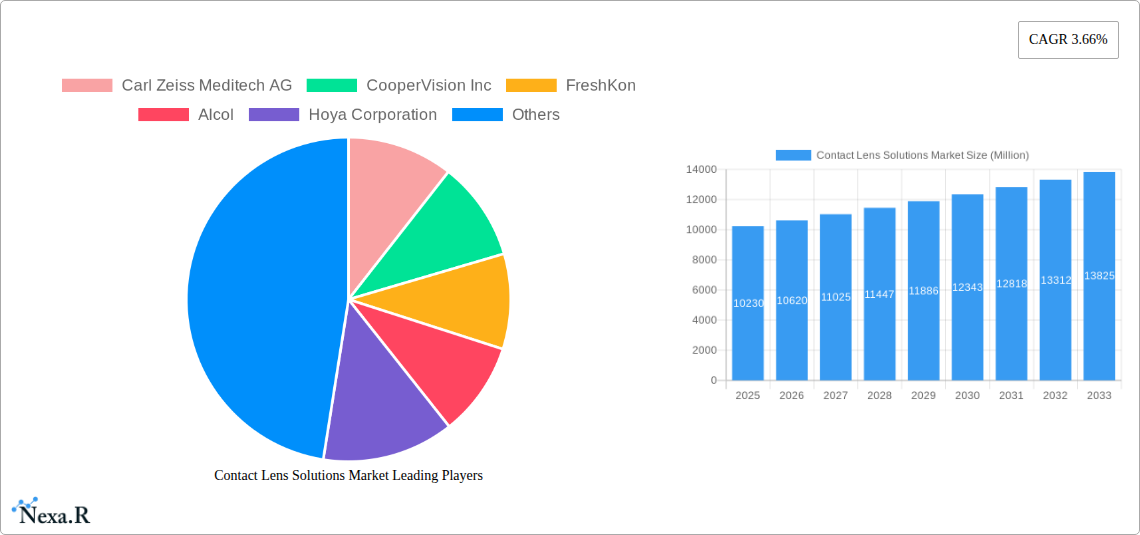
The global contact lens solutions market, valued at $10.23 billion in 2025, is projected to experience steady growth, driven by increasing myopia prevalence and a rising preference for convenient and comfortable vision correction methods. The market's Compound Annual Growth Rate (CAGR) of 3.66% from 2025 to 2033 indicates a consistent expansion, fueled by technological advancements in lens materials and solution formulations. The multi-purpose solution segment holds a significant market share due to its ease of use and cost-effectiveness. Simultaneously, the growing demand for superior comfort and hygiene is driving the adoption of hydrogen-peroxide-based solutions, a segment expected to witness robust growth in the forecast period. E-commerce channels are rapidly gaining traction, offering consumers a convenient and accessible purchasing option, further boosting market expansion. Key players like Johnson & Johnson, Alcon, CooperVision, and Bausch + Lomb are actively involved in product innovation and strategic partnerships to maintain their market positions. Geographical analysis shows robust growth potential in the Asia-Pacific region due to its large and expanding population and increasing disposable incomes. However, potential price sensitivity in emerging markets and the availability of alternative vision correction methods represent key restraints.
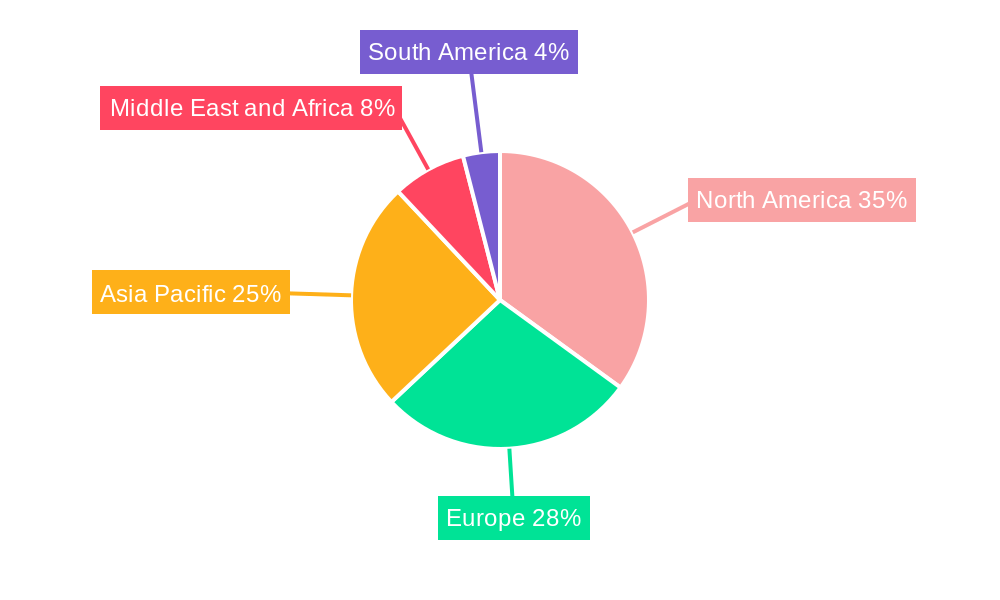
The market segmentation reveals crucial insights into consumer preferences and industry dynamics. Gas permeable and silicon hydrogel lenses are primary drivers within the material segment, reflecting the trend towards enhanced breathability and comfort. The retail channel remains a dominant distribution pathway, although e-commerce is experiencing significant growth, transforming the market's accessibility and convenience. North America and Europe currently hold substantial market share, driven by high awareness, advanced healthcare infrastructure, and strong consumer spending. However, the Asia-Pacific region is poised for considerable expansion, presenting lucrative opportunities for market participants as disposable incomes rise and awareness of contact lenses increases. Future growth will depend on successful product innovation, strategic marketing campaigns that emphasize convenience and hygiene, and continued expansion into emerging markets.
This comprehensive report provides an in-depth analysis of the Contact Lens Solutions market, encompassing market dynamics, growth trends, regional performance, product landscape, and key players. The study period spans from 2019 to 2033, with 2025 as the base and estimated year. The report segments the market by solution type (Multi-Purpose, Hydrogen-Peroxide Based, Others), material of contact lens (Gas Permeable Lens, Silicon Hydrogel, Others), and distribution channel (E-commerce, Retail, Others). This detailed analysis serves as an invaluable resource for industry professionals, investors, and stakeholders seeking to understand and capitalize on opportunities within this dynamic market. The market size is projected to reach xx Million units by 2033.
Contact Lens Solutions Market Dynamics & Structure
The contact lens solutions market exhibits a moderately consolidated structure, with key players such as Johnson & Johnson, Alcon, and CooperVision holding significant market share. Technological innovation, particularly in materials science and solution formulations, is a crucial driver. Stringent regulatory frameworks governing the safety and efficacy of contact lens solutions influence market dynamics. The market faces competition from alternative vision correction methods like LASIK surgery and reading glasses. The end-user demographic is primarily adults aged 18-65, with increasing adoption among older age groups. The historical period (2019-2024) witnessed a moderate level of M&A activity (xx deals), driven by companies seeking to expand their product portfolios and geographic reach. The forecast period (2025-2033) is expected to see continued consolidation.
- Market Concentration: Moderately consolidated, with top 3 players holding approximately xx% market share.
- Technological Innovation: Focus on enhanced comfort, longer wear times, and improved hygiene.
- Regulatory Framework: Stringent regulations impacting product development and approval processes.
- Competitive Substitutes: LASIK surgery, reading glasses, and other vision correction methods.
- End-User Demographics: Primarily adults aged 18-65, growing older adult segment.
- M&A Trends: Moderate activity in the historical period (2019-2024), xx deals; forecast for continued consolidation.
- Innovation Barriers: High R&D costs and rigorous regulatory approval processes.
Contact Lens Solutions Market Growth Trends & Insights
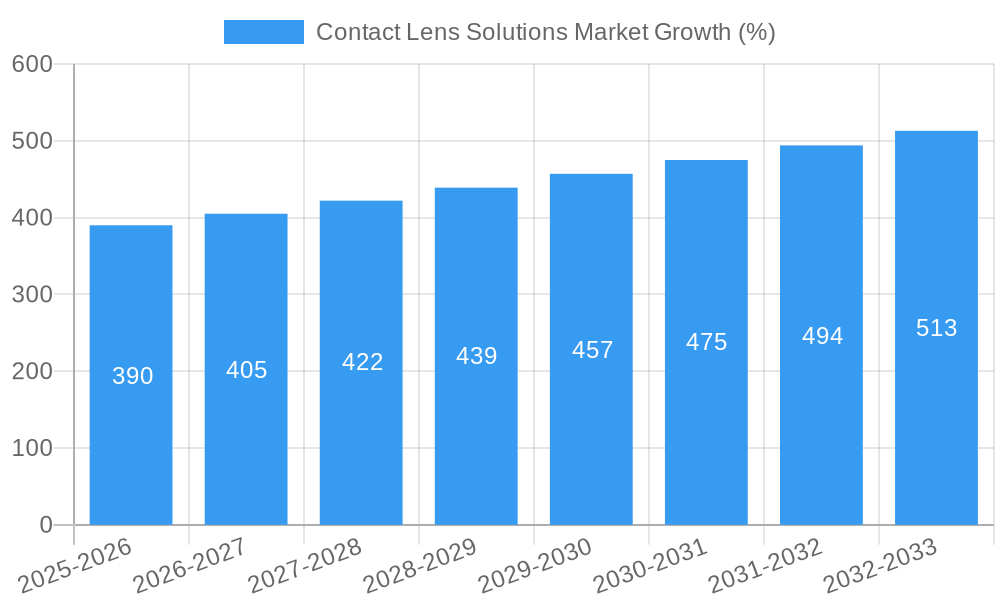
The contact lens solutions market has experienced steady growth throughout the historical period (2019-2024), driven by increasing myopia prevalence and rising disposable income. The market size witnessed a CAGR of xx% during this period. The adoption rate of contact lenses, particularly daily disposables, is increasing, fueled by enhanced comfort and convenience. Technological disruptions, such as the introduction of innovative solution formulations and improved lens materials, have significantly contributed to market growth. Shifting consumer preferences toward premium solutions with added features like moisturizing agents are also impacting growth. The market is projected to maintain a healthy growth trajectory throughout the forecast period (2025-2033), with a projected CAGR of xx%, driven by factors such as increasing awareness of eye health and technological advancements. Market penetration is expected to increase further, particularly in developing economies.
Dominant Regions, Countries, or Segments in Contact Lens Solutions Market
North America currently holds the largest market share in the contact lens solutions market, followed by Europe and Asia Pacific. The dominance of North America is attributable to high contact lens usage rates, robust healthcare infrastructure, and high disposable incomes. Within the segments, Multi-Purpose solutions account for the largest share of the market, due to their convenience and cost-effectiveness. Silicon Hydrogel contact lenses are gaining popularity, driving demand for compatible solutions. The Retail distribution channel dominates, although E-commerce is experiencing rapid growth.
- Key Drivers (North America): High contact lens penetration, well-developed healthcare infrastructure, high disposable incomes.
- Key Drivers (Multi-Purpose Solutions): Convenience, cost-effectiveness.
- Key Drivers (Silicon Hydrogel): Improved comfort and oxygen permeability.
- Key Drivers (Retail Channel): Established distribution network, customer access.
- Growth Potential: Asia Pacific and other emerging markets offer significant growth opportunities.
Contact Lens Solutions Market Product Landscape
The contact lens solutions market offers a diverse range of products, catering to various needs and preferences. Recent innovations focus on enhanced comfort, improved hygiene, and extended wear capabilities. Products incorporate features such as advanced moisturizing agents, antimicrobial properties, and improved cleaning efficacy. Unique selling propositions often center on enhanced user experience and health benefits. Technological advancements include the development of novel preservatives and formulations to mitigate irritation and enhance lens lifespan.
Key Drivers, Barriers & Challenges in Contact Lens Solutions Market
Key Drivers: Rising myopia prevalence globally, increasing awareness of eye health, technological advancements leading to improved product formulations, and convenient packaging options.
Challenges & Restraints: Stringent regulatory approvals, potential for adverse reactions with certain solutions, competition from other vision correction methods, and supply chain disruptions which may impact availability and price. The impact of these challenges could potentially decrease the CAGR by xx% in certain regions.
Emerging Opportunities in Contact Lens Solutions Market
Untapped markets in developing countries, expanding use of daily disposable contact lenses, demand for personalized solutions catering to specific eye conditions, and the integration of technology into contact lens solutions (e.g., smart contact lenses) present significant opportunities. The growing awareness of eye care and better healthcare infrastructure is a major factor.
Growth Accelerators in the Contact Lens Solutions Market Industry
Technological breakthroughs in solution formulations, strategic partnerships between lens manufacturers and solution providers, market expansion into emerging economies, and the introduction of innovative product features that enhance convenience and comfort will accelerate market growth. The introduction of more sustainable and eco-friendly packaging is also a potential accelerator.
Key Players Shaping the Contact Lens Solutions Market Market
- Carl Zeiss Meditech AG
- CooperVision Inc
- FreshKon
- Alcon
- Hoya Corporation
- Bausch & Lomb Incorporated
- Menicon Co Ltd
- CLB VISION
- Johnson & Johnson
- Allergan (Now part of Abbvie)
Notable Milestones in Contact Lens Solutions Market Sector
- June 2022: Bausch + Lomb launched Biotrue Hydration Plus Multi-Purpose Solution in the United States.
- January 2022: Mojo Vision raised USD 45 million for smart contact lens development.
In-Depth Contact Lens Solutions Market Market Outlook
The contact lens solutions market is poised for sustained growth, driven by technological innovation, expanding user base, and increasing awareness of eye health. Strategic partnerships, targeted marketing campaigns, and expansion into emerging markets will further accelerate growth. The potential for integration with smart technology represents a significant long-term opportunity, offering solutions beyond basic hygiene and comfort.
Contact Lens Solutions Market Segmentation
-
1. Solution Type
- 1.1. Multi-Purpose
- 1.2. Hydrogen-Peroxide Based
- 1.3. Others
-
2. Material of Contact Lens
- 2.1. Gas Permeable Lens
- 2.2. Silicon Hydrogel
- 2.3. Others
-
3. Distribution Channel
- 3.1. E-Commerce
- 3.2. Retail
- 3.3. Others
Contact Lens Solutions Market Segmentation By Geography
-
1. North America
- 1.1. United States
- 1.2. Canada
- 1.3. Mexico
-
2. Europe
- 2.1. Germany
- 2.2. United Kingdom
- 2.3. France
- 2.4. Italy
- 2.5. Spain
- 2.6. Rest of Europe
-
3. Asia Pacific
- 3.1. China
- 3.2. Japan
- 3.3. India
- 3.4. Australia
- 3.5. South Korea
- 3.6. Rest of Asia Pacific
-
4. Middle East and Africa
- 4.1. GCC
- 4.2. South Africa
- 4.3. Rest of Middle East and Africa
-
5. South America
- 5.1. Brazil
- 5.2. Argentina
- 5.3. Rest of South America
Contact Lens Solutions Market REPORT HIGHLIGHTS
| Aspects | Details |
|---|---|
| Study Period | 2019-2033 |
| Base Year | 2024 |
| Estimated Year | 2025 |
| Forecast Period | 2025-2033 |
| Historical Period | 2019-2024 |
| Growth Rate | CAGR of 3.66% from 2019-2033 |
| Segmentation |
|
Table of Contents
- 1. Introduction
- 1.1. Research Scope
- 1.2. Market Segmentation
- 1.3. Research Methodology
- 1.4. Definitions and Assumptions
- 2. Executive Summary
- 2.1. Introduction
- 3. Market Dynamics
- 3.1. Introduction
- 3.2. Market Drivers
- 3.2.1. Increasing Adoption of Contact Lens; Increasing Concerns of Eye Infections
- 3.3. Market Restrains
- 3.3.1. Lack of Awareness Regarding Disinfecting Solutions
- 3.4. Market Trends
- 3.4.1. Multi-Purpose Solution is Anticipated to Have Significant Share
- 4. Market Factor Analysis
- 4.1. Porters Five Forces
- 4.2. Supply/Value Chain
- 4.3. PESTEL analysis
- 4.4. Market Entropy
- 4.5. Patent/Trademark Analysis
- 5. Global Contact Lens Solutions Market Analysis, Insights and Forecast, 2019-2031
- 5.1. Market Analysis, Insights and Forecast - by Solution Type
- 5.1.1. Multi-Purpose
- 5.1.2. Hydrogen-Peroxide Based
- 5.1.3. Others
- 5.2. Market Analysis, Insights and Forecast - by Material of Contact Lens
- 5.2.1. Gas Permeable Lens
- 5.2.2. Silicon Hydrogel
- 5.2.3. Others
- 5.3. Market Analysis, Insights and Forecast - by Distribution Channel
- 5.3.1. E-Commerce
- 5.3.2. Retail
- 5.3.3. Others
- 5.4. Market Analysis, Insights and Forecast - by Region
- 5.4.1. North America
- 5.4.2. Europe
- 5.4.3. Asia Pacific
- 5.4.4. Middle East and Africa
- 5.4.5. South America
- 5.1. Market Analysis, Insights and Forecast - by Solution Type
- 6. North America Contact Lens Solutions Market Analysis, Insights and Forecast, 2019-2031
- 6.1. Market Analysis, Insights and Forecast - by Solution Type
- 6.1.1. Multi-Purpose
- 6.1.2. Hydrogen-Peroxide Based
- 6.1.3. Others
- 6.2. Market Analysis, Insights and Forecast - by Material of Contact Lens
- 6.2.1. Gas Permeable Lens
- 6.2.2. Silicon Hydrogel
- 6.2.3. Others
- 6.3. Market Analysis, Insights and Forecast - by Distribution Channel
- 6.3.1. E-Commerce
- 6.3.2. Retail
- 6.3.3. Others
- 6.1. Market Analysis, Insights and Forecast - by Solution Type
- 7. Europe Contact Lens Solutions Market Analysis, Insights and Forecast, 2019-2031
- 7.1. Market Analysis, Insights and Forecast - by Solution Type
- 7.1.1. Multi-Purpose
- 7.1.2. Hydrogen-Peroxide Based
- 7.1.3. Others
- 7.2. Market Analysis, Insights and Forecast - by Material of Contact Lens
- 7.2.1. Gas Permeable Lens
- 7.2.2. Silicon Hydrogel
- 7.2.3. Others
- 7.3. Market Analysis, Insights and Forecast - by Distribution Channel
- 7.3.1. E-Commerce
- 7.3.2. Retail
- 7.3.3. Others
- 7.1. Market Analysis, Insights and Forecast - by Solution Type
- 8. Asia Pacific Contact Lens Solutions Market Analysis, Insights and Forecast, 2019-2031
- 8.1. Market Analysis, Insights and Forecast - by Solution Type
- 8.1.1. Multi-Purpose
- 8.1.2. Hydrogen-Peroxide Based
- 8.1.3. Others
- 8.2. Market Analysis, Insights and Forecast - by Material of Contact Lens
- 8.2.1. Gas Permeable Lens
- 8.2.2. Silicon Hydrogel
- 8.2.3. Others
- 8.3. Market Analysis, Insights and Forecast - by Distribution Channel
- 8.3.1. E-Commerce
- 8.3.2. Retail
- 8.3.3. Others
- 8.1. Market Analysis, Insights and Forecast - by Solution Type
- 9. Middle East and Africa Contact Lens Solutions Market Analysis, Insights and Forecast, 2019-2031
- 9.1. Market Analysis, Insights and Forecast - by Solution Type
- 9.1.1. Multi-Purpose
- 9.1.2. Hydrogen-Peroxide Based
- 9.1.3. Others
- 9.2. Market Analysis, Insights and Forecast - by Material of Contact Lens
- 9.2.1. Gas Permeable Lens
- 9.2.2. Silicon Hydrogel
- 9.2.3. Others
- 9.3. Market Analysis, Insights and Forecast - by Distribution Channel
- 9.3.1. E-Commerce
- 9.3.2. Retail
- 9.3.3. Others
- 9.1. Market Analysis, Insights and Forecast - by Solution Type
- 10. South America Contact Lens Solutions Market Analysis, Insights and Forecast, 2019-2031
- 10.1. Market Analysis, Insights and Forecast - by Solution Type
- 10.1.1. Multi-Purpose
- 10.1.2. Hydrogen-Peroxide Based
- 10.1.3. Others
- 10.2. Market Analysis, Insights and Forecast - by Material of Contact Lens
- 10.2.1. Gas Permeable Lens
- 10.2.2. Silicon Hydrogel
- 10.2.3. Others
- 10.3. Market Analysis, Insights and Forecast - by Distribution Channel
- 10.3.1. E-Commerce
- 10.3.2. Retail
- 10.3.3. Others
- 10.1. Market Analysis, Insights and Forecast - by Solution Type
- 11. North America Contact Lens Solutions Market Analysis, Insights and Forecast, 2019-2031
- 11.1. Market Analysis, Insights and Forecast - By Country/Sub-region
- 11.1.1. undefined
- 12. Europe Contact Lens Solutions Market Analysis, Insights and Forecast, 2019-2031
- 12.1. Market Analysis, Insights and Forecast - By Country/Sub-region
- 12.1.1. undefined
- 13. Asia Pacific Contact Lens Solutions Market Analysis, Insights and Forecast, 2019-2031
- 13.1. Market Analysis, Insights and Forecast - By Country/Sub-region
- 13.1.1. undefined
- 14. Middle East and Africa Contact Lens Solutions Market Analysis, Insights and Forecast, 2019-2031
- 14.1. Market Analysis, Insights and Forecast - By Country/Sub-region
- 14.1.1. undefined
- 15. South America Contact Lens Solutions Market Analysis, Insights and Forecast, 2019-2031
- 15.1. Market Analysis, Insights and Forecast - By Country/Sub-region
- 15.1.1. undefined
- 16. Competitive Analysis
- 16.1. Global Market Share Analysis 2024
- 16.2. Company Profiles
- 16.2.1 Carl Zeiss Meditech AG
- 16.2.1.1. Overview
- 16.2.1.2. Products
- 16.2.1.3. SWOT Analysis
- 16.2.1.4. Recent Developments
- 16.2.1.5. Financials (Based on Availability)
- 16.2.2 CooperVision Inc
- 16.2.2.1. Overview
- 16.2.2.2. Products
- 16.2.2.3. SWOT Analysis
- 16.2.2.4. Recent Developments
- 16.2.2.5. Financials (Based on Availability)
- 16.2.3 FreshKon
- 16.2.3.1. Overview
- 16.2.3.2. Products
- 16.2.3.3. SWOT Analysis
- 16.2.3.4. Recent Developments
- 16.2.3.5. Financials (Based on Availability)
- 16.2.4 Alcol
- 16.2.4.1. Overview
- 16.2.4.2. Products
- 16.2.4.3. SWOT Analysis
- 16.2.4.4. Recent Developments
- 16.2.4.5. Financials (Based on Availability)
- 16.2.5 Hoya Corporation
- 16.2.5.1. Overview
- 16.2.5.2. Products
- 16.2.5.3. SWOT Analysis
- 16.2.5.4. Recent Developments
- 16.2.5.5. Financials (Based on Availability)
- 16.2.6 Bausch & Lomb Incorporated
- 16.2.6.1. Overview
- 16.2.6.2. Products
- 16.2.6.3. SWOT Analysis
- 16.2.6.4. Recent Developments
- 16.2.6.5. Financials (Based on Availability)
- 16.2.7 Menicon Co Ltd
- 16.2.7.1. Overview
- 16.2.7.2. Products
- 16.2.7.3. SWOT Analysis
- 16.2.7.4. Recent Developments
- 16.2.7.5. Financials (Based on Availability)
- 16.2.8 CLB VISION
- 16.2.8.1. Overview
- 16.2.8.2. Products
- 16.2.8.3. SWOT Analysis
- 16.2.8.4. Recent Developments
- 16.2.8.5. Financials (Based on Availability)
- 16.2.9 Johnson & Johnson
- 16.2.9.1. Overview
- 16.2.9.2. Products
- 16.2.9.3. SWOT Analysis
- 16.2.9.4. Recent Developments
- 16.2.9.5. Financials (Based on Availability)
- 16.2.10 Allergan
- 16.2.10.1. Overview
- 16.2.10.2. Products
- 16.2.10.3. SWOT Analysis
- 16.2.10.4. Recent Developments
- 16.2.10.5. Financials (Based on Availability)
- 16.2.1 Carl Zeiss Meditech AG
List of Figures
- Figure 1: Global Contact Lens Solutions Market Revenue Breakdown (Million, %) by Region 2024 & 2032
- Figure 2: Global Contact Lens Solutions Market Volume Breakdown (K Unit, %) by Region 2024 & 2032
- Figure 3: North America Contact Lens Solutions Market Revenue (Million), by Country 2024 & 2032
- Figure 4: North America Contact Lens Solutions Market Volume (K Unit), by Country 2024 & 2032
- Figure 5: North America Contact Lens Solutions Market Revenue Share (%), by Country 2024 & 2032
- Figure 6: North America Contact Lens Solutions Market Volume Share (%), by Country 2024 & 2032
- Figure 7: Europe Contact Lens Solutions Market Revenue (Million), by Country 2024 & 2032
- Figure 8: Europe Contact Lens Solutions Market Volume (K Unit), by Country 2024 & 2032
- Figure 9: Europe Contact Lens Solutions Market Revenue Share (%), by Country 2024 & 2032
- Figure 10: Europe Contact Lens Solutions Market Volume Share (%), by Country 2024 & 2032
- Figure 11: Asia Pacific Contact Lens Solutions Market Revenue (Million), by Country 2024 & 2032
- Figure 12: Asia Pacific Contact Lens Solutions Market Volume (K Unit), by Country 2024 & 2032
- Figure 13: Asia Pacific Contact Lens Solutions Market Revenue Share (%), by Country 2024 & 2032
- Figure 14: Asia Pacific Contact Lens Solutions Market Volume Share (%), by Country 2024 & 2032
- Figure 15: Middle East and Africa Contact Lens Solutions Market Revenue (Million), by Country 2024 & 2032
- Figure 16: Middle East and Africa Contact Lens Solutions Market Volume (K Unit), by Country 2024 & 2032
- Figure 17: Middle East and Africa Contact Lens Solutions Market Revenue Share (%), by Country 2024 & 2032
- Figure 18: Middle East and Africa Contact Lens Solutions Market Volume Share (%), by Country 2024 & 2032
- Figure 19: South America Contact Lens Solutions Market Revenue (Million), by Country 2024 & 2032
- Figure 20: South America Contact Lens Solutions Market Volume (K Unit), by Country 2024 & 2032
- Figure 21: South America Contact Lens Solutions Market Revenue Share (%), by Country 2024 & 2032
- Figure 22: South America Contact Lens Solutions Market Volume Share (%), by Country 2024 & 2032
- Figure 23: North America Contact Lens Solutions Market Revenue (Million), by Solution Type 2024 & 2032
- Figure 24: North America Contact Lens Solutions Market Volume (K Unit), by Solution Type 2024 & 2032
- Figure 25: North America Contact Lens Solutions Market Revenue Share (%), by Solution Type 2024 & 2032
- Figure 26: North America Contact Lens Solutions Market Volume Share (%), by Solution Type 2024 & 2032
- Figure 27: North America Contact Lens Solutions Market Revenue (Million), by Material of Contact Lens 2024 & 2032
- Figure 28: North America Contact Lens Solutions Market Volume (K Unit), by Material of Contact Lens 2024 & 2032
- Figure 29: North America Contact Lens Solutions Market Revenue Share (%), by Material of Contact Lens 2024 & 2032
- Figure 30: North America Contact Lens Solutions Market Volume Share (%), by Material of Contact Lens 2024 & 2032
- Figure 31: North America Contact Lens Solutions Market Revenue (Million), by Distribution Channel 2024 & 2032
- Figure 32: North America Contact Lens Solutions Market Volume (K Unit), by Distribution Channel 2024 & 2032
- Figure 33: North America Contact Lens Solutions Market Revenue Share (%), by Distribution Channel 2024 & 2032
- Figure 34: North America Contact Lens Solutions Market Volume Share (%), by Distribution Channel 2024 & 2032
- Figure 35: North America Contact Lens Solutions Market Revenue (Million), by Country 2024 & 2032
- Figure 36: North America Contact Lens Solutions Market Volume (K Unit), by Country 2024 & 2032
- Figure 37: North America Contact Lens Solutions Market Revenue Share (%), by Country 2024 & 2032
- Figure 38: North America Contact Lens Solutions Market Volume Share (%), by Country 2024 & 2032
- Figure 39: Europe Contact Lens Solutions Market Revenue (Million), by Solution Type 2024 & 2032
- Figure 40: Europe Contact Lens Solutions Market Volume (K Unit), by Solution Type 2024 & 2032
- Figure 41: Europe Contact Lens Solutions Market Revenue Share (%), by Solution Type 2024 & 2032
- Figure 42: Europe Contact Lens Solutions Market Volume Share (%), by Solution Type 2024 & 2032
- Figure 43: Europe Contact Lens Solutions Market Revenue (Million), by Material of Contact Lens 2024 & 2032
- Figure 44: Europe Contact Lens Solutions Market Volume (K Unit), by Material of Contact Lens 2024 & 2032
- Figure 45: Europe Contact Lens Solutions Market Revenue Share (%), by Material of Contact Lens 2024 & 2032
- Figure 46: Europe Contact Lens Solutions Market Volume Share (%), by Material of Contact Lens 2024 & 2032
- Figure 47: Europe Contact Lens Solutions Market Revenue (Million), by Distribution Channel 2024 & 2032
- Figure 48: Europe Contact Lens Solutions Market Volume (K Unit), by Distribution Channel 2024 & 2032
- Figure 49: Europe Contact Lens Solutions Market Revenue Share (%), by Distribution Channel 2024 & 2032
- Figure 50: Europe Contact Lens Solutions Market Volume Share (%), by Distribution Channel 2024 & 2032
- Figure 51: Europe Contact Lens Solutions Market Revenue (Million), by Country 2024 & 2032
- Figure 52: Europe Contact Lens Solutions Market Volume (K Unit), by Country 2024 & 2032
- Figure 53: Europe Contact Lens Solutions Market Revenue Share (%), by Country 2024 & 2032
- Figure 54: Europe Contact Lens Solutions Market Volume Share (%), by Country 2024 & 2032
- Figure 55: Asia Pacific Contact Lens Solutions Market Revenue (Million), by Solution Type 2024 & 2032
- Figure 56: Asia Pacific Contact Lens Solutions Market Volume (K Unit), by Solution Type 2024 & 2032
- Figure 57: Asia Pacific Contact Lens Solutions Market Revenue Share (%), by Solution Type 2024 & 2032
- Figure 58: Asia Pacific Contact Lens Solutions Market Volume Share (%), by Solution Type 2024 & 2032
- Figure 59: Asia Pacific Contact Lens Solutions Market Revenue (Million), by Material of Contact Lens 2024 & 2032
- Figure 60: Asia Pacific Contact Lens Solutions Market Volume (K Unit), by Material of Contact Lens 2024 & 2032
- Figure 61: Asia Pacific Contact Lens Solutions Market Revenue Share (%), by Material of Contact Lens 2024 & 2032
- Figure 62: Asia Pacific Contact Lens Solutions Market Volume Share (%), by Material of Contact Lens 2024 & 2032
- Figure 63: Asia Pacific Contact Lens Solutions Market Revenue (Million), by Distribution Channel 2024 & 2032
- Figure 64: Asia Pacific Contact Lens Solutions Market Volume (K Unit), by Distribution Channel 2024 & 2032
- Figure 65: Asia Pacific Contact Lens Solutions Market Revenue Share (%), by Distribution Channel 2024 & 2032
- Figure 66: Asia Pacific Contact Lens Solutions Market Volume Share (%), by Distribution Channel 2024 & 2032
- Figure 67: Asia Pacific Contact Lens Solutions Market Revenue (Million), by Country 2024 & 2032
- Figure 68: Asia Pacific Contact Lens Solutions Market Volume (K Unit), by Country 2024 & 2032
- Figure 69: Asia Pacific Contact Lens Solutions Market Revenue Share (%), by Country 2024 & 2032
- Figure 70: Asia Pacific Contact Lens Solutions Market Volume Share (%), by Country 2024 & 2032
- Figure 71: Middle East and Africa Contact Lens Solutions Market Revenue (Million), by Solution Type 2024 & 2032
- Figure 72: Middle East and Africa Contact Lens Solutions Market Volume (K Unit), by Solution Type 2024 & 2032
- Figure 73: Middle East and Africa Contact Lens Solutions Market Revenue Share (%), by Solution Type 2024 & 2032
- Figure 74: Middle East and Africa Contact Lens Solutions Market Volume Share (%), by Solution Type 2024 & 2032
- Figure 75: Middle East and Africa Contact Lens Solutions Market Revenue (Million), by Material of Contact Lens 2024 & 2032
- Figure 76: Middle East and Africa Contact Lens Solutions Market Volume (K Unit), by Material of Contact Lens 2024 & 2032
- Figure 77: Middle East and Africa Contact Lens Solutions Market Revenue Share (%), by Material of Contact Lens 2024 & 2032
- Figure 78: Middle East and Africa Contact Lens Solutions Market Volume Share (%), by Material of Contact Lens 2024 & 2032
- Figure 79: Middle East and Africa Contact Lens Solutions Market Revenue (Million), by Distribution Channel 2024 & 2032
- Figure 80: Middle East and Africa Contact Lens Solutions Market Volume (K Unit), by Distribution Channel 2024 & 2032
- Figure 81: Middle East and Africa Contact Lens Solutions Market Revenue Share (%), by Distribution Channel 2024 & 2032
- Figure 82: Middle East and Africa Contact Lens Solutions Market Volume Share (%), by Distribution Channel 2024 & 2032
- Figure 83: Middle East and Africa Contact Lens Solutions Market Revenue (Million), by Country 2024 & 2032
- Figure 84: Middle East and Africa Contact Lens Solutions Market Volume (K Unit), by Country 2024 & 2032
- Figure 85: Middle East and Africa Contact Lens Solutions Market Revenue Share (%), by Country 2024 & 2032
- Figure 86: Middle East and Africa Contact Lens Solutions Market Volume Share (%), by Country 2024 & 2032
- Figure 87: South America Contact Lens Solutions Market Revenue (Million), by Solution Type 2024 & 2032
- Figure 88: South America Contact Lens Solutions Market Volume (K Unit), by Solution Type 2024 & 2032
- Figure 89: South America Contact Lens Solutions Market Revenue Share (%), by Solution Type 2024 & 2032
- Figure 90: South America Contact Lens Solutions Market Volume Share (%), by Solution Type 2024 & 2032
- Figure 91: South America Contact Lens Solutions Market Revenue (Million), by Material of Contact Lens 2024 & 2032
- Figure 92: South America Contact Lens Solutions Market Volume (K Unit), by Material of Contact Lens 2024 & 2032
- Figure 93: South America Contact Lens Solutions Market Revenue Share (%), by Material of Contact Lens 2024 & 2032
- Figure 94: South America Contact Lens Solutions Market Volume Share (%), by Material of Contact Lens 2024 & 2032
- Figure 95: South America Contact Lens Solutions Market Revenue (Million), by Distribution Channel 2024 & 2032
- Figure 96: South America Contact Lens Solutions Market Volume (K Unit), by Distribution Channel 2024 & 2032
- Figure 97: South America Contact Lens Solutions Market Revenue Share (%), by Distribution Channel 2024 & 2032
- Figure 98: South America Contact Lens Solutions Market Volume Share (%), by Distribution Channel 2024 & 2032
- Figure 99: South America Contact Lens Solutions Market Revenue (Million), by Country 2024 & 2032
- Figure 100: South America Contact Lens Solutions Market Volume (K Unit), by Country 2024 & 2032
- Figure 101: South America Contact Lens Solutions Market Revenue Share (%), by Country 2024 & 2032
- Figure 102: South America Contact Lens Solutions Market Volume Share (%), by Country 2024 & 2032
List of Tables
- Table 1: Global Contact Lens Solutions Market Revenue Million Forecast, by Region 2019 & 2032
- Table 2: Global Contact Lens Solutions Market Volume K Unit Forecast, by Region 2019 & 2032
- Table 3: Global Contact Lens Solutions Market Revenue Million Forecast, by Solution Type 2019 & 2032
- Table 4: Global Contact Lens Solutions Market Volume K Unit Forecast, by Solution Type 2019 & 2032
- Table 5: Global Contact Lens Solutions Market Revenue Million Forecast, by Material of Contact Lens 2019 & 2032
- Table 6: Global Contact Lens Solutions Market Volume K Unit Forecast, by Material of Contact Lens 2019 & 2032
- Table 7: Global Contact Lens Solutions Market Revenue Million Forecast, by Distribution Channel 2019 & 2032
- Table 8: Global Contact Lens Solutions Market Volume K Unit Forecast, by Distribution Channel 2019 & 2032
- Table 9: Global Contact Lens Solutions Market Revenue Million Forecast, by Region 2019 & 2032
- Table 10: Global Contact Lens Solutions Market Volume K Unit Forecast, by Region 2019 & 2032
- Table 11: Global Contact Lens Solutions Market Revenue Million Forecast, by Country 2019 & 2032
- Table 12: Global Contact Lens Solutions Market Volume K Unit Forecast, by Country 2019 & 2032
- Table 13: Global Contact Lens Solutions Market Revenue Million Forecast, by Country 2019 & 2032
- Table 14: Global Contact Lens Solutions Market Volume K Unit Forecast, by Country 2019 & 2032
- Table 15: Global Contact Lens Solutions Market Revenue Million Forecast, by Country 2019 & 2032
- Table 16: Global Contact Lens Solutions Market Volume K Unit Forecast, by Country 2019 & 2032
- Table 17: Global Contact Lens Solutions Market Revenue Million Forecast, by Country 2019 & 2032
- Table 18: Global Contact Lens Solutions Market Volume K Unit Forecast, by Country 2019 & 2032
- Table 19: Global Contact Lens Solutions Market Revenue Million Forecast, by Country 2019 & 2032
- Table 20: Global Contact Lens Solutions Market Volume K Unit Forecast, by Country 2019 & 2032
- Table 21: Global Contact Lens Solutions Market Revenue Million Forecast, by Solution Type 2019 & 2032
- Table 22: Global Contact Lens Solutions Market Volume K Unit Forecast, by Solution Type 2019 & 2032
- Table 23: Global Contact Lens Solutions Market Revenue Million Forecast, by Material of Contact Lens 2019 & 2032
- Table 24: Global Contact Lens Solutions Market Volume K Unit Forecast, by Material of Contact Lens 2019 & 2032
- Table 25: Global Contact Lens Solutions Market Revenue Million Forecast, by Distribution Channel 2019 & 2032
- Table 26: Global Contact Lens Solutions Market Volume K Unit Forecast, by Distribution Channel 2019 & 2032
- Table 27: Global Contact Lens Solutions Market Revenue Million Forecast, by Country 2019 & 2032
- Table 28: Global Contact Lens Solutions Market Volume K Unit Forecast, by Country 2019 & 2032
- Table 29: United States Contact Lens Solutions Market Revenue (Million) Forecast, by Application 2019 & 2032
- Table 30: United States Contact Lens Solutions Market Volume (K Unit) Forecast, by Application 2019 & 2032
- Table 31: Canada Contact Lens Solutions Market Revenue (Million) Forecast, by Application 2019 & 2032
- Table 32: Canada Contact Lens Solutions Market Volume (K Unit) Forecast, by Application 2019 & 2032
- Table 33: Mexico Contact Lens Solutions Market Revenue (Million) Forecast, by Application 2019 & 2032
- Table 34: Mexico Contact Lens Solutions Market Volume (K Unit) Forecast, by Application 2019 & 2032
- Table 35: Global Contact Lens Solutions Market Revenue Million Forecast, by Solution Type 2019 & 2032
- Table 36: Global Contact Lens Solutions Market Volume K Unit Forecast, by Solution Type 2019 & 2032
- Table 37: Global Contact Lens Solutions Market Revenue Million Forecast, by Material of Contact Lens 2019 & 2032
- Table 38: Global Contact Lens Solutions Market Volume K Unit Forecast, by Material of Contact Lens 2019 & 2032
- Table 39: Global Contact Lens Solutions Market Revenue Million Forecast, by Distribution Channel 2019 & 2032
- Table 40: Global Contact Lens Solutions Market Volume K Unit Forecast, by Distribution Channel 2019 & 2032
- Table 41: Global Contact Lens Solutions Market Revenue Million Forecast, by Country 2019 & 2032
- Table 42: Global Contact Lens Solutions Market Volume K Unit Forecast, by Country 2019 & 2032
- Table 43: Germany Contact Lens Solutions Market Revenue (Million) Forecast, by Application 2019 & 2032
- Table 44: Germany Contact Lens Solutions Market Volume (K Unit) Forecast, by Application 2019 & 2032
- Table 45: United Kingdom Contact Lens Solutions Market Revenue (Million) Forecast, by Application 2019 & 2032
- Table 46: United Kingdom Contact Lens Solutions Market Volume (K Unit) Forecast, by Application 2019 & 2032
- Table 47: France Contact Lens Solutions Market Revenue (Million) Forecast, by Application 2019 & 2032
- Table 48: France Contact Lens Solutions Market Volume (K Unit) Forecast, by Application 2019 & 2032
- Table 49: Italy Contact Lens Solutions Market Revenue (Million) Forecast, by Application 2019 & 2032
- Table 50: Italy Contact Lens Solutions Market Volume (K Unit) Forecast, by Application 2019 & 2032
- Table 51: Spain Contact Lens Solutions Market Revenue (Million) Forecast, by Application 2019 & 2032
- Table 52: Spain Contact Lens Solutions Market Volume (K Unit) Forecast, by Application 2019 & 2032
- Table 53: Rest of Europe Contact Lens Solutions Market Revenue (Million) Forecast, by Application 2019 & 2032
- Table 54: Rest of Europe Contact Lens Solutions Market Volume (K Unit) Forecast, by Application 2019 & 2032
- Table 55: Global Contact Lens Solutions Market Revenue Million Forecast, by Solution Type 2019 & 2032
- Table 56: Global Contact Lens Solutions Market Volume K Unit Forecast, by Solution Type 2019 & 2032
- Table 57: Global Contact Lens Solutions Market Revenue Million Forecast, by Material of Contact Lens 2019 & 2032
- Table 58: Global Contact Lens Solutions Market Volume K Unit Forecast, by Material of Contact Lens 2019 & 2032
- Table 59: Global Contact Lens Solutions Market Revenue Million Forecast, by Distribution Channel 2019 & 2032
- Table 60: Global Contact Lens Solutions Market Volume K Unit Forecast, by Distribution Channel 2019 & 2032
- Table 61: Global Contact Lens Solutions Market Revenue Million Forecast, by Country 2019 & 2032
- Table 62: Global Contact Lens Solutions Market Volume K Unit Forecast, by Country 2019 & 2032
- Table 63: China Contact Lens Solutions Market Revenue (Million) Forecast, by Application 2019 & 2032
- Table 64: China Contact Lens Solutions Market Volume (K Unit) Forecast, by Application 2019 & 2032
- Table 65: Japan Contact Lens Solutions Market Revenue (Million) Forecast, by Application 2019 & 2032
- Table 66: Japan Contact Lens Solutions Market Volume (K Unit) Forecast, by Application 2019 & 2032
- Table 67: India Contact Lens Solutions Market Revenue (Million) Forecast, by Application 2019 & 2032
- Table 68: India Contact Lens Solutions Market Volume (K Unit) Forecast, by Application 2019 & 2032
- Table 69: Australia Contact Lens Solutions Market Revenue (Million) Forecast, by Application 2019 & 2032
- Table 70: Australia Contact Lens Solutions Market Volume (K Unit) Forecast, by Application 2019 & 2032
- Table 71: South Korea Contact Lens Solutions Market Revenue (Million) Forecast, by Application 2019 & 2032
- Table 72: South Korea Contact Lens Solutions Market Volume (K Unit) Forecast, by Application 2019 & 2032
- Table 73: Rest of Asia Pacific Contact Lens Solutions Market Revenue (Million) Forecast, by Application 2019 & 2032
- Table 74: Rest of Asia Pacific Contact Lens Solutions Market Volume (K Unit) Forecast, by Application 2019 & 2032
- Table 75: Global Contact Lens Solutions Market Revenue Million Forecast, by Solution Type 2019 & 2032
- Table 76: Global Contact Lens Solutions Market Volume K Unit Forecast, by Solution Type 2019 & 2032
- Table 77: Global Contact Lens Solutions Market Revenue Million Forecast, by Material of Contact Lens 2019 & 2032
- Table 78: Global Contact Lens Solutions Market Volume K Unit Forecast, by Material of Contact Lens 2019 & 2032
- Table 79: Global Contact Lens Solutions Market Revenue Million Forecast, by Distribution Channel 2019 & 2032
- Table 80: Global Contact Lens Solutions Market Volume K Unit Forecast, by Distribution Channel 2019 & 2032
- Table 81: Global Contact Lens Solutions Market Revenue Million Forecast, by Country 2019 & 2032
- Table 82: Global Contact Lens Solutions Market Volume K Unit Forecast, by Country 2019 & 2032
- Table 83: GCC Contact Lens Solutions Market Revenue (Million) Forecast, by Application 2019 & 2032
- Table 84: GCC Contact Lens Solutions Market Volume (K Unit) Forecast, by Application 2019 & 2032
- Table 85: South Africa Contact Lens Solutions Market Revenue (Million) Forecast, by Application 2019 & 2032
- Table 86: South Africa Contact Lens Solutions Market Volume (K Unit) Forecast, by Application 2019 & 2032
- Table 87: Rest of Middle East and Africa Contact Lens Solutions Market Revenue (Million) Forecast, by Application 2019 & 2032
- Table 88: Rest of Middle East and Africa Contact Lens Solutions Market Volume (K Unit) Forecast, by Application 2019 & 2032
- Table 89: Global Contact Lens Solutions Market Revenue Million Forecast, by Solution Type 2019 & 2032
- Table 90: Global Contact Lens Solutions Market Volume K Unit Forecast, by Solution Type 2019 & 2032
- Table 91: Global Contact Lens Solutions Market Revenue Million Forecast, by Material of Contact Lens 2019 & 2032
- Table 92: Global Contact Lens Solutions Market Volume K Unit Forecast, by Material of Contact Lens 2019 & 2032
- Table 93: Global Contact Lens Solutions Market Revenue Million Forecast, by Distribution Channel 2019 & 2032
- Table 94: Global Contact Lens Solutions Market Volume K Unit Forecast, by Distribution Channel 2019 & 2032
- Table 95: Global Contact Lens Solutions Market Revenue Million Forecast, by Country 2019 & 2032
- Table 96: Global Contact Lens Solutions Market Volume K Unit Forecast, by Country 2019 & 2032
- Table 97: Brazil Contact Lens Solutions Market Revenue (Million) Forecast, by Application 2019 & 2032
- Table 98: Brazil Contact Lens Solutions Market Volume (K Unit) Forecast, by Application 2019 & 2032
- Table 99: Argentina Contact Lens Solutions Market Revenue (Million) Forecast, by Application 2019 & 2032
- Table 100: Argentina Contact Lens Solutions Market Volume (K Unit) Forecast, by Application 2019 & 2032
- Table 101: Rest of South America Contact Lens Solutions Market Revenue (Million) Forecast, by Application 2019 & 2032
- Table 102: Rest of South America Contact Lens Solutions Market Volume (K Unit) Forecast, by Application 2019 & 2032
Frequently Asked Questions
1. What is the projected Compound Annual Growth Rate (CAGR) of the Contact Lens Solutions Market?
The projected CAGR is approximately 3.66%.
2. Which companies are prominent players in the Contact Lens Solutions Market?
Key companies in the market include Carl Zeiss Meditech AG, CooperVision Inc, FreshKon, Alcol, Hoya Corporation, Bausch & Lomb Incorporated, Menicon Co Ltd, CLB VISION, Johnson & Johnson, Allergan.
3. What are the main segments of the Contact Lens Solutions Market?
The market segments include Solution Type, Material of Contact Lens, Distribution Channel.
4. Can you provide details about the market size?
The market size is estimated to be USD 10.23 Million as of 2022.
5. What are some drivers contributing to market growth?
Increasing Adoption of Contact Lens; Increasing Concerns of Eye Infections.
6. What are the notable trends driving market growth?
Multi-Purpose Solution is Anticipated to Have Significant Share.
7. Are there any restraints impacting market growth?
Lack of Awareness Regarding Disinfecting Solutions.
8. Can you provide examples of recent developments in the market?
In June 2022, Bausch + Lomb launched a newest product under the BioTrue Multi-Purpose Solution brand, Biotrue Hydration Plus Multi-Purpose Solution, in the United States.
9. What pricing options are available for accessing the report?
Pricing options include single-user, multi-user, and enterprise licenses priced at USD 4750, USD 5250, and USD 8750 respectively.
10. Is the market size provided in terms of value or volume?
The market size is provided in terms of value, measured in Million and volume, measured in K Unit.
11. Are there any specific market keywords associated with the report?
Yes, the market keyword associated with the report is "Contact Lens Solutions Market," which aids in identifying and referencing the specific market segment covered.
12. How do I determine which pricing option suits my needs best?
The pricing options vary based on user requirements and access needs. Individual users may opt for single-user licenses, while businesses requiring broader access may choose multi-user or enterprise licenses for cost-effective access to the report.
13. Are there any additional resources or data provided in the Contact Lens Solutions Market report?
While the report offers comprehensive insights, it's advisable to review the specific contents or supplementary materials provided to ascertain if additional resources or data are available.
14. How can I stay updated on further developments or reports in the Contact Lens Solutions Market?
To stay informed about further developments, trends, and reports in the Contact Lens Solutions Market, consider subscribing to industry newsletters, following relevant companies and organizations, or regularly checking reputable industry news sources and publications.
Methodology
Step 1 - Identification of Relevant Samples Size from Population Database


Step 2 - Approaches for Defining Global Market Size (Value, Volume* & Price*)

Note*: In applicable scenarios
Step 3 - Data Sources
Primary Research
- Web Analytics
- Survey Reports
- Research Institute
- Latest Research Reports
- Opinion Leaders
Secondary Research
- Annual Reports
- White Paper
- Latest Press Release
- Industry Association
- Paid Database
- Investor Presentations

Step 4 - Data Triangulation
Involves using different sources of information in order to increase the validity of a study
These sources are likely to be stakeholders in a program - participants, other researchers, program staff, other community members, and so on.
Then we put all data in single framework & apply various statistical tools to find out the dynamic on the market.
During the analysis stage, feedback from the stakeholder groups would be compared to determine areas of agreement as well as areas of divergence
