

Key Insights
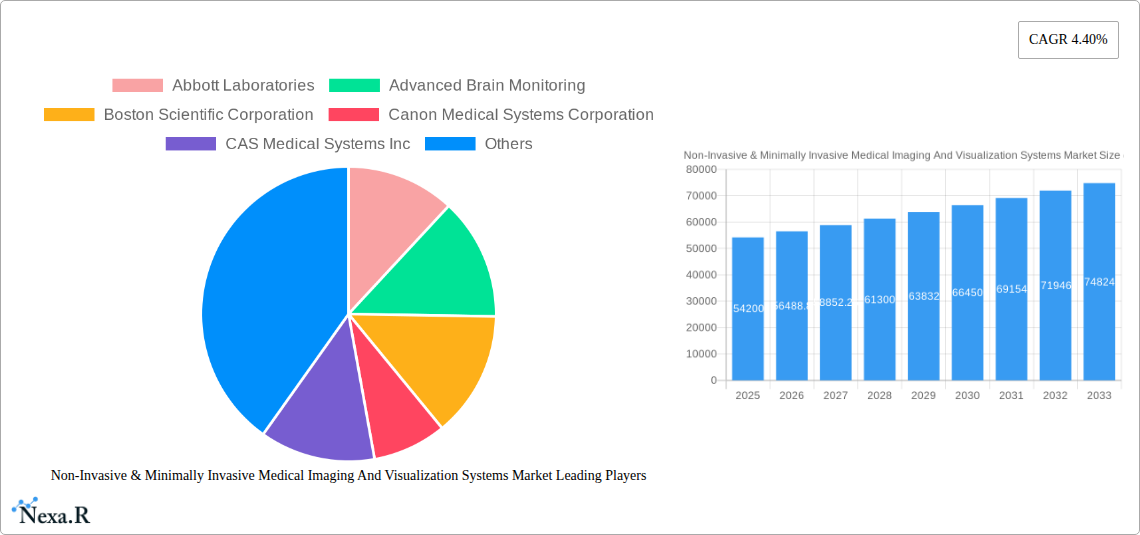
The Non-Invasive & Minimally Invasive Medical Imaging and Visualization Systems market is experiencing robust growth, projected to reach a market size of $54.20 billion in 2025, expanding at a Compound Annual Growth Rate (CAGR) of 4.40% from 2025 to 2033. This expansion is fueled by several key drivers. The increasing prevalence of chronic diseases necessitates advanced diagnostic tools, driving demand for minimally invasive procedures that reduce patient recovery times and hospital stays. Technological advancements, such as improved image resolution, enhanced portability, and AI-powered image analysis, are continuously improving the accuracy and efficiency of these systems. Furthermore, a rising geriatric population, requiring more frequent medical imaging, significantly contributes to market growth. The market is segmented by modality (e.g., ultrasound, endoscopy, MRI, CT), application (e.g., cardiology, oncology, neurology), and end-user (hospitals, clinics, ambulatory surgical centers). Competitive rivalry amongst leading players like Abbott Laboratories, Medtronic, and Philips drives innovation and accessibility. While regulatory hurdles and high initial investment costs could pose some challenges, the long-term benefits in terms of improved patient care and reduced healthcare costs are expected to outweigh these restraints.
The forecast period of 2025-2033 anticipates continued growth driven by factors such as the development of more sophisticated and user-friendly systems. The integration of advanced analytics and artificial intelligence (AI) will likely further enhance diagnostic capabilities and streamline workflows. Expanding healthcare infrastructure in emerging economies, coupled with rising disposable incomes in these regions, presents significant growth opportunities. Market players are focusing on strategic partnerships, collaborations, and product launches to maintain a competitive edge in this dynamic market. The adoption of telemedicine and remote patient monitoring is also expected to influence the market, creating demand for portable and wireless imaging systems. While the market faces challenges, the overall outlook remains positive, predicting sustained growth and expansion across various segments and geographical regions.
Non-Invasive & Minimally Invasive Medical Imaging and Visualization Systems Market Report: 2019-2033
This comprehensive report provides a detailed analysis of the Non-Invasive & Minimally Invasive Medical Imaging and Visualization Systems market, encompassing market dynamics, growth trends, regional dominance, product landscape, key players, and future outlook. The study period covers 2019-2033, with a base year of 2025 and a forecast period of 2025-2033. The parent market is Medical Imaging Systems, while this report focuses on the child market of Non-Invasive & Minimally Invasive Imaging Systems. The market size is projected to reach xx Million by 2033.
Non-Invasive & Minimally Invasive Medical Imaging And Visualization Systems Market Market Dynamics & Structure
This section analyzes the market's competitive landscape, technological advancements, regulatory influences, and market consolidation activities. The market is characterized by a moderately concentrated structure, with key players holding significant market share. However, the entry of new players with innovative technologies is continuously reshaping the competitive dynamics.
- Market Concentration: The top 5 players hold approximately xx% of the global market share in 2025.
- Technological Innovation Drivers: Advancements in AI, machine learning, and miniaturization are driving the adoption of minimally invasive imaging techniques.
- Regulatory Frameworks: Stringent regulatory approvals and compliance requirements influence market entry and product development.
- Competitive Product Substitutes: The emergence of alternative diagnostic methods poses a moderate threat to market growth.
- End-User Demographics: The aging global population and increasing prevalence of chronic diseases fuel demand for advanced imaging systems.
- M&A Trends: The number of M&A deals in the sector averaged xx per year during the historical period (2019-2024), indicating a high level of consolidation. This trend is expected to continue, driven by the desire for larger players to expand their product portfolios and gain access to new technologies. Innovation barriers include high R&D costs, stringent regulatory pathways, and the need for skilled professionals.
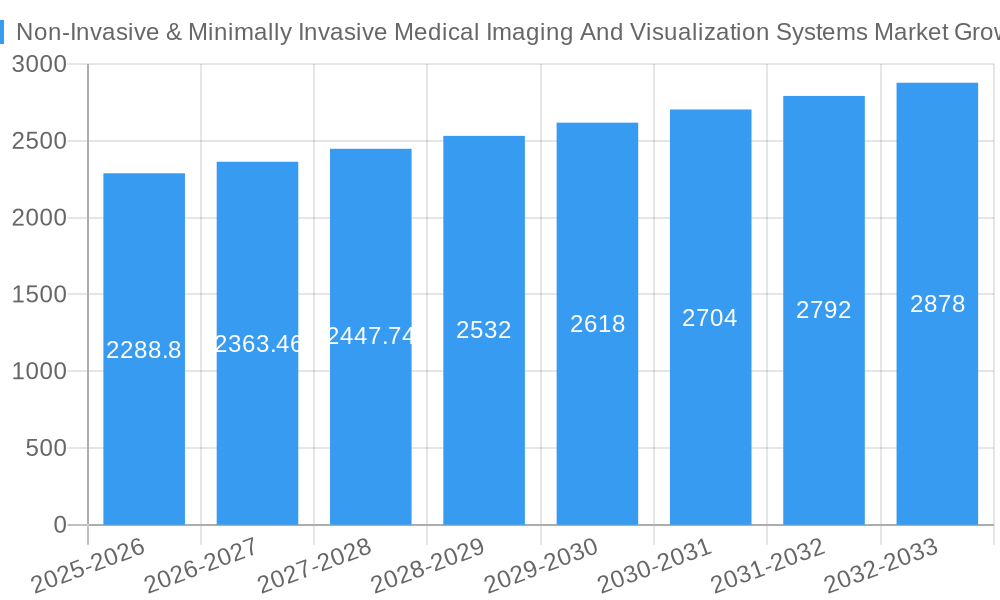
Non-Invasive & Minimally Invasive Medical Imaging And Visualization Systems Market Growth Trends & Insights
The Non-Invasive & Minimally Invasive Medical Imaging and Visualization Systems market experienced robust growth during the historical period (2019-2024), driven primarily by technological advancements and increasing healthcare spending. The market size is estimated at xx Million in 2025 and is projected to exhibit a CAGR of xx% during the forecast period (2025-2033). This growth is attributed to several factors, including rising adoption rates of minimally invasive procedures, increasing demand for advanced imaging solutions in various healthcare settings, and the growing prevalence of chronic diseases. Technological disruptions, such as the integration of AI and machine learning in image analysis, are further accelerating market expansion. Consumer behavior shifts, including a preference for less invasive procedures with quicker recovery times, also contribute significantly to market growth. Market penetration of advanced imaging technologies varies across different regions and healthcare settings, with developed markets exhibiting higher penetration rates than emerging markets.
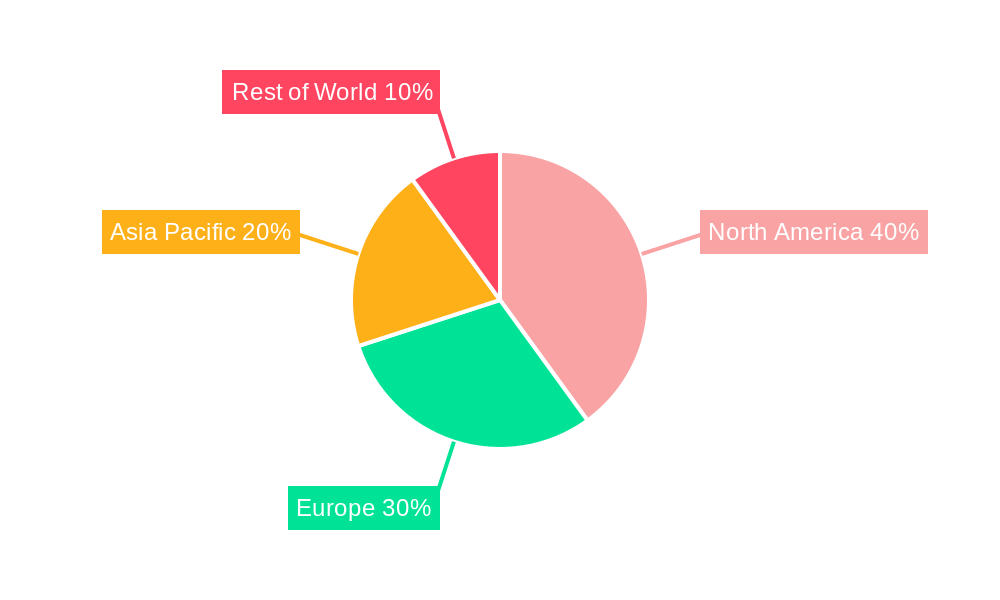
Dominant Regions, Countries, or Segments in Non-Invasive & Minimally Invasive Medical Imaging And Visualization Systems Market
North America currently dominates the Non-Invasive & Minimally Invasive Medical Imaging and Visualization Systems market, followed by Europe and Asia Pacific. This dominance stems from factors such as high healthcare expenditure, advanced healthcare infrastructure, and early adoption of new technologies.
- North America: High prevalence of chronic diseases, advanced healthcare infrastructure, and strong regulatory frameworks contribute to high market penetration.
- Europe: Growing demand for minimally invasive procedures and increasing investments in healthcare infrastructure drive market growth.
- Asia Pacific: Rapid economic growth, rising healthcare expenditure, and increasing awareness about advanced diagnostic techniques are fueling market expansion. However, the market is fragmented, with regional variations in adoption rates.
The significant market share and growth potential make North America the leading region, but Asia Pacific is projected to exhibit faster growth in the coming years.
Non-Invasive & Minimally Invasive Medical Imaging And Visualization Systems Market Product Landscape
The market offers a diverse range of products, including ultrasound systems, MRI machines, CT scanners, and endoscopy systems, each with unique features and applications. Recent innovations have focused on improving image quality, reducing procedure time, and enhancing patient comfort. Technological advancements, such as AI-powered image analysis and robotic assistance, are enhancing the efficiency and accuracy of minimally invasive procedures. Unique selling propositions include improved diagnostic capabilities, reduced invasiveness, and faster recovery times.
Key Drivers, Barriers & Challenges in Non-Invasive & Minimally Invasive Medical Imaging And Visualization Systems Market
Key Drivers: Technological advancements (e.g., AI-powered image analysis, miniaturization), increasing prevalence of chronic diseases, rising healthcare expenditure, and government initiatives supporting advanced medical technologies.
Challenges: High cost of equipment and maintenance, stringent regulatory approvals, skilled personnel shortage, and intense competition among established players. Supply chain disruptions (estimated impact: xx% decrease in production during periods of disruption) and regulatory hurdles (estimated impact: xx months delay in product launch) significantly impact market growth.
Emerging Opportunities in Non-Invasive & Minimally Invasive Medical Imaging And Visualization Systems Market
Emerging opportunities include the increasing adoption of point-of-care imaging solutions, the expansion of minimally invasive procedures into new therapeutic areas, and the development of AI-powered diagnostic tools. Untapped markets in developing countries, particularly in Africa and South America, present significant growth potential.
Growth Accelerators in the Non-Invasive & Minimally Invasive Medical Imaging And Visualization Systems Market Industry
Long-term growth will be fueled by technological breakthroughs in image processing, the development of portable and wireless imaging systems, and strategic partnerships between technology providers and healthcare institutions. Expanding into emerging markets through targeted marketing campaigns and localized distribution networks will also drive expansion.
Key Players Shaping the Non-Invasive & Minimally Invasive Medical Imaging And Visualization Systems Market Market
- Abbott Laboratories
- Advanced Brain Monitoring
- Boston Scientific Corporation
- Canon Medical Systems Corporation
- CAS Medical Systems Inc
- CNSystems Medizintechnik GmbH
- Fujifilm Holdings Corporation
- GE Healthcare
- Koninklijke Philips N V
- Medtronic plc
- Siemens Healthineers AG
- Smith & Nephew plc
- List Not Exhaustive
Notable Milestones in Non-Invasive & Minimally Invasive Medical Imaging And Visualization Systems Market Sector
- February 2024: Siemens Healthineers launched its Magnetom Flow, a virtually helium-free 1.5T MRI platform, significantly reducing operational costs and environmental impact.
- January 2024: Canon Medical Systems Corporation and Olympus Corporation partnered to develop and market endoscopic ultrasound systems, strengthening their market position in this segment.
In-Depth Non-Invasive & Minimally Invasive Medical Imaging And Visualization Systems Market Market Outlook
The future of the Non-Invasive & Minimally Invasive Medical Imaging and Visualization Systems market is bright, driven by continued technological advancements, increasing healthcare spending, and the growing adoption of minimally invasive procedures. Strategic partnerships, acquisitions, and expansion into untapped markets will be crucial for achieving long-term growth. The market is poised for significant expansion, driven by the convergence of technological innovation and unmet medical needs.
Non-Invasive & Minimally Invasive Medical Imaging And Visualization Systems Market Segmentation
-
1. Type
-
1.1. Non-Invasive Imaging
- 1.1.1. X-ray Imaging
- 1.1.2. Ultrasound Imaging
- 1.1.3. Magnetic Resonance Imaging (MRI)
- 1.1.4. Computed Tomography Imaging
- 1.1.5. Others
-
1.2. Minimally Invasive Imaging
- 1.2.1. Endoscopy
- 1.2.2. Laparoscopy
-
1.1. Non-Invasive Imaging
-
2. Portability
- 2.1. Fixed Devices
- 2.2. Portable Devices
-
3. Applications
- 3.1. Orthopedics
- 3.2. Cardiology
- 3.3. Oncology
- 3.4. Other Applications
-
4. End User
- 4.1. Hospitals and Clinics
- 4.2. Diagnostic Centers
- 4.3. Other End User
Non-Invasive & Minimally Invasive Medical Imaging And Visualization Systems Market Segmentation By Geography
-
1. North America
- 1.1. United States
- 1.2. Canada
- 1.3. Mexico
-
2. Europe
- 2.1. Germany
- 2.2. United Kingdom
- 2.3. France
- 2.4. Italy
- 2.5. Spain
- 2.6. Rest of Europe
-
3. Asia Pacific
- 3.1. China
- 3.2. Japan
- 3.3. India
- 3.4. Australia
- 3.5. South Korea
- 3.6. Rest of Asia Pacific
-
4. Middle East and Africa
- 4.1. GCC
- 4.2. South Africa
- 4.3. Rest of Middle East and Africa
-
5. South America
- 5.1. Brazil
- 5.2. Argentina
- 5.3. Rest of South America
Non-Invasive & Minimally Invasive Medical Imaging And Visualization Systems Market REPORT HIGHLIGHTS
| Aspects | Details |
|---|---|
| Study Period | 2019-2033 |
| Base Year | 2024 |
| Estimated Year | 2025 |
| Forecast Period | 2025-2033 |
| Historical Period | 2019-2024 |
| Growth Rate | CAGR of 4.40% from 2019-2033 |
| Segmentation |
|
Table of Contents
- 1. Introduction
- 1.1. Research Scope
- 1.2. Market Segmentation
- 1.3. Research Methodology
- 1.4. Definitions and Assumptions
- 2. Executive Summary
- 2.1. Introduction
- 3. Market Dynamics
- 3.1. Introduction
- 3.2. Market Drivers
- 3.2.1. Continuous Innovations in Imaging Technologies; Rising Prevalence of Chronic Diseases Coupled with Aging Population; Growing Preference Among Patients for Minimally Invasive Procedures
- 3.3. Market Restrains
- 3.3.1. Continuous Innovations in Imaging Technologies; Rising Prevalence of Chronic Diseases Coupled with Aging Population; Growing Preference Among Patients for Minimally Invasive Procedures
- 3.4. Market Trends
- 3.4.1. The Ultrasound Segment is Expected to Hold a Significant Share Over the Forecast Period
- 4. Market Factor Analysis
- 4.1. Porters Five Forces
- 4.2. Supply/Value Chain
- 4.3. PESTEL analysis
- 4.4. Market Entropy
- 4.5. Patent/Trademark Analysis
- 5. Global Non-Invasive & Minimally Invasive Medical Imaging And Visualization Systems Market Analysis, Insights and Forecast, 2019-2031
- 5.1. Market Analysis, Insights and Forecast - by Type
- 5.1.1. Non-Invasive Imaging
- 5.1.1.1. X-ray Imaging
- 5.1.1.2. Ultrasound Imaging
- 5.1.1.3. Magnetic Resonance Imaging (MRI)
- 5.1.1.4. Computed Tomography Imaging
- 5.1.1.5. Others
- 5.1.2. Minimally Invasive Imaging
- 5.1.2.1. Endoscopy
- 5.1.2.2. Laparoscopy
- 5.1.1. Non-Invasive Imaging
- 5.2. Market Analysis, Insights and Forecast - by Portability
- 5.2.1. Fixed Devices
- 5.2.2. Portable Devices
- 5.3. Market Analysis, Insights and Forecast - by Applications
- 5.3.1. Orthopedics
- 5.3.2. Cardiology
- 5.3.3. Oncology
- 5.3.4. Other Applications
- 5.4. Market Analysis, Insights and Forecast - by End User
- 5.4.1. Hospitals and Clinics
- 5.4.2. Diagnostic Centers
- 5.4.3. Other End User
- 5.5. Market Analysis, Insights and Forecast - by Region
- 5.5.1. North America
- 5.5.2. Europe
- 5.5.3. Asia Pacific
- 5.5.4. Middle East and Africa
- 5.5.5. South America
- 5.1. Market Analysis, Insights and Forecast - by Type
- 6. North America Non-Invasive & Minimally Invasive Medical Imaging And Visualization Systems Market Analysis, Insights and Forecast, 2019-2031
- 6.1. Market Analysis, Insights and Forecast - by Type
- 6.1.1. Non-Invasive Imaging
- 6.1.1.1. X-ray Imaging
- 6.1.1.2. Ultrasound Imaging
- 6.1.1.3. Magnetic Resonance Imaging (MRI)
- 6.1.1.4. Computed Tomography Imaging
- 6.1.1.5. Others
- 6.1.2. Minimally Invasive Imaging
- 6.1.2.1. Endoscopy
- 6.1.2.2. Laparoscopy
- 6.1.1. Non-Invasive Imaging
- 6.2. Market Analysis, Insights and Forecast - by Portability
- 6.2.1. Fixed Devices
- 6.2.2. Portable Devices
- 6.3. Market Analysis, Insights and Forecast - by Applications
- 6.3.1. Orthopedics
- 6.3.2. Cardiology
- 6.3.3. Oncology
- 6.3.4. Other Applications
- 6.4. Market Analysis, Insights and Forecast - by End User
- 6.4.1. Hospitals and Clinics
- 6.4.2. Diagnostic Centers
- 6.4.3. Other End User
- 6.1. Market Analysis, Insights and Forecast - by Type
- 7. Europe Non-Invasive & Minimally Invasive Medical Imaging And Visualization Systems Market Analysis, Insights and Forecast, 2019-2031
- 7.1. Market Analysis, Insights and Forecast - by Type
- 7.1.1. Non-Invasive Imaging
- 7.1.1.1. X-ray Imaging
- 7.1.1.2. Ultrasound Imaging
- 7.1.1.3. Magnetic Resonance Imaging (MRI)
- 7.1.1.4. Computed Tomography Imaging
- 7.1.1.5. Others
- 7.1.2. Minimally Invasive Imaging
- 7.1.2.1. Endoscopy
- 7.1.2.2. Laparoscopy
- 7.1.1. Non-Invasive Imaging
- 7.2. Market Analysis, Insights and Forecast - by Portability
- 7.2.1. Fixed Devices
- 7.2.2. Portable Devices
- 7.3. Market Analysis, Insights and Forecast - by Applications
- 7.3.1. Orthopedics
- 7.3.2. Cardiology
- 7.3.3. Oncology
- 7.3.4. Other Applications
- 7.4. Market Analysis, Insights and Forecast - by End User
- 7.4.1. Hospitals and Clinics
- 7.4.2. Diagnostic Centers
- 7.4.3. Other End User
- 7.1. Market Analysis, Insights and Forecast - by Type
- 8. Asia Pacific Non-Invasive & Minimally Invasive Medical Imaging And Visualization Systems Market Analysis, Insights and Forecast, 2019-2031
- 8.1. Market Analysis, Insights and Forecast - by Type
- 8.1.1. Non-Invasive Imaging
- 8.1.1.1. X-ray Imaging
- 8.1.1.2. Ultrasound Imaging
- 8.1.1.3. Magnetic Resonance Imaging (MRI)
- 8.1.1.4. Computed Tomography Imaging
- 8.1.1.5. Others
- 8.1.2. Minimally Invasive Imaging
- 8.1.2.1. Endoscopy
- 8.1.2.2. Laparoscopy
- 8.1.1. Non-Invasive Imaging
- 8.2. Market Analysis, Insights and Forecast - by Portability
- 8.2.1. Fixed Devices
- 8.2.2. Portable Devices
- 8.3. Market Analysis, Insights and Forecast - by Applications
- 8.3.1. Orthopedics
- 8.3.2. Cardiology
- 8.3.3. Oncology
- 8.3.4. Other Applications
- 8.4. Market Analysis, Insights and Forecast - by End User
- 8.4.1. Hospitals and Clinics
- 8.4.2. Diagnostic Centers
- 8.4.3. Other End User
- 8.1. Market Analysis, Insights and Forecast - by Type
- 9. Middle East and Africa Non-Invasive & Minimally Invasive Medical Imaging And Visualization Systems Market Analysis, Insights and Forecast, 2019-2031
- 9.1. Market Analysis, Insights and Forecast - by Type
- 9.1.1. Non-Invasive Imaging
- 9.1.1.1. X-ray Imaging
- 9.1.1.2. Ultrasound Imaging
- 9.1.1.3. Magnetic Resonance Imaging (MRI)
- 9.1.1.4. Computed Tomography Imaging
- 9.1.1.5. Others
- 9.1.2. Minimally Invasive Imaging
- 9.1.2.1. Endoscopy
- 9.1.2.2. Laparoscopy
- 9.1.1. Non-Invasive Imaging
- 9.2. Market Analysis, Insights and Forecast - by Portability
- 9.2.1. Fixed Devices
- 9.2.2. Portable Devices
- 9.3. Market Analysis, Insights and Forecast - by Applications
- 9.3.1. Orthopedics
- 9.3.2. Cardiology
- 9.3.3. Oncology
- 9.3.4. Other Applications
- 9.4. Market Analysis, Insights and Forecast - by End User
- 9.4.1. Hospitals and Clinics
- 9.4.2. Diagnostic Centers
- 9.4.3. Other End User
- 9.1. Market Analysis, Insights and Forecast - by Type
- 10. South America Non-Invasive & Minimally Invasive Medical Imaging And Visualization Systems Market Analysis, Insights and Forecast, 2019-2031
- 10.1. Market Analysis, Insights and Forecast - by Type
- 10.1.1. Non-Invasive Imaging
- 10.1.1.1. X-ray Imaging
- 10.1.1.2. Ultrasound Imaging
- 10.1.1.3. Magnetic Resonance Imaging (MRI)
- 10.1.1.4. Computed Tomography Imaging
- 10.1.1.5. Others
- 10.1.2. Minimally Invasive Imaging
- 10.1.2.1. Endoscopy
- 10.1.2.2. Laparoscopy
- 10.1.1. Non-Invasive Imaging
- 10.2. Market Analysis, Insights and Forecast - by Portability
- 10.2.1. Fixed Devices
- 10.2.2. Portable Devices
- 10.3. Market Analysis, Insights and Forecast - by Applications
- 10.3.1. Orthopedics
- 10.3.2. Cardiology
- 10.3.3. Oncology
- 10.3.4. Other Applications
- 10.4. Market Analysis, Insights and Forecast - by End User
- 10.4.1. Hospitals and Clinics
- 10.4.2. Diagnostic Centers
- 10.4.3. Other End User
- 10.1. Market Analysis, Insights and Forecast - by Type
- 11. Competitive Analysis
- 11.1. Global Market Share Analysis 2024
- 11.2. Company Profiles
- 11.2.1 Abbott Laboratories
- 11.2.1.1. Overview
- 11.2.1.2. Products
- 11.2.1.3. SWOT Analysis
- 11.2.1.4. Recent Developments
- 11.2.1.5. Financials (Based on Availability)
- 11.2.2 Advanced Brain Monitoring
- 11.2.2.1. Overview
- 11.2.2.2. Products
- 11.2.2.3. SWOT Analysis
- 11.2.2.4. Recent Developments
- 11.2.2.5. Financials (Based on Availability)
- 11.2.3 Boston Scientific Corporation
- 11.2.3.1. Overview
- 11.2.3.2. Products
- 11.2.3.3. SWOT Analysis
- 11.2.3.4. Recent Developments
- 11.2.3.5. Financials (Based on Availability)
- 11.2.4 Canon Medical Systems Corporation
- 11.2.4.1. Overview
- 11.2.4.2. Products
- 11.2.4.3. SWOT Analysis
- 11.2.4.4. Recent Developments
- 11.2.4.5. Financials (Based on Availability)
- 11.2.5 CAS Medical Systems Inc
- 11.2.5.1. Overview
- 11.2.5.2. Products
- 11.2.5.3. SWOT Analysis
- 11.2.5.4. Recent Developments
- 11.2.5.5. Financials (Based on Availability)
- 11.2.6 CNSystems Medizintechnik GmbH
- 11.2.6.1. Overview
- 11.2.6.2. Products
- 11.2.6.3. SWOT Analysis
- 11.2.6.4. Recent Developments
- 11.2.6.5. Financials (Based on Availability)
- 11.2.7 Fujifilm Holdings Corporation
- 11.2.7.1. Overview
- 11.2.7.2. Products
- 11.2.7.3. SWOT Analysis
- 11.2.7.4. Recent Developments
- 11.2.7.5. Financials (Based on Availability)
- 11.2.8 GE Healthcare
- 11.2.8.1. Overview
- 11.2.8.2. Products
- 11.2.8.3. SWOT Analysis
- 11.2.8.4. Recent Developments
- 11.2.8.5. Financials (Based on Availability)
- 11.2.9 Koninklijke Philips N V
- 11.2.9.1. Overview
- 11.2.9.2. Products
- 11.2.9.3. SWOT Analysis
- 11.2.9.4. Recent Developments
- 11.2.9.5. Financials (Based on Availability)
- 11.2.10 Medtronic plc
- 11.2.10.1. Overview
- 11.2.10.2. Products
- 11.2.10.3. SWOT Analysis
- 11.2.10.4. Recent Developments
- 11.2.10.5. Financials (Based on Availability)
- 11.2.11 Siemens Healthineers AG
- 11.2.11.1. Overview
- 11.2.11.2. Products
- 11.2.11.3. SWOT Analysis
- 11.2.11.4. Recent Developments
- 11.2.11.5. Financials (Based on Availability)
- 11.2.12 Smith & Nephew plc*List Not Exhaustive
- 11.2.12.1. Overview
- 11.2.12.2. Products
- 11.2.12.3. SWOT Analysis
- 11.2.12.4. Recent Developments
- 11.2.12.5. Financials (Based on Availability)
- 11.2.1 Abbott Laboratories
List of Figures
- Figure 1: Global Non-Invasive & Minimally Invasive Medical Imaging And Visualization Systems Market Revenue Breakdown (Million, %) by Region 2024 & 2032
- Figure 2: Global Non-Invasive & Minimally Invasive Medical Imaging And Visualization Systems Market Volume Breakdown (Billion, %) by Region 2024 & 2032
- Figure 3: North America Non-Invasive & Minimally Invasive Medical Imaging And Visualization Systems Market Revenue (Million), by Type 2024 & 2032
- Figure 4: North America Non-Invasive & Minimally Invasive Medical Imaging And Visualization Systems Market Volume (Billion), by Type 2024 & 2032
- Figure 5: North America Non-Invasive & Minimally Invasive Medical Imaging And Visualization Systems Market Revenue Share (%), by Type 2024 & 2032
- Figure 6: North America Non-Invasive & Minimally Invasive Medical Imaging And Visualization Systems Market Volume Share (%), by Type 2024 & 2032
- Figure 7: North America Non-Invasive & Minimally Invasive Medical Imaging And Visualization Systems Market Revenue (Million), by Portability 2024 & 2032
- Figure 8: North America Non-Invasive & Minimally Invasive Medical Imaging And Visualization Systems Market Volume (Billion), by Portability 2024 & 2032
- Figure 9: North America Non-Invasive & Minimally Invasive Medical Imaging And Visualization Systems Market Revenue Share (%), by Portability 2024 & 2032
- Figure 10: North America Non-Invasive & Minimally Invasive Medical Imaging And Visualization Systems Market Volume Share (%), by Portability 2024 & 2032
- Figure 11: North America Non-Invasive & Minimally Invasive Medical Imaging And Visualization Systems Market Revenue (Million), by Applications 2024 & 2032
- Figure 12: North America Non-Invasive & Minimally Invasive Medical Imaging And Visualization Systems Market Volume (Billion), by Applications 2024 & 2032
- Figure 13: North America Non-Invasive & Minimally Invasive Medical Imaging And Visualization Systems Market Revenue Share (%), by Applications 2024 & 2032
- Figure 14: North America Non-Invasive & Minimally Invasive Medical Imaging And Visualization Systems Market Volume Share (%), by Applications 2024 & 2032
- Figure 15: North America Non-Invasive & Minimally Invasive Medical Imaging And Visualization Systems Market Revenue (Million), by End User 2024 & 2032
- Figure 16: North America Non-Invasive & Minimally Invasive Medical Imaging And Visualization Systems Market Volume (Billion), by End User 2024 & 2032
- Figure 17: North America Non-Invasive & Minimally Invasive Medical Imaging And Visualization Systems Market Revenue Share (%), by End User 2024 & 2032
- Figure 18: North America Non-Invasive & Minimally Invasive Medical Imaging And Visualization Systems Market Volume Share (%), by End User 2024 & 2032
- Figure 19: North America Non-Invasive & Minimally Invasive Medical Imaging And Visualization Systems Market Revenue (Million), by Country 2024 & 2032
- Figure 20: North America Non-Invasive & Minimally Invasive Medical Imaging And Visualization Systems Market Volume (Billion), by Country 2024 & 2032
- Figure 21: North America Non-Invasive & Minimally Invasive Medical Imaging And Visualization Systems Market Revenue Share (%), by Country 2024 & 2032
- Figure 22: North America Non-Invasive & Minimally Invasive Medical Imaging And Visualization Systems Market Volume Share (%), by Country 2024 & 2032
- Figure 23: Europe Non-Invasive & Minimally Invasive Medical Imaging And Visualization Systems Market Revenue (Million), by Type 2024 & 2032
- Figure 24: Europe Non-Invasive & Minimally Invasive Medical Imaging And Visualization Systems Market Volume (Billion), by Type 2024 & 2032
- Figure 25: Europe Non-Invasive & Minimally Invasive Medical Imaging And Visualization Systems Market Revenue Share (%), by Type 2024 & 2032
- Figure 26: Europe Non-Invasive & Minimally Invasive Medical Imaging And Visualization Systems Market Volume Share (%), by Type 2024 & 2032
- Figure 27: Europe Non-Invasive & Minimally Invasive Medical Imaging And Visualization Systems Market Revenue (Million), by Portability 2024 & 2032
- Figure 28: Europe Non-Invasive & Minimally Invasive Medical Imaging And Visualization Systems Market Volume (Billion), by Portability 2024 & 2032
- Figure 29: Europe Non-Invasive & Minimally Invasive Medical Imaging And Visualization Systems Market Revenue Share (%), by Portability 2024 & 2032
- Figure 30: Europe Non-Invasive & Minimally Invasive Medical Imaging And Visualization Systems Market Volume Share (%), by Portability 2024 & 2032
- Figure 31: Europe Non-Invasive & Minimally Invasive Medical Imaging And Visualization Systems Market Revenue (Million), by Applications 2024 & 2032
- Figure 32: Europe Non-Invasive & Minimally Invasive Medical Imaging And Visualization Systems Market Volume (Billion), by Applications 2024 & 2032
- Figure 33: Europe Non-Invasive & Minimally Invasive Medical Imaging And Visualization Systems Market Revenue Share (%), by Applications 2024 & 2032
- Figure 34: Europe Non-Invasive & Minimally Invasive Medical Imaging And Visualization Systems Market Volume Share (%), by Applications 2024 & 2032
- Figure 35: Europe Non-Invasive & Minimally Invasive Medical Imaging And Visualization Systems Market Revenue (Million), by End User 2024 & 2032
- Figure 36: Europe Non-Invasive & Minimally Invasive Medical Imaging And Visualization Systems Market Volume (Billion), by End User 2024 & 2032
- Figure 37: Europe Non-Invasive & Minimally Invasive Medical Imaging And Visualization Systems Market Revenue Share (%), by End User 2024 & 2032
- Figure 38: Europe Non-Invasive & Minimally Invasive Medical Imaging And Visualization Systems Market Volume Share (%), by End User 2024 & 2032
- Figure 39: Europe Non-Invasive & Minimally Invasive Medical Imaging And Visualization Systems Market Revenue (Million), by Country 2024 & 2032
- Figure 40: Europe Non-Invasive & Minimally Invasive Medical Imaging And Visualization Systems Market Volume (Billion), by Country 2024 & 2032
- Figure 41: Europe Non-Invasive & Minimally Invasive Medical Imaging And Visualization Systems Market Revenue Share (%), by Country 2024 & 2032
- Figure 42: Europe Non-Invasive & Minimally Invasive Medical Imaging And Visualization Systems Market Volume Share (%), by Country 2024 & 2032
- Figure 43: Asia Pacific Non-Invasive & Minimally Invasive Medical Imaging And Visualization Systems Market Revenue (Million), by Type 2024 & 2032
- Figure 44: Asia Pacific Non-Invasive & Minimally Invasive Medical Imaging And Visualization Systems Market Volume (Billion), by Type 2024 & 2032
- Figure 45: Asia Pacific Non-Invasive & Minimally Invasive Medical Imaging And Visualization Systems Market Revenue Share (%), by Type 2024 & 2032
- Figure 46: Asia Pacific Non-Invasive & Minimally Invasive Medical Imaging And Visualization Systems Market Volume Share (%), by Type 2024 & 2032
- Figure 47: Asia Pacific Non-Invasive & Minimally Invasive Medical Imaging And Visualization Systems Market Revenue (Million), by Portability 2024 & 2032
- Figure 48: Asia Pacific Non-Invasive & Minimally Invasive Medical Imaging And Visualization Systems Market Volume (Billion), by Portability 2024 & 2032
- Figure 49: Asia Pacific Non-Invasive & Minimally Invasive Medical Imaging And Visualization Systems Market Revenue Share (%), by Portability 2024 & 2032
- Figure 50: Asia Pacific Non-Invasive & Minimally Invasive Medical Imaging And Visualization Systems Market Volume Share (%), by Portability 2024 & 2032
- Figure 51: Asia Pacific Non-Invasive & Minimally Invasive Medical Imaging And Visualization Systems Market Revenue (Million), by Applications 2024 & 2032
- Figure 52: Asia Pacific Non-Invasive & Minimally Invasive Medical Imaging And Visualization Systems Market Volume (Billion), by Applications 2024 & 2032
- Figure 53: Asia Pacific Non-Invasive & Minimally Invasive Medical Imaging And Visualization Systems Market Revenue Share (%), by Applications 2024 & 2032
- Figure 54: Asia Pacific Non-Invasive & Minimally Invasive Medical Imaging And Visualization Systems Market Volume Share (%), by Applications 2024 & 2032
- Figure 55: Asia Pacific Non-Invasive & Minimally Invasive Medical Imaging And Visualization Systems Market Revenue (Million), by End User 2024 & 2032
- Figure 56: Asia Pacific Non-Invasive & Minimally Invasive Medical Imaging And Visualization Systems Market Volume (Billion), by End User 2024 & 2032
- Figure 57: Asia Pacific Non-Invasive & Minimally Invasive Medical Imaging And Visualization Systems Market Revenue Share (%), by End User 2024 & 2032
- Figure 58: Asia Pacific Non-Invasive & Minimally Invasive Medical Imaging And Visualization Systems Market Volume Share (%), by End User 2024 & 2032
- Figure 59: Asia Pacific Non-Invasive & Minimally Invasive Medical Imaging And Visualization Systems Market Revenue (Million), by Country 2024 & 2032
- Figure 60: Asia Pacific Non-Invasive & Minimally Invasive Medical Imaging And Visualization Systems Market Volume (Billion), by Country 2024 & 2032
- Figure 61: Asia Pacific Non-Invasive & Minimally Invasive Medical Imaging And Visualization Systems Market Revenue Share (%), by Country 2024 & 2032
- Figure 62: Asia Pacific Non-Invasive & Minimally Invasive Medical Imaging And Visualization Systems Market Volume Share (%), by Country 2024 & 2032
- Figure 63: Middle East and Africa Non-Invasive & Minimally Invasive Medical Imaging And Visualization Systems Market Revenue (Million), by Type 2024 & 2032
- Figure 64: Middle East and Africa Non-Invasive & Minimally Invasive Medical Imaging And Visualization Systems Market Volume (Billion), by Type 2024 & 2032
- Figure 65: Middle East and Africa Non-Invasive & Minimally Invasive Medical Imaging And Visualization Systems Market Revenue Share (%), by Type 2024 & 2032
- Figure 66: Middle East and Africa Non-Invasive & Minimally Invasive Medical Imaging And Visualization Systems Market Volume Share (%), by Type 2024 & 2032
- Figure 67: Middle East and Africa Non-Invasive & Minimally Invasive Medical Imaging And Visualization Systems Market Revenue (Million), by Portability 2024 & 2032
- Figure 68: Middle East and Africa Non-Invasive & Minimally Invasive Medical Imaging And Visualization Systems Market Volume (Billion), by Portability 2024 & 2032
- Figure 69: Middle East and Africa Non-Invasive & Minimally Invasive Medical Imaging And Visualization Systems Market Revenue Share (%), by Portability 2024 & 2032
- Figure 70: Middle East and Africa Non-Invasive & Minimally Invasive Medical Imaging And Visualization Systems Market Volume Share (%), by Portability 2024 & 2032
- Figure 71: Middle East and Africa Non-Invasive & Minimally Invasive Medical Imaging And Visualization Systems Market Revenue (Million), by Applications 2024 & 2032
- Figure 72: Middle East and Africa Non-Invasive & Minimally Invasive Medical Imaging And Visualization Systems Market Volume (Billion), by Applications 2024 & 2032
- Figure 73: Middle East and Africa Non-Invasive & Minimally Invasive Medical Imaging And Visualization Systems Market Revenue Share (%), by Applications 2024 & 2032
- Figure 74: Middle East and Africa Non-Invasive & Minimally Invasive Medical Imaging And Visualization Systems Market Volume Share (%), by Applications 2024 & 2032
- Figure 75: Middle East and Africa Non-Invasive & Minimally Invasive Medical Imaging And Visualization Systems Market Revenue (Million), by End User 2024 & 2032
- Figure 76: Middle East and Africa Non-Invasive & Minimally Invasive Medical Imaging And Visualization Systems Market Volume (Billion), by End User 2024 & 2032
- Figure 77: Middle East and Africa Non-Invasive & Minimally Invasive Medical Imaging And Visualization Systems Market Revenue Share (%), by End User 2024 & 2032
- Figure 78: Middle East and Africa Non-Invasive & Minimally Invasive Medical Imaging And Visualization Systems Market Volume Share (%), by End User 2024 & 2032
- Figure 79: Middle East and Africa Non-Invasive & Minimally Invasive Medical Imaging And Visualization Systems Market Revenue (Million), by Country 2024 & 2032
- Figure 80: Middle East and Africa Non-Invasive & Minimally Invasive Medical Imaging And Visualization Systems Market Volume (Billion), by Country 2024 & 2032
- Figure 81: Middle East and Africa Non-Invasive & Minimally Invasive Medical Imaging And Visualization Systems Market Revenue Share (%), by Country 2024 & 2032
- Figure 82: Middle East and Africa Non-Invasive & Minimally Invasive Medical Imaging And Visualization Systems Market Volume Share (%), by Country 2024 & 2032
- Figure 83: South America Non-Invasive & Minimally Invasive Medical Imaging And Visualization Systems Market Revenue (Million), by Type 2024 & 2032
- Figure 84: South America Non-Invasive & Minimally Invasive Medical Imaging And Visualization Systems Market Volume (Billion), by Type 2024 & 2032
- Figure 85: South America Non-Invasive & Minimally Invasive Medical Imaging And Visualization Systems Market Revenue Share (%), by Type 2024 & 2032
- Figure 86: South America Non-Invasive & Minimally Invasive Medical Imaging And Visualization Systems Market Volume Share (%), by Type 2024 & 2032
- Figure 87: South America Non-Invasive & Minimally Invasive Medical Imaging And Visualization Systems Market Revenue (Million), by Portability 2024 & 2032
- Figure 88: South America Non-Invasive & Minimally Invasive Medical Imaging And Visualization Systems Market Volume (Billion), by Portability 2024 & 2032
- Figure 89: South America Non-Invasive & Minimally Invasive Medical Imaging And Visualization Systems Market Revenue Share (%), by Portability 2024 & 2032
- Figure 90: South America Non-Invasive & Minimally Invasive Medical Imaging And Visualization Systems Market Volume Share (%), by Portability 2024 & 2032
- Figure 91: South America Non-Invasive & Minimally Invasive Medical Imaging And Visualization Systems Market Revenue (Million), by Applications 2024 & 2032
- Figure 92: South America Non-Invasive & Minimally Invasive Medical Imaging And Visualization Systems Market Volume (Billion), by Applications 2024 & 2032
- Figure 93: South America Non-Invasive & Minimally Invasive Medical Imaging And Visualization Systems Market Revenue Share (%), by Applications 2024 & 2032
- Figure 94: South America Non-Invasive & Minimally Invasive Medical Imaging And Visualization Systems Market Volume Share (%), by Applications 2024 & 2032
- Figure 95: South America Non-Invasive & Minimally Invasive Medical Imaging And Visualization Systems Market Revenue (Million), by End User 2024 & 2032
- Figure 96: South America Non-Invasive & Minimally Invasive Medical Imaging And Visualization Systems Market Volume (Billion), by End User 2024 & 2032
- Figure 97: South America Non-Invasive & Minimally Invasive Medical Imaging And Visualization Systems Market Revenue Share (%), by End User 2024 & 2032
- Figure 98: South America Non-Invasive & Minimally Invasive Medical Imaging And Visualization Systems Market Volume Share (%), by End User 2024 & 2032
- Figure 99: South America Non-Invasive & Minimally Invasive Medical Imaging And Visualization Systems Market Revenue (Million), by Country 2024 & 2032
- Figure 100: South America Non-Invasive & Minimally Invasive Medical Imaging And Visualization Systems Market Volume (Billion), by Country 2024 & 2032
- Figure 101: South America Non-Invasive & Minimally Invasive Medical Imaging And Visualization Systems Market Revenue Share (%), by Country 2024 & 2032
- Figure 102: South America Non-Invasive & Minimally Invasive Medical Imaging And Visualization Systems Market Volume Share (%), by Country 2024 & 2032
List of Tables
- Table 1: Global Non-Invasive & Minimally Invasive Medical Imaging And Visualization Systems Market Revenue Million Forecast, by Region 2019 & 2032
- Table 2: Global Non-Invasive & Minimally Invasive Medical Imaging And Visualization Systems Market Volume Billion Forecast, by Region 2019 & 2032
- Table 3: Global Non-Invasive & Minimally Invasive Medical Imaging And Visualization Systems Market Revenue Million Forecast, by Type 2019 & 2032
- Table 4: Global Non-Invasive & Minimally Invasive Medical Imaging And Visualization Systems Market Volume Billion Forecast, by Type 2019 & 2032
- Table 5: Global Non-Invasive & Minimally Invasive Medical Imaging And Visualization Systems Market Revenue Million Forecast, by Portability 2019 & 2032
- Table 6: Global Non-Invasive & Minimally Invasive Medical Imaging And Visualization Systems Market Volume Billion Forecast, by Portability 2019 & 2032
- Table 7: Global Non-Invasive & Minimally Invasive Medical Imaging And Visualization Systems Market Revenue Million Forecast, by Applications 2019 & 2032
- Table 8: Global Non-Invasive & Minimally Invasive Medical Imaging And Visualization Systems Market Volume Billion Forecast, by Applications 2019 & 2032
- Table 9: Global Non-Invasive & Minimally Invasive Medical Imaging And Visualization Systems Market Revenue Million Forecast, by End User 2019 & 2032
- Table 10: Global Non-Invasive & Minimally Invasive Medical Imaging And Visualization Systems Market Volume Billion Forecast, by End User 2019 & 2032
- Table 11: Global Non-Invasive & Minimally Invasive Medical Imaging And Visualization Systems Market Revenue Million Forecast, by Region 2019 & 2032
- Table 12: Global Non-Invasive & Minimally Invasive Medical Imaging And Visualization Systems Market Volume Billion Forecast, by Region 2019 & 2032
- Table 13: Global Non-Invasive & Minimally Invasive Medical Imaging And Visualization Systems Market Revenue Million Forecast, by Type 2019 & 2032
- Table 14: Global Non-Invasive & Minimally Invasive Medical Imaging And Visualization Systems Market Volume Billion Forecast, by Type 2019 & 2032
- Table 15: Global Non-Invasive & Minimally Invasive Medical Imaging And Visualization Systems Market Revenue Million Forecast, by Portability 2019 & 2032
- Table 16: Global Non-Invasive & Minimally Invasive Medical Imaging And Visualization Systems Market Volume Billion Forecast, by Portability 2019 & 2032
- Table 17: Global Non-Invasive & Minimally Invasive Medical Imaging And Visualization Systems Market Revenue Million Forecast, by Applications 2019 & 2032
- Table 18: Global Non-Invasive & Minimally Invasive Medical Imaging And Visualization Systems Market Volume Billion Forecast, by Applications 2019 & 2032
- Table 19: Global Non-Invasive & Minimally Invasive Medical Imaging And Visualization Systems Market Revenue Million Forecast, by End User 2019 & 2032
- Table 20: Global Non-Invasive & Minimally Invasive Medical Imaging And Visualization Systems Market Volume Billion Forecast, by End User 2019 & 2032
- Table 21: Global Non-Invasive & Minimally Invasive Medical Imaging And Visualization Systems Market Revenue Million Forecast, by Country 2019 & 2032
- Table 22: Global Non-Invasive & Minimally Invasive Medical Imaging And Visualization Systems Market Volume Billion Forecast, by Country 2019 & 2032
- Table 23: United States Non-Invasive & Minimally Invasive Medical Imaging And Visualization Systems Market Revenue (Million) Forecast, by Application 2019 & 2032
- Table 24: United States Non-Invasive & Minimally Invasive Medical Imaging And Visualization Systems Market Volume (Billion) Forecast, by Application 2019 & 2032
- Table 25: Canada Non-Invasive & Minimally Invasive Medical Imaging And Visualization Systems Market Revenue (Million) Forecast, by Application 2019 & 2032
- Table 26: Canada Non-Invasive & Minimally Invasive Medical Imaging And Visualization Systems Market Volume (Billion) Forecast, by Application 2019 & 2032
- Table 27: Mexico Non-Invasive & Minimally Invasive Medical Imaging And Visualization Systems Market Revenue (Million) Forecast, by Application 2019 & 2032
- Table 28: Mexico Non-Invasive & Minimally Invasive Medical Imaging And Visualization Systems Market Volume (Billion) Forecast, by Application 2019 & 2032
- Table 29: Global Non-Invasive & Minimally Invasive Medical Imaging And Visualization Systems Market Revenue Million Forecast, by Type 2019 & 2032
- Table 30: Global Non-Invasive & Minimally Invasive Medical Imaging And Visualization Systems Market Volume Billion Forecast, by Type 2019 & 2032
- Table 31: Global Non-Invasive & Minimally Invasive Medical Imaging And Visualization Systems Market Revenue Million Forecast, by Portability 2019 & 2032
- Table 32: Global Non-Invasive & Minimally Invasive Medical Imaging And Visualization Systems Market Volume Billion Forecast, by Portability 2019 & 2032
- Table 33: Global Non-Invasive & Minimally Invasive Medical Imaging And Visualization Systems Market Revenue Million Forecast, by Applications 2019 & 2032
- Table 34: Global Non-Invasive & Minimally Invasive Medical Imaging And Visualization Systems Market Volume Billion Forecast, by Applications 2019 & 2032
- Table 35: Global Non-Invasive & Minimally Invasive Medical Imaging And Visualization Systems Market Revenue Million Forecast, by End User 2019 & 2032
- Table 36: Global Non-Invasive & Minimally Invasive Medical Imaging And Visualization Systems Market Volume Billion Forecast, by End User 2019 & 2032
- Table 37: Global Non-Invasive & Minimally Invasive Medical Imaging And Visualization Systems Market Revenue Million Forecast, by Country 2019 & 2032
- Table 38: Global Non-Invasive & Minimally Invasive Medical Imaging And Visualization Systems Market Volume Billion Forecast, by Country 2019 & 2032
- Table 39: Germany Non-Invasive & Minimally Invasive Medical Imaging And Visualization Systems Market Revenue (Million) Forecast, by Application 2019 & 2032
- Table 40: Germany Non-Invasive & Minimally Invasive Medical Imaging And Visualization Systems Market Volume (Billion) Forecast, by Application 2019 & 2032
- Table 41: United Kingdom Non-Invasive & Minimally Invasive Medical Imaging And Visualization Systems Market Revenue (Million) Forecast, by Application 2019 & 2032
- Table 42: United Kingdom Non-Invasive & Minimally Invasive Medical Imaging And Visualization Systems Market Volume (Billion) Forecast, by Application 2019 & 2032
- Table 43: France Non-Invasive & Minimally Invasive Medical Imaging And Visualization Systems Market Revenue (Million) Forecast, by Application 2019 & 2032
- Table 44: France Non-Invasive & Minimally Invasive Medical Imaging And Visualization Systems Market Volume (Billion) Forecast, by Application 2019 & 2032
- Table 45: Italy Non-Invasive & Minimally Invasive Medical Imaging And Visualization Systems Market Revenue (Million) Forecast, by Application 2019 & 2032
- Table 46: Italy Non-Invasive & Minimally Invasive Medical Imaging And Visualization Systems Market Volume (Billion) Forecast, by Application 2019 & 2032
- Table 47: Spain Non-Invasive & Minimally Invasive Medical Imaging And Visualization Systems Market Revenue (Million) Forecast, by Application 2019 & 2032
- Table 48: Spain Non-Invasive & Minimally Invasive Medical Imaging And Visualization Systems Market Volume (Billion) Forecast, by Application 2019 & 2032
- Table 49: Rest of Europe Non-Invasive & Minimally Invasive Medical Imaging And Visualization Systems Market Revenue (Million) Forecast, by Application 2019 & 2032
- Table 50: Rest of Europe Non-Invasive & Minimally Invasive Medical Imaging And Visualization Systems Market Volume (Billion) Forecast, by Application 2019 & 2032
- Table 51: Global Non-Invasive & Minimally Invasive Medical Imaging And Visualization Systems Market Revenue Million Forecast, by Type 2019 & 2032
- Table 52: Global Non-Invasive & Minimally Invasive Medical Imaging And Visualization Systems Market Volume Billion Forecast, by Type 2019 & 2032
- Table 53: Global Non-Invasive & Minimally Invasive Medical Imaging And Visualization Systems Market Revenue Million Forecast, by Portability 2019 & 2032
- Table 54: Global Non-Invasive & Minimally Invasive Medical Imaging And Visualization Systems Market Volume Billion Forecast, by Portability 2019 & 2032
- Table 55: Global Non-Invasive & Minimally Invasive Medical Imaging And Visualization Systems Market Revenue Million Forecast, by Applications 2019 & 2032
- Table 56: Global Non-Invasive & Minimally Invasive Medical Imaging And Visualization Systems Market Volume Billion Forecast, by Applications 2019 & 2032
- Table 57: Global Non-Invasive & Minimally Invasive Medical Imaging And Visualization Systems Market Revenue Million Forecast, by End User 2019 & 2032
- Table 58: Global Non-Invasive & Minimally Invasive Medical Imaging And Visualization Systems Market Volume Billion Forecast, by End User 2019 & 2032
- Table 59: Global Non-Invasive & Minimally Invasive Medical Imaging And Visualization Systems Market Revenue Million Forecast, by Country 2019 & 2032
- Table 60: Global Non-Invasive & Minimally Invasive Medical Imaging And Visualization Systems Market Volume Billion Forecast, by Country 2019 & 2032
- Table 61: China Non-Invasive & Minimally Invasive Medical Imaging And Visualization Systems Market Revenue (Million) Forecast, by Application 2019 & 2032
- Table 62: China Non-Invasive & Minimally Invasive Medical Imaging And Visualization Systems Market Volume (Billion) Forecast, by Application 2019 & 2032
- Table 63: Japan Non-Invasive & Minimally Invasive Medical Imaging And Visualization Systems Market Revenue (Million) Forecast, by Application 2019 & 2032
- Table 64: Japan Non-Invasive & Minimally Invasive Medical Imaging And Visualization Systems Market Volume (Billion) Forecast, by Application 2019 & 2032
- Table 65: India Non-Invasive & Minimally Invasive Medical Imaging And Visualization Systems Market Revenue (Million) Forecast, by Application 2019 & 2032
- Table 66: India Non-Invasive & Minimally Invasive Medical Imaging And Visualization Systems Market Volume (Billion) Forecast, by Application 2019 & 2032
- Table 67: Australia Non-Invasive & Minimally Invasive Medical Imaging And Visualization Systems Market Revenue (Million) Forecast, by Application 2019 & 2032
- Table 68: Australia Non-Invasive & Minimally Invasive Medical Imaging And Visualization Systems Market Volume (Billion) Forecast, by Application 2019 & 2032
- Table 69: South Korea Non-Invasive & Minimally Invasive Medical Imaging And Visualization Systems Market Revenue (Million) Forecast, by Application 2019 & 2032
- Table 70: South Korea Non-Invasive & Minimally Invasive Medical Imaging And Visualization Systems Market Volume (Billion) Forecast, by Application 2019 & 2032
- Table 71: Rest of Asia Pacific Non-Invasive & Minimally Invasive Medical Imaging And Visualization Systems Market Revenue (Million) Forecast, by Application 2019 & 2032
- Table 72: Rest of Asia Pacific Non-Invasive & Minimally Invasive Medical Imaging And Visualization Systems Market Volume (Billion) Forecast, by Application 2019 & 2032
- Table 73: Global Non-Invasive & Minimally Invasive Medical Imaging And Visualization Systems Market Revenue Million Forecast, by Type 2019 & 2032
- Table 74: Global Non-Invasive & Minimally Invasive Medical Imaging And Visualization Systems Market Volume Billion Forecast, by Type 2019 & 2032
- Table 75: Global Non-Invasive & Minimally Invasive Medical Imaging And Visualization Systems Market Revenue Million Forecast, by Portability 2019 & 2032
- Table 76: Global Non-Invasive & Minimally Invasive Medical Imaging And Visualization Systems Market Volume Billion Forecast, by Portability 2019 & 2032
- Table 77: Global Non-Invasive & Minimally Invasive Medical Imaging And Visualization Systems Market Revenue Million Forecast, by Applications 2019 & 2032
- Table 78: Global Non-Invasive & Minimally Invasive Medical Imaging And Visualization Systems Market Volume Billion Forecast, by Applications 2019 & 2032
- Table 79: Global Non-Invasive & Minimally Invasive Medical Imaging And Visualization Systems Market Revenue Million Forecast, by End User 2019 & 2032
- Table 80: Global Non-Invasive & Minimally Invasive Medical Imaging And Visualization Systems Market Volume Billion Forecast, by End User 2019 & 2032
- Table 81: Global Non-Invasive & Minimally Invasive Medical Imaging And Visualization Systems Market Revenue Million Forecast, by Country 2019 & 2032
- Table 82: Global Non-Invasive & Minimally Invasive Medical Imaging And Visualization Systems Market Volume Billion Forecast, by Country 2019 & 2032
- Table 83: GCC Non-Invasive & Minimally Invasive Medical Imaging And Visualization Systems Market Revenue (Million) Forecast, by Application 2019 & 2032
- Table 84: GCC Non-Invasive & Minimally Invasive Medical Imaging And Visualization Systems Market Volume (Billion) Forecast, by Application 2019 & 2032
- Table 85: South Africa Non-Invasive & Minimally Invasive Medical Imaging And Visualization Systems Market Revenue (Million) Forecast, by Application 2019 & 2032
- Table 86: South Africa Non-Invasive & Minimally Invasive Medical Imaging And Visualization Systems Market Volume (Billion) Forecast, by Application 2019 & 2032
- Table 87: Rest of Middle East and Africa Non-Invasive & Minimally Invasive Medical Imaging And Visualization Systems Market Revenue (Million) Forecast, by Application 2019 & 2032
- Table 88: Rest of Middle East and Africa Non-Invasive & Minimally Invasive Medical Imaging And Visualization Systems Market Volume (Billion) Forecast, by Application 2019 & 2032
- Table 89: Global Non-Invasive & Minimally Invasive Medical Imaging And Visualization Systems Market Revenue Million Forecast, by Type 2019 & 2032
- Table 90: Global Non-Invasive & Minimally Invasive Medical Imaging And Visualization Systems Market Volume Billion Forecast, by Type 2019 & 2032
- Table 91: Global Non-Invasive & Minimally Invasive Medical Imaging And Visualization Systems Market Revenue Million Forecast, by Portability 2019 & 2032
- Table 92: Global Non-Invasive & Minimally Invasive Medical Imaging And Visualization Systems Market Volume Billion Forecast, by Portability 2019 & 2032
- Table 93: Global Non-Invasive & Minimally Invasive Medical Imaging And Visualization Systems Market Revenue Million Forecast, by Applications 2019 & 2032
- Table 94: Global Non-Invasive & Minimally Invasive Medical Imaging And Visualization Systems Market Volume Billion Forecast, by Applications 2019 & 2032
- Table 95: Global Non-Invasive & Minimally Invasive Medical Imaging And Visualization Systems Market Revenue Million Forecast, by End User 2019 & 2032
- Table 96: Global Non-Invasive & Minimally Invasive Medical Imaging And Visualization Systems Market Volume Billion Forecast, by End User 2019 & 2032
- Table 97: Global Non-Invasive & Minimally Invasive Medical Imaging And Visualization Systems Market Revenue Million Forecast, by Country 2019 & 2032
- Table 98: Global Non-Invasive & Minimally Invasive Medical Imaging And Visualization Systems Market Volume Billion Forecast, by Country 2019 & 2032
- Table 99: Brazil Non-Invasive & Minimally Invasive Medical Imaging And Visualization Systems Market Revenue (Million) Forecast, by Application 2019 & 2032
- Table 100: Brazil Non-Invasive & Minimally Invasive Medical Imaging And Visualization Systems Market Volume (Billion) Forecast, by Application 2019 & 2032
- Table 101: Argentina Non-Invasive & Minimally Invasive Medical Imaging And Visualization Systems Market Revenue (Million) Forecast, by Application 2019 & 2032
- Table 102: Argentina Non-Invasive & Minimally Invasive Medical Imaging And Visualization Systems Market Volume (Billion) Forecast, by Application 2019 & 2032
- Table 103: Rest of South America Non-Invasive & Minimally Invasive Medical Imaging And Visualization Systems Market Revenue (Million) Forecast, by Application 2019 & 2032
- Table 104: Rest of South America Non-Invasive & Minimally Invasive Medical Imaging And Visualization Systems Market Volume (Billion) Forecast, by Application 2019 & 2032
Frequently Asked Questions
1. What is the projected Compound Annual Growth Rate (CAGR) of the Non-Invasive & Minimally Invasive Medical Imaging And Visualization Systems Market?
The projected CAGR is approximately 4.40%.
2. Which companies are prominent players in the Non-Invasive & Minimally Invasive Medical Imaging And Visualization Systems Market?
Key companies in the market include Abbott Laboratories, Advanced Brain Monitoring, Boston Scientific Corporation, Canon Medical Systems Corporation, CAS Medical Systems Inc, CNSystems Medizintechnik GmbH, Fujifilm Holdings Corporation, GE Healthcare, Koninklijke Philips N V, Medtronic plc, Siemens Healthineers AG, Smith & Nephew plc*List Not Exhaustive.
3. What are the main segments of the Non-Invasive & Minimally Invasive Medical Imaging And Visualization Systems Market?
The market segments include Type, Portability, Applications, End User.
4. Can you provide details about the market size?
The market size is estimated to be USD 54.20 Million as of 2022.
5. What are some drivers contributing to market growth?
Continuous Innovations in Imaging Technologies; Rising Prevalence of Chronic Diseases Coupled with Aging Population; Growing Preference Among Patients for Minimally Invasive Procedures.
6. What are the notable trends driving market growth?
The Ultrasound Segment is Expected to Hold a Significant Share Over the Forecast Period.
7. Are there any restraints impacting market growth?
Continuous Innovations in Imaging Technologies; Rising Prevalence of Chronic Diseases Coupled with Aging Population; Growing Preference Among Patients for Minimally Invasive Procedures.
8. Can you provide examples of recent developments in the market?
February 2024: Siemens Healthineers launched its Magnetom Flow, 1.5 tesla (T) platform in Vienna for MRI with a closed helium circuit and no quench pipe. Magnetom Flow is the second virtually helium-free MRI platform from Siemens Healthineers with Dry Cool technology.January 2024: Canon Medical Systems Corporation and Olympus Corporation agreed to collaborate on endoscopic ultrasound systems globally. Canon Medical announced plans to develop and manufacture diagnostic ultrasound systems used in endoscopic ultrasonography (EUS), and Olympus is expected to perform the sales and marketing efforts.
9. What pricing options are available for accessing the report?
Pricing options include single-user, multi-user, and enterprise licenses priced at USD 4750, USD 5250, and USD 8750 respectively.
10. Is the market size provided in terms of value or volume?
The market size is provided in terms of value, measured in Million and volume, measured in Billion.
11. Are there any specific market keywords associated with the report?
Yes, the market keyword associated with the report is "Non-Invasive & Minimally Invasive Medical Imaging And Visualization Systems Market," which aids in identifying and referencing the specific market segment covered.
12. How do I determine which pricing option suits my needs best?
The pricing options vary based on user requirements and access needs. Individual users may opt for single-user licenses, while businesses requiring broader access may choose multi-user or enterprise licenses for cost-effective access to the report.
13. Are there any additional resources or data provided in the Non-Invasive & Minimally Invasive Medical Imaging And Visualization Systems Market report?
While the report offers comprehensive insights, it's advisable to review the specific contents or supplementary materials provided to ascertain if additional resources or data are available.
14. How can I stay updated on further developments or reports in the Non-Invasive & Minimally Invasive Medical Imaging And Visualization Systems Market?
To stay informed about further developments, trends, and reports in the Non-Invasive & Minimally Invasive Medical Imaging And Visualization Systems Market, consider subscribing to industry newsletters, following relevant companies and organizations, or regularly checking reputable industry news sources and publications.
Methodology
Step 1 - Identification of Relevant Samples Size from Population Database


Step 2 - Approaches for Defining Global Market Size (Value, Volume* & Price*)

Note*: In applicable scenarios
Step 3 - Data Sources
Primary Research
- Web Analytics
- Survey Reports
- Research Institute
- Latest Research Reports
- Opinion Leaders
Secondary Research
- Annual Reports
- White Paper
- Latest Press Release
- Industry Association
- Paid Database
- Investor Presentations

Step 4 - Data Triangulation
Involves using different sources of information in order to increase the validity of a study
These sources are likely to be stakeholders in a program - participants, other researchers, program staff, other community members, and so on.
Then we put all data in single framework & apply various statistical tools to find out the dynamic on the market.
During the analysis stage, feedback from the stakeholder groups would be compared to determine areas of agreement as well as areas of divergence
