

Key Insights
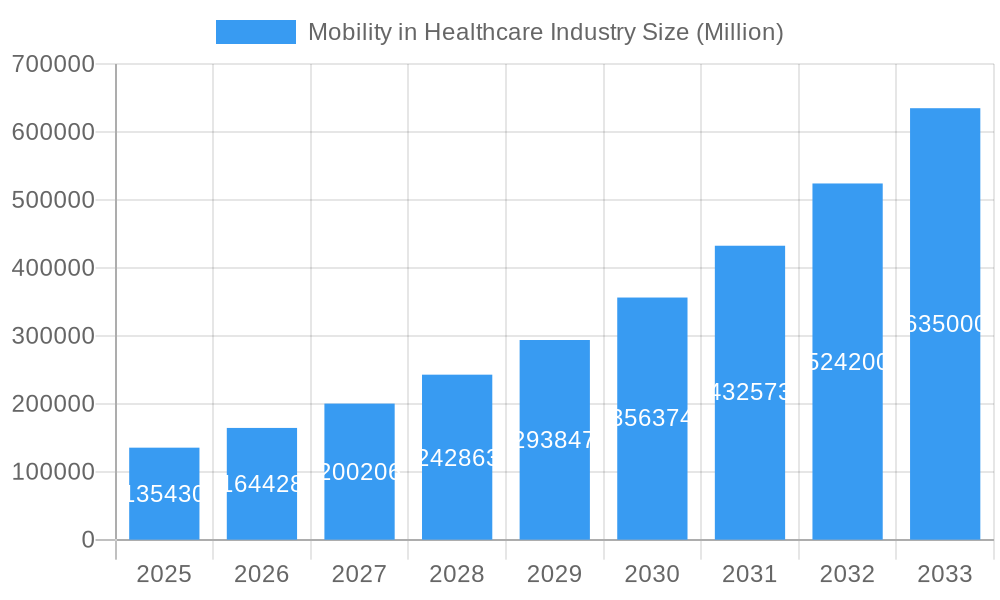
The global mobility in healthcare market, valued at $135.43 billion in 2025, is experiencing robust growth, projected to expand at a Compound Annual Growth Rate (CAGR) of 21.32% from 2025 to 2033. This surge is driven by several key factors. Firstly, the increasing adoption of telehealth and remote patient monitoring solutions is significantly boosting market expansion. The COVID-19 pandemic accelerated this trend, highlighting the effectiveness and efficiency of delivering healthcare services remotely. Secondly, the rising prevalence of chronic diseases necessitates continuous monitoring and personalized care, which mobile health (mHealth) applications and platforms effectively address. Furthermore, advancements in mobile technology, such as 5G connectivity and improved device capabilities, are enabling more sophisticated and seamless data exchange between patients and healthcare providers. The integration of Artificial Intelligence (AI) and machine learning (ML) in mHealth applications further enhances diagnostic accuracy and treatment efficacy, driving market growth. Finally, regulatory support and government initiatives promoting the adoption of digital health solutions are creating a favorable environment for market expansion.
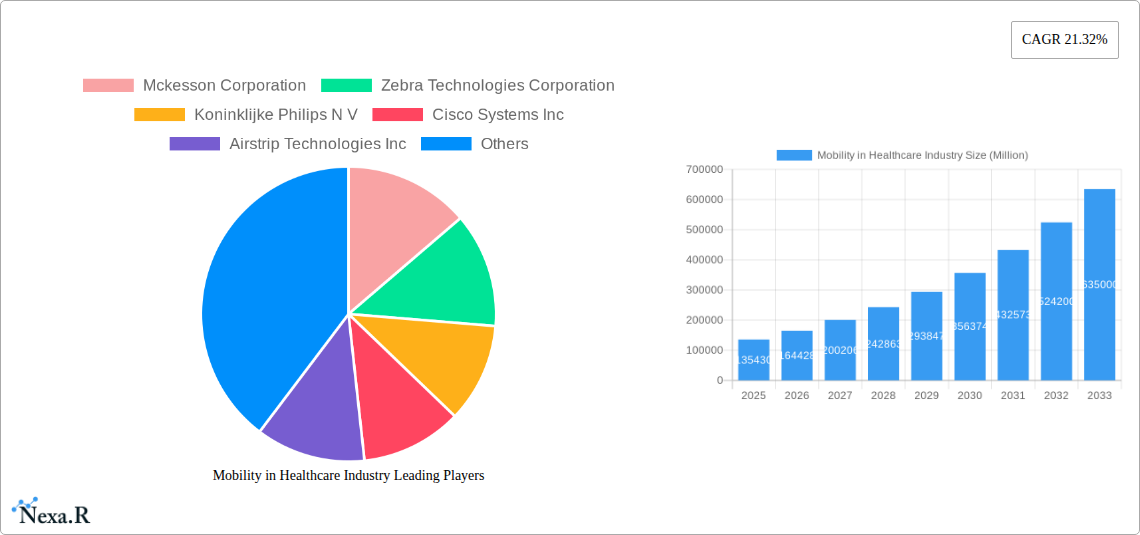
Mobility in Healthcare Industry Market Size (In Billion)
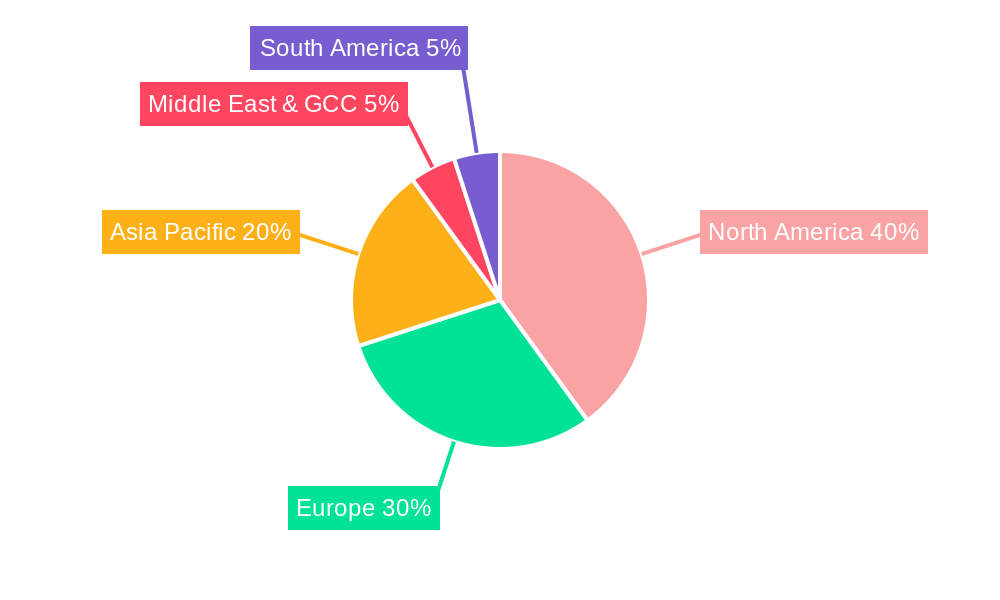
The market segmentation reveals significant opportunities across various applications and end-users. Enterprise mobility platforms are gaining traction due to their ability to streamline workflows and improve operational efficiency within healthcare organizations. Mobile applications, ranging from patient portals to specialized medical apps, are empowering patients to actively manage their health. The mHealth segment, particularly in workforce management and remote patient monitoring, is experiencing substantial growth. End-user segments, including payers, providers, and patients, all contribute to the market's expansion, with payers leveraging mobile technologies for claims processing and patient engagement, and providers using mobile solutions for improved care coordination and communication. The geographical distribution reveals strong growth across North America and Europe, but Asia-Pacific is expected to witness accelerated growth in the coming years due to increasing smartphone penetration and rising healthcare expenditure. Competition in this dynamic market is fierce, with established technology companies and specialized healthcare providers vying for market share.
Mobility in Healthcare Industry Company Market Share
Mobility in Healthcare Industry: Market Report 2019-2033
This comprehensive report provides an in-depth analysis of the Mobility in Healthcare Industry market, encompassing its current dynamics, future trends, and key players. With a focus on the parent market of Healthcare IT and child markets of mHealth and Telehealth, this report offers invaluable insights for industry professionals, investors, and strategists. The study period covers 2019-2033, with a base year of 2025 and a forecast period of 2025-2033. The market size is projected in million units.
Mobility in Healthcare Industry Market Dynamics & Structure
The Mobility in Healthcare Industry is characterized by a moderately concentrated market structure, with key players like McKesson Corporation, Zebra Technologies Corporation, and Koninklijke Philips N.V. holding significant market share (estimated at xx% combined in 2025). Technological innovation, driven by advancements in mobile computing, AI, and IoT, is a major growth driver. Regulatory frameworks, varying across geographies, impact adoption rates and product development. Competitive substitutes include traditional desktop systems, but the convenience and accessibility of mobile solutions are gradually shifting market preferences. The end-user demographic is expanding, with increased adoption among payers, providers, and patients. M&A activity in the sector is robust, with an estimated xx deals in the historical period (2019-2024), mainly focused on expanding capabilities and market reach.
- Market Concentration: Moderately concentrated, with top 3 players holding xx% market share in 2025.
- Technological Drivers: AI, IoT, 5G, cloud computing.
- Regulatory Landscape: Varying across regions, impacting adoption.
- Competitive Substitutes: Traditional desktop systems, but losing ground.
- End-User Demographics: Growing adoption across payers, providers, and patients.
- M&A Activity: xx deals during 2019-2024, focusing on expansion and capability enhancement.
Mobility in Healthcare Industry Growth Trends & Insights
The Mobility in Healthcare Industry is experiencing significant growth, driven by factors such as rising smartphone penetration, increasing demand for remote healthcare services, and the need for efficient workforce management. The market size is projected to reach xx million units by 2025, growing at a CAGR of xx% during the forecast period (2025-2033). This growth is fueled by the increasing adoption of mHealth applications, enterprise mobility platforms, and mobile devices within healthcare settings. Technological disruptions, such as the rise of AI-powered diagnostic tools and telehealth platforms, are accelerating this trend. Consumer behavior shifts towards personalized and convenient healthcare are further driving market expansion. Market penetration for mobile health apps is projected to reach xx% by 2033.
Dominant Regions, Countries, or Segments in Mobility in Healthcare Industry
North America currently dominates the Mobility in Healthcare Industry, accounting for an estimated xx% market share in 2025, followed by Europe and Asia Pacific. Within the segments, Enterprise Mobility Platforms and mHealth applications demonstrate the highest growth potential, driven by the increasing need for efficient data management and remote patient monitoring. The Provider segment is the largest end-user group, followed by Payers and Patients.
- Key Drivers (North America): Robust healthcare infrastructure, high technological adoption, favorable regulatory environment.
- Key Drivers (Europe): Increasing investments in digital healthcare, growing adoption of telehealth.
- Key Drivers (Asia Pacific): Rising smartphone penetration, expanding healthcare IT infrastructure, government initiatives.
- Dominant Segments: Enterprise Mobility Platforms and mHealth Applications.
- Largest End-User: Providers.
Mobility in Healthcare Industry Product Landscape
The product landscape is characterized by a wide range of offerings, including enterprise mobility platforms, mobile applications (for patient engagement, telehealth, and remote monitoring), and specialized mobile devices. These products are constantly evolving, incorporating advanced features like AI-powered diagnostics, integrated wearable sensors, and enhanced security protocols. Key innovations include voice-driven assistants and streamlined data integration capabilities. Unique selling propositions focus on improving efficiency, enhancing patient care, and reducing operational costs.
Key Drivers, Barriers & Challenges in Mobility in Healthcare Industry
Key Drivers: Increasing demand for remote healthcare, technological advancements (AI, IoT), government initiatives promoting digital health, and improved data security measures.
Challenges: Data security and privacy concerns, interoperability issues between different systems, high implementation costs, and resistance to change among healthcare professionals. Supply chain disruptions can also impact the availability of devices and components, potentially delaying project timelines. These factors can cumulatively reduce market growth by an estimated xx% by 2033.
Emerging Opportunities in Mobility in Healthcare Industry
Untapped markets in developing economies present significant growth opportunities. Innovative applications like AI-powered diagnostic tools and virtual reality-based therapies offer substantial potential. Personalized medicine and remote patient monitoring are also driving demand for specialized mobile health solutions. Further integration with wearable technology and the expansion of 5G networks will also contribute to significant market growth.
Growth Accelerators in the Mobility in Healthcare Industry Industry
Technological breakthroughs, particularly in AI and IoT, are key growth accelerators. Strategic partnerships between technology providers and healthcare organizations are fostering innovation and market expansion. Government initiatives promoting the adoption of digital health technologies and investments in healthcare infrastructure also play a crucial role. The ongoing transition towards value-based care further drives the adoption of mobile healthcare solutions to enhance efficiency and patient outcomes.
Key Players Shaping the Mobility in Healthcare Industry Market
Notable Milestones in Mobility in Healthcare Industry Sector
- August 2022: Indonesia's Health Ministry launches the Indonesia Health Services platform, signifying a major step in the country's digital health transformation.
- June 2022: athenahealth launches athenaOne Voice Assistant, enhancing clinical workflow efficiency through voice-driven technology.
In-Depth Mobility in Healthcare Industry Market Outlook
The Mobility in Healthcare Industry is poised for substantial growth, driven by converging technological advancements, expanding telehealth adoption, and increasing government support for digital health initiatives. Strategic partnerships, focused on integrating various mobile health solutions, will further drive market expansion. The increasing demand for efficient and cost-effective healthcare solutions will fuel sustained growth in the coming years, offering significant opportunities for both established players and emerging innovators.
Mobility in Healthcare Industry Segmentation
-
1. Products and Services
- 1.1. Enterprise Mobility Platforms
- 1.2. Mobile Applications (Apps)
- 1.3. Mobile Devices
-
2. Application
-
2.1. Enterprise Solutions
- 2.1.1. Operation Management
- 2.1.2. Patient Care Management
- 2.1.3. Work Force Management
- 2.2. mHealth Applications
-
2.1. Enterprise Solutions
-
3. End User
- 3.1. Payers
- 3.2. Providers
- 3.3. Patients
Mobility in Healthcare Industry Segmentation By Geography
-
1. North America
- 1.1. United States
- 1.2. Canada
- 1.3. Mexico
-
2. Europe
- 2.1. Germany
- 2.2. United Kingdom
- 2.3. France
- 2.4. Italy
- 2.5. Spain
- 2.6. Rest of Europe
-
3. Asia Pacific
- 3.1. China
- 3.2. Japan
- 3.3. India
- 3.4. Australia
- 3.5. South Korea
- 3.6. Rest of Asia Pacific
- 4. Middle East
-
5. GCC
- 5.1. South Africa
- 5.2. Rest of Middle East
-
6. South America
- 6.1. Brazil
- 6.2. Argentina
- 6.3. Rest of South America
Mobility in Healthcare Industry Regional Market Share
Geographic Coverage of Mobility in Healthcare Industry
Mobility in Healthcare Industry REPORT HIGHLIGHTS
| Aspects | Details |
|---|---|
| Study Period | 2020-2034 |
| Base Year | 2025 |
| Estimated Year | 2026 |
| Forecast Period | 2026-2034 |
| Historical Period | 2020-2025 |
| Growth Rate | CAGR of 21.32% from 2020-2034 |
| Segmentation |
|
Table of Contents
- 1. Introduction
- 1.1. Research Scope
- 1.2. Market Segmentation
- 1.3. Research Objective
- 1.4. Definitions and Assumptions
- 2. Executive Summary
- 2.1. Market Snapshot
- 3. Market Dynamics
- 3.1. Market Drivers
- 3.2. Market Restrains
- 3.3. Market Trends
- 3.4. Market Opportunities
- 4. Market Factor Analysis
- 4.1. Porters Five Forces
- 4.1.1. Bargaining Power of Suppliers
- 4.1.2. Bargaining Power of Buyers
- 4.1.3. Threat of New Entrants
- 4.1.4. Threat of Substitutes
- 4.1.5. Competitive Rivalry
- 4.2. PESTEL analysis
- 4.3. BCG Analysis
- 4.3.1. Stars (High Growth, High Market Share)
- 4.3.2. Cash Cows (Low Growth, High Market Share)
- 4.3.3. Question Mark (High Growth, Low Market Share)
- 4.3.4. Dogs (Low Growth, Low Market Share)
- 4.4. Ansoff Matrix Analysis
- 4.5. Supply Chain Analysis
- 4.6. Regulatory Landscape
- 4.7. Current Market Potential and Opportunity Assessment (TAM–SAM–SOM Framework)
- 4.8. NRP Analyst Note
- 4.1. Porters Five Forces
- 5. Market Analysis, Insights and Forecast 2021-2033
- 5.1. Market Analysis, Insights and Forecast - by Products and Services
- 5.1.1. Enterprise Mobility Platforms
- 5.1.2. Mobile Applications (Apps)
- 5.1.3. Mobile Devices
- 5.2. Market Analysis, Insights and Forecast - by Application
- 5.2.1. Enterprise Solutions
- 5.2.1.1. Operation Management
- 5.2.1.2. Patient Care Management
- 5.2.1.3. Work Force Management
- 5.2.2. mHealth Applications
- 5.2.1. Enterprise Solutions
- 5.3. Market Analysis, Insights and Forecast - by End User
- 5.3.1. Payers
- 5.3.2. Providers
- 5.3.3. Patients
- 5.4. Market Analysis, Insights and Forecast - by Region
- 5.4.1. North America
- 5.4.2. Europe
- 5.4.3. Asia Pacific
- 5.4.4. Middle East
- 5.4.5. GCC
- 5.4.6. South America
- 5.1. Market Analysis, Insights and Forecast - by Products and Services
- 6. Global Mobility in Healthcare Industry Analysis, Insights and Forecast, 2021-2033
- 6.1. Market Analysis, Insights and Forecast - by Products and Services
- 6.1.1. Enterprise Mobility Platforms
- 6.1.2. Mobile Applications (Apps)
- 6.1.3. Mobile Devices
- 6.2. Market Analysis, Insights and Forecast - by Application
- 6.2.1. Enterprise Solutions
- 6.2.1.1. Operation Management
- 6.2.1.2. Patient Care Management
- 6.2.1.3. Work Force Management
- 6.2.2. mHealth Applications
- 6.2.1. Enterprise Solutions
- 6.3. Market Analysis, Insights and Forecast - by End User
- 6.3.1. Payers
- 6.3.2. Providers
- 6.3.3. Patients
- 6.1. Market Analysis, Insights and Forecast - by Products and Services
- 7. North America Mobility in Healthcare Industry Analysis, Insights and Forecast, 2020-2032
- 7.1. Market Analysis, Insights and Forecast - by Products and Services
- 7.1.1. Enterprise Mobility Platforms
- 7.1.2. Mobile Applications (Apps)
- 7.1.3. Mobile Devices
- 7.2. Market Analysis, Insights and Forecast - by Application
- 7.2.1. Enterprise Solutions
- 7.2.1.1. Operation Management
- 7.2.1.2. Patient Care Management
- 7.2.1.3. Work Force Management
- 7.2.2. mHealth Applications
- 7.2.1. Enterprise Solutions
- 7.3. Market Analysis, Insights and Forecast - by End User
- 7.3.1. Payers
- 7.3.2. Providers
- 7.3.3. Patients
- 7.1. Market Analysis, Insights and Forecast - by Products and Services
- 8. Europe Mobility in Healthcare Industry Analysis, Insights and Forecast, 2020-2032
- 8.1. Market Analysis, Insights and Forecast - by Products and Services
- 8.1.1. Enterprise Mobility Platforms
- 8.1.2. Mobile Applications (Apps)
- 8.1.3. Mobile Devices
- 8.2. Market Analysis, Insights and Forecast - by Application
- 8.2.1. Enterprise Solutions
- 8.2.1.1. Operation Management
- 8.2.1.2. Patient Care Management
- 8.2.1.3. Work Force Management
- 8.2.2. mHealth Applications
- 8.2.1. Enterprise Solutions
- 8.3. Market Analysis, Insights and Forecast - by End User
- 8.3.1. Payers
- 8.3.2. Providers
- 8.3.3. Patients
- 8.1. Market Analysis, Insights and Forecast - by Products and Services
- 9. Asia Pacific Mobility in Healthcare Industry Analysis, Insights and Forecast, 2020-2032
- 9.1. Market Analysis, Insights and Forecast - by Products and Services
- 9.1.1. Enterprise Mobility Platforms
- 9.1.2. Mobile Applications (Apps)
- 9.1.3. Mobile Devices
- 9.2. Market Analysis, Insights and Forecast - by Application
- 9.2.1. Enterprise Solutions
- 9.2.1.1. Operation Management
- 9.2.1.2. Patient Care Management
- 9.2.1.3. Work Force Management
- 9.2.2. mHealth Applications
- 9.2.1. Enterprise Solutions
- 9.3. Market Analysis, Insights and Forecast - by End User
- 9.3.1. Payers
- 9.3.2. Providers
- 9.3.3. Patients
- 9.1. Market Analysis, Insights and Forecast - by Products and Services
- 10. Middle East Mobility in Healthcare Industry Analysis, Insights and Forecast, 2020-2032
- 10.1. Market Analysis, Insights and Forecast - by Products and Services
- 10.1.1. Enterprise Mobility Platforms
- 10.1.2. Mobile Applications (Apps)
- 10.1.3. Mobile Devices
- 10.2. Market Analysis, Insights and Forecast - by Application
- 10.2.1. Enterprise Solutions
- 10.2.1.1. Operation Management
- 10.2.1.2. Patient Care Management
- 10.2.1.3. Work Force Management
- 10.2.2. mHealth Applications
- 10.2.1. Enterprise Solutions
- 10.3. Market Analysis, Insights and Forecast - by End User
- 10.3.1. Payers
- 10.3.2. Providers
- 10.3.3. Patients
- 10.1. Market Analysis, Insights and Forecast - by Products and Services
- 11. GCC Mobility in Healthcare Industry Analysis, Insights and Forecast, 2020-2032
- 11.1. Market Analysis, Insights and Forecast - by Products and Services
- 11.1.1. Enterprise Mobility Platforms
- 11.1.2. Mobile Applications (Apps)
- 11.1.3. Mobile Devices
- 11.2. Market Analysis, Insights and Forecast - by Application
- 11.2.1. Enterprise Solutions
- 11.2.1.1. Operation Management
- 11.2.1.2. Patient Care Management
- 11.2.1.3. Work Force Management
- 11.2.2. mHealth Applications
- 11.2.1. Enterprise Solutions
- 11.3. Market Analysis, Insights and Forecast - by End User
- 11.3.1. Payers
- 11.3.2. Providers
- 11.3.3. Patients
- 11.1. Market Analysis, Insights and Forecast - by Products and Services
- 12. South America Mobility in Healthcare Industry Analysis, Insights and Forecast, 2020-2032
- 12.1. Market Analysis, Insights and Forecast - by Products and Services
- 12.1.1. Enterprise Mobility Platforms
- 12.1.2. Mobile Applications (Apps)
- 12.1.3. Mobile Devices
- 12.2. Market Analysis, Insights and Forecast - by Application
- 12.2.1. Enterprise Solutions
- 12.2.1.1. Operation Management
- 12.2.1.2. Patient Care Management
- 12.2.1.3. Work Force Management
- 12.2.2. mHealth Applications
- 12.2.1. Enterprise Solutions
- 12.3. Market Analysis, Insights and Forecast - by End User
- 12.3.1. Payers
- 12.3.2. Providers
- 12.3.3. Patients
- 12.1. Market Analysis, Insights and Forecast - by Products and Services
- 13. Competitive Analysis
- 13.1. Company Profiles
- 13.1.1 Mckesson Corporation
- 13.1.1.1. Company Overview
- 13.1.1.2. Products
- 13.1.1.3. Company Financials
- 13.1.1.4. SWOT Analysis
- 13.1.2 Zebra Technologies Corporation
- 13.1.2.1. Company Overview
- 13.1.2.2. Products
- 13.1.2.3. Company Financials
- 13.1.2.4. SWOT Analysis
- 13.1.3 Koninklijke Philips N V
- 13.1.3.1. Company Overview
- 13.1.3.2. Products
- 13.1.3.3. Company Financials
- 13.1.3.4. SWOT Analysis
- 13.1.4 Cisco Systems Inc
- 13.1.4.1. Company Overview
- 13.1.4.2. Products
- 13.1.4.3. Company Financials
- 13.1.4.4. SWOT Analysis
- 13.1.5 Airstrip Technologies Inc
- 13.1.5.1. Company Overview
- 13.1.5.2. Products
- 13.1.5.3. Company Financials
- 13.1.5.4. SWOT Analysis
- 13.1.6 Omron Corporation
- 13.1.6.1. Company Overview
- 13.1.6.2. Products
- 13.1.6.3. Company Financials
- 13.1.6.4. SWOT Analysis
- 13.1.7 At&T Inc
- 13.1.7.1. Company Overview
- 13.1.7.2. Products
- 13.1.7.3. Company Financials
- 13.1.7.4. SWOT Analysis
- 13.1.8 SAP SE
- 13.1.8.1. Company Overview
- 13.1.8.2. Products
- 13.1.8.3. Company Financials
- 13.1.8.4. SWOT Analysis
- 13.1.9 Oracle Cerner
- 13.1.9.1. Company Overview
- 13.1.9.2. Products
- 13.1.9.3. Company Financials
- 13.1.9.4. SWOT Analysis
- 13.1.1 Mckesson Corporation
- 13.2. Market Entropy
- 13.2.1 Company's Key Areas Served
- 13.2.2 Recent Developments
- 13.3. Company Market Share Analysis 2025
- 13.3.1 Top 5 Companies Market Share Analysis
- 13.3.2 Top 3 Companies Market Share Analysis
- 13.4. List of Potential Customers
- 14. Research Methodology
List of Figures
- Figure 1: Global Mobility in Healthcare Industry Revenue Breakdown (Million, %) by Region 2025 & 2033
- Figure 2: Global Mobility in Healthcare Industry Volume Breakdown (K Unit, %) by Region 2025 & 2033
- Figure 3: North America Mobility in Healthcare Industry Revenue (Million), by Products and Services 2025 & 2033
- Figure 4: North America Mobility in Healthcare Industry Volume (K Unit), by Products and Services 2025 & 2033
- Figure 5: North America Mobility in Healthcare Industry Revenue Share (%), by Products and Services 2025 & 2033
- Figure 6: North America Mobility in Healthcare Industry Volume Share (%), by Products and Services 2025 & 2033
- Figure 7: North America Mobility in Healthcare Industry Revenue (Million), by Application 2025 & 2033
- Figure 8: North America Mobility in Healthcare Industry Volume (K Unit), by Application 2025 & 2033
- Figure 9: North America Mobility in Healthcare Industry Revenue Share (%), by Application 2025 & 2033
- Figure 10: North America Mobility in Healthcare Industry Volume Share (%), by Application 2025 & 2033
- Figure 11: North America Mobility in Healthcare Industry Revenue (Million), by End User 2025 & 2033
- Figure 12: North America Mobility in Healthcare Industry Volume (K Unit), by End User 2025 & 2033
- Figure 13: North America Mobility in Healthcare Industry Revenue Share (%), by End User 2025 & 2033
- Figure 14: North America Mobility in Healthcare Industry Volume Share (%), by End User 2025 & 2033
- Figure 15: North America Mobility in Healthcare Industry Revenue (Million), by Country 2025 & 2033
- Figure 16: North America Mobility in Healthcare Industry Volume (K Unit), by Country 2025 & 2033
- Figure 17: North America Mobility in Healthcare Industry Revenue Share (%), by Country 2025 & 2033
- Figure 18: North America Mobility in Healthcare Industry Volume Share (%), by Country 2025 & 2033
- Figure 19: Europe Mobility in Healthcare Industry Revenue (Million), by Products and Services 2025 & 2033
- Figure 20: Europe Mobility in Healthcare Industry Volume (K Unit), by Products and Services 2025 & 2033
- Figure 21: Europe Mobility in Healthcare Industry Revenue Share (%), by Products and Services 2025 & 2033
- Figure 22: Europe Mobility in Healthcare Industry Volume Share (%), by Products and Services 2025 & 2033
- Figure 23: Europe Mobility in Healthcare Industry Revenue (Million), by Application 2025 & 2033
- Figure 24: Europe Mobility in Healthcare Industry Volume (K Unit), by Application 2025 & 2033
- Figure 25: Europe Mobility in Healthcare Industry Revenue Share (%), by Application 2025 & 2033
- Figure 26: Europe Mobility in Healthcare Industry Volume Share (%), by Application 2025 & 2033
- Figure 27: Europe Mobility in Healthcare Industry Revenue (Million), by End User 2025 & 2033
- Figure 28: Europe Mobility in Healthcare Industry Volume (K Unit), by End User 2025 & 2033
- Figure 29: Europe Mobility in Healthcare Industry Revenue Share (%), by End User 2025 & 2033
- Figure 30: Europe Mobility in Healthcare Industry Volume Share (%), by End User 2025 & 2033
- Figure 31: Europe Mobility in Healthcare Industry Revenue (Million), by Country 2025 & 2033
- Figure 32: Europe Mobility in Healthcare Industry Volume (K Unit), by Country 2025 & 2033
- Figure 33: Europe Mobility in Healthcare Industry Revenue Share (%), by Country 2025 & 2033
- Figure 34: Europe Mobility in Healthcare Industry Volume Share (%), by Country 2025 & 2033
- Figure 35: Asia Pacific Mobility in Healthcare Industry Revenue (Million), by Products and Services 2025 & 2033
- Figure 36: Asia Pacific Mobility in Healthcare Industry Volume (K Unit), by Products and Services 2025 & 2033
- Figure 37: Asia Pacific Mobility in Healthcare Industry Revenue Share (%), by Products and Services 2025 & 2033
- Figure 38: Asia Pacific Mobility in Healthcare Industry Volume Share (%), by Products and Services 2025 & 2033
- Figure 39: Asia Pacific Mobility in Healthcare Industry Revenue (Million), by Application 2025 & 2033
- Figure 40: Asia Pacific Mobility in Healthcare Industry Volume (K Unit), by Application 2025 & 2033
- Figure 41: Asia Pacific Mobility in Healthcare Industry Revenue Share (%), by Application 2025 & 2033
- Figure 42: Asia Pacific Mobility in Healthcare Industry Volume Share (%), by Application 2025 & 2033
- Figure 43: Asia Pacific Mobility in Healthcare Industry Revenue (Million), by End User 2025 & 2033
- Figure 44: Asia Pacific Mobility in Healthcare Industry Volume (K Unit), by End User 2025 & 2033
- Figure 45: Asia Pacific Mobility in Healthcare Industry Revenue Share (%), by End User 2025 & 2033
- Figure 46: Asia Pacific Mobility in Healthcare Industry Volume Share (%), by End User 2025 & 2033
- Figure 47: Asia Pacific Mobility in Healthcare Industry Revenue (Million), by Country 2025 & 2033
- Figure 48: Asia Pacific Mobility in Healthcare Industry Volume (K Unit), by Country 2025 & 2033
- Figure 49: Asia Pacific Mobility in Healthcare Industry Revenue Share (%), by Country 2025 & 2033
- Figure 50: Asia Pacific Mobility in Healthcare Industry Volume Share (%), by Country 2025 & 2033
- Figure 51: Middle East Mobility in Healthcare Industry Revenue (Million), by Products and Services 2025 & 2033
- Figure 52: Middle East Mobility in Healthcare Industry Volume (K Unit), by Products and Services 2025 & 2033
- Figure 53: Middle East Mobility in Healthcare Industry Revenue Share (%), by Products and Services 2025 & 2033
- Figure 54: Middle East Mobility in Healthcare Industry Volume Share (%), by Products and Services 2025 & 2033
- Figure 55: Middle East Mobility in Healthcare Industry Revenue (Million), by Application 2025 & 2033
- Figure 56: Middle East Mobility in Healthcare Industry Volume (K Unit), by Application 2025 & 2033
- Figure 57: Middle East Mobility in Healthcare Industry Revenue Share (%), by Application 2025 & 2033
- Figure 58: Middle East Mobility in Healthcare Industry Volume Share (%), by Application 2025 & 2033
- Figure 59: Middle East Mobility in Healthcare Industry Revenue (Million), by End User 2025 & 2033
- Figure 60: Middle East Mobility in Healthcare Industry Volume (K Unit), by End User 2025 & 2033
- Figure 61: Middle East Mobility in Healthcare Industry Revenue Share (%), by End User 2025 & 2033
- Figure 62: Middle East Mobility in Healthcare Industry Volume Share (%), by End User 2025 & 2033
- Figure 63: Middle East Mobility in Healthcare Industry Revenue (Million), by Country 2025 & 2033
- Figure 64: Middle East Mobility in Healthcare Industry Volume (K Unit), by Country 2025 & 2033
- Figure 65: Middle East Mobility in Healthcare Industry Revenue Share (%), by Country 2025 & 2033
- Figure 66: Middle East Mobility in Healthcare Industry Volume Share (%), by Country 2025 & 2033
- Figure 67: GCC Mobility in Healthcare Industry Revenue (Million), by Products and Services 2025 & 2033
- Figure 68: GCC Mobility in Healthcare Industry Volume (K Unit), by Products and Services 2025 & 2033
- Figure 69: GCC Mobility in Healthcare Industry Revenue Share (%), by Products and Services 2025 & 2033
- Figure 70: GCC Mobility in Healthcare Industry Volume Share (%), by Products and Services 2025 & 2033
- Figure 71: GCC Mobility in Healthcare Industry Revenue (Million), by Application 2025 & 2033
- Figure 72: GCC Mobility in Healthcare Industry Volume (K Unit), by Application 2025 & 2033
- Figure 73: GCC Mobility in Healthcare Industry Revenue Share (%), by Application 2025 & 2033
- Figure 74: GCC Mobility in Healthcare Industry Volume Share (%), by Application 2025 & 2033
- Figure 75: GCC Mobility in Healthcare Industry Revenue (Million), by End User 2025 & 2033
- Figure 76: GCC Mobility in Healthcare Industry Volume (K Unit), by End User 2025 & 2033
- Figure 77: GCC Mobility in Healthcare Industry Revenue Share (%), by End User 2025 & 2033
- Figure 78: GCC Mobility in Healthcare Industry Volume Share (%), by End User 2025 & 2033
- Figure 79: GCC Mobility in Healthcare Industry Revenue (Million), by Country 2025 & 2033
- Figure 80: GCC Mobility in Healthcare Industry Volume (K Unit), by Country 2025 & 2033
- Figure 81: GCC Mobility in Healthcare Industry Revenue Share (%), by Country 2025 & 2033
- Figure 82: GCC Mobility in Healthcare Industry Volume Share (%), by Country 2025 & 2033
- Figure 83: South America Mobility in Healthcare Industry Revenue (Million), by Products and Services 2025 & 2033
- Figure 84: South America Mobility in Healthcare Industry Volume (K Unit), by Products and Services 2025 & 2033
- Figure 85: South America Mobility in Healthcare Industry Revenue Share (%), by Products and Services 2025 & 2033
- Figure 86: South America Mobility in Healthcare Industry Volume Share (%), by Products and Services 2025 & 2033
- Figure 87: South America Mobility in Healthcare Industry Revenue (Million), by Application 2025 & 2033
- Figure 88: South America Mobility in Healthcare Industry Volume (K Unit), by Application 2025 & 2033
- Figure 89: South America Mobility in Healthcare Industry Revenue Share (%), by Application 2025 & 2033
- Figure 90: South America Mobility in Healthcare Industry Volume Share (%), by Application 2025 & 2033
- Figure 91: South America Mobility in Healthcare Industry Revenue (Million), by End User 2025 & 2033
- Figure 92: South America Mobility in Healthcare Industry Volume (K Unit), by End User 2025 & 2033
- Figure 93: South America Mobility in Healthcare Industry Revenue Share (%), by End User 2025 & 2033
- Figure 94: South America Mobility in Healthcare Industry Volume Share (%), by End User 2025 & 2033
- Figure 95: South America Mobility in Healthcare Industry Revenue (Million), by Country 2025 & 2033
- Figure 96: South America Mobility in Healthcare Industry Volume (K Unit), by Country 2025 & 2033
- Figure 97: South America Mobility in Healthcare Industry Revenue Share (%), by Country 2025 & 2033
- Figure 98: South America Mobility in Healthcare Industry Volume Share (%), by Country 2025 & 2033
List of Tables
- Table 1: Global Mobility in Healthcare Industry Revenue Million Forecast, by Products and Services 2020 & 2033
- Table 2: Global Mobility in Healthcare Industry Volume K Unit Forecast, by Products and Services 2020 & 2033
- Table 3: Global Mobility in Healthcare Industry Revenue Million Forecast, by Application 2020 & 2033
- Table 4: Global Mobility in Healthcare Industry Volume K Unit Forecast, by Application 2020 & 2033
- Table 5: Global Mobility in Healthcare Industry Revenue Million Forecast, by End User 2020 & 2033
- Table 6: Global Mobility in Healthcare Industry Volume K Unit Forecast, by End User 2020 & 2033
- Table 7: Global Mobility in Healthcare Industry Revenue Million Forecast, by Region 2020 & 2033
- Table 8: Global Mobility in Healthcare Industry Volume K Unit Forecast, by Region 2020 & 2033
- Table 9: Global Mobility in Healthcare Industry Revenue Million Forecast, by Products and Services 2020 & 2033
- Table 10: Global Mobility in Healthcare Industry Volume K Unit Forecast, by Products and Services 2020 & 2033
- Table 11: Global Mobility in Healthcare Industry Revenue Million Forecast, by Application 2020 & 2033
- Table 12: Global Mobility in Healthcare Industry Volume K Unit Forecast, by Application 2020 & 2033
- Table 13: Global Mobility in Healthcare Industry Revenue Million Forecast, by End User 2020 & 2033
- Table 14: Global Mobility in Healthcare Industry Volume K Unit Forecast, by End User 2020 & 2033
- Table 15: Global Mobility in Healthcare Industry Revenue Million Forecast, by Country 2020 & 2033
- Table 16: Global Mobility in Healthcare Industry Volume K Unit Forecast, by Country 2020 & 2033
- Table 17: United States Mobility in Healthcare Industry Revenue (Million) Forecast, by Application 2020 & 2033
- Table 18: United States Mobility in Healthcare Industry Volume (K Unit) Forecast, by Application 2020 & 2033
- Table 19: Canada Mobility in Healthcare Industry Revenue (Million) Forecast, by Application 2020 & 2033
- Table 20: Canada Mobility in Healthcare Industry Volume (K Unit) Forecast, by Application 2020 & 2033
- Table 21: Mexico Mobility in Healthcare Industry Revenue (Million) Forecast, by Application 2020 & 2033
- Table 22: Mexico Mobility in Healthcare Industry Volume (K Unit) Forecast, by Application 2020 & 2033
- Table 23: Global Mobility in Healthcare Industry Revenue Million Forecast, by Products and Services 2020 & 2033
- Table 24: Global Mobility in Healthcare Industry Volume K Unit Forecast, by Products and Services 2020 & 2033
- Table 25: Global Mobility in Healthcare Industry Revenue Million Forecast, by Application 2020 & 2033
- Table 26: Global Mobility in Healthcare Industry Volume K Unit Forecast, by Application 2020 & 2033
- Table 27: Global Mobility in Healthcare Industry Revenue Million Forecast, by End User 2020 & 2033
- Table 28: Global Mobility in Healthcare Industry Volume K Unit Forecast, by End User 2020 & 2033
- Table 29: Global Mobility in Healthcare Industry Revenue Million Forecast, by Country 2020 & 2033
- Table 30: Global Mobility in Healthcare Industry Volume K Unit Forecast, by Country 2020 & 2033
- Table 31: Germany Mobility in Healthcare Industry Revenue (Million) Forecast, by Application 2020 & 2033
- Table 32: Germany Mobility in Healthcare Industry Volume (K Unit) Forecast, by Application 2020 & 2033
- Table 33: United Kingdom Mobility in Healthcare Industry Revenue (Million) Forecast, by Application 2020 & 2033
- Table 34: United Kingdom Mobility in Healthcare Industry Volume (K Unit) Forecast, by Application 2020 & 2033
- Table 35: France Mobility in Healthcare Industry Revenue (Million) Forecast, by Application 2020 & 2033
- Table 36: France Mobility in Healthcare Industry Volume (K Unit) Forecast, by Application 2020 & 2033
- Table 37: Italy Mobility in Healthcare Industry Revenue (Million) Forecast, by Application 2020 & 2033
- Table 38: Italy Mobility in Healthcare Industry Volume (K Unit) Forecast, by Application 2020 & 2033
- Table 39: Spain Mobility in Healthcare Industry Revenue (Million) Forecast, by Application 2020 & 2033
- Table 40: Spain Mobility in Healthcare Industry Volume (K Unit) Forecast, by Application 2020 & 2033
- Table 41: Rest of Europe Mobility in Healthcare Industry Revenue (Million) Forecast, by Application 2020 & 2033
- Table 42: Rest of Europe Mobility in Healthcare Industry Volume (K Unit) Forecast, by Application 2020 & 2033
- Table 43: Global Mobility in Healthcare Industry Revenue Million Forecast, by Products and Services 2020 & 2033
- Table 44: Global Mobility in Healthcare Industry Volume K Unit Forecast, by Products and Services 2020 & 2033
- Table 45: Global Mobility in Healthcare Industry Revenue Million Forecast, by Application 2020 & 2033
- Table 46: Global Mobility in Healthcare Industry Volume K Unit Forecast, by Application 2020 & 2033
- Table 47: Global Mobility in Healthcare Industry Revenue Million Forecast, by End User 2020 & 2033
- Table 48: Global Mobility in Healthcare Industry Volume K Unit Forecast, by End User 2020 & 2033
- Table 49: Global Mobility in Healthcare Industry Revenue Million Forecast, by Country 2020 & 2033
- Table 50: Global Mobility in Healthcare Industry Volume K Unit Forecast, by Country 2020 & 2033
- Table 51: China Mobility in Healthcare Industry Revenue (Million) Forecast, by Application 2020 & 2033
- Table 52: China Mobility in Healthcare Industry Volume (K Unit) Forecast, by Application 2020 & 2033
- Table 53: Japan Mobility in Healthcare Industry Revenue (Million) Forecast, by Application 2020 & 2033
- Table 54: Japan Mobility in Healthcare Industry Volume (K Unit) Forecast, by Application 2020 & 2033
- Table 55: India Mobility in Healthcare Industry Revenue (Million) Forecast, by Application 2020 & 2033
- Table 56: India Mobility in Healthcare Industry Volume (K Unit) Forecast, by Application 2020 & 2033
- Table 57: Australia Mobility in Healthcare Industry Revenue (Million) Forecast, by Application 2020 & 2033
- Table 58: Australia Mobility in Healthcare Industry Volume (K Unit) Forecast, by Application 2020 & 2033
- Table 59: South Korea Mobility in Healthcare Industry Revenue (Million) Forecast, by Application 2020 & 2033
- Table 60: South Korea Mobility in Healthcare Industry Volume (K Unit) Forecast, by Application 2020 & 2033
- Table 61: Rest of Asia Pacific Mobility in Healthcare Industry Revenue (Million) Forecast, by Application 2020 & 2033
- Table 62: Rest of Asia Pacific Mobility in Healthcare Industry Volume (K Unit) Forecast, by Application 2020 & 2033
- Table 63: Global Mobility in Healthcare Industry Revenue Million Forecast, by Products and Services 2020 & 2033
- Table 64: Global Mobility in Healthcare Industry Volume K Unit Forecast, by Products and Services 2020 & 2033
- Table 65: Global Mobility in Healthcare Industry Revenue Million Forecast, by Application 2020 & 2033
- Table 66: Global Mobility in Healthcare Industry Volume K Unit Forecast, by Application 2020 & 2033
- Table 67: Global Mobility in Healthcare Industry Revenue Million Forecast, by End User 2020 & 2033
- Table 68: Global Mobility in Healthcare Industry Volume K Unit Forecast, by End User 2020 & 2033
- Table 69: Global Mobility in Healthcare Industry Revenue Million Forecast, by Country 2020 & 2033
- Table 70: Global Mobility in Healthcare Industry Volume K Unit Forecast, by Country 2020 & 2033
- Table 71: Global Mobility in Healthcare Industry Revenue Million Forecast, by Products and Services 2020 & 2033
- Table 72: Global Mobility in Healthcare Industry Volume K Unit Forecast, by Products and Services 2020 & 2033
- Table 73: Global Mobility in Healthcare Industry Revenue Million Forecast, by Application 2020 & 2033
- Table 74: Global Mobility in Healthcare Industry Volume K Unit Forecast, by Application 2020 & 2033
- Table 75: Global Mobility in Healthcare Industry Revenue Million Forecast, by End User 2020 & 2033
- Table 76: Global Mobility in Healthcare Industry Volume K Unit Forecast, by End User 2020 & 2033
- Table 77: Global Mobility in Healthcare Industry Revenue Million Forecast, by Country 2020 & 2033
- Table 78: Global Mobility in Healthcare Industry Volume K Unit Forecast, by Country 2020 & 2033
- Table 79: South Africa Mobility in Healthcare Industry Revenue (Million) Forecast, by Application 2020 & 2033
- Table 80: South Africa Mobility in Healthcare Industry Volume (K Unit) Forecast, by Application 2020 & 2033
- Table 81: Rest of Middle East Mobility in Healthcare Industry Revenue (Million) Forecast, by Application 2020 & 2033
- Table 82: Rest of Middle East Mobility in Healthcare Industry Volume (K Unit) Forecast, by Application 2020 & 2033
- Table 83: Global Mobility in Healthcare Industry Revenue Million Forecast, by Products and Services 2020 & 2033
- Table 84: Global Mobility in Healthcare Industry Volume K Unit Forecast, by Products and Services 2020 & 2033
- Table 85: Global Mobility in Healthcare Industry Revenue Million Forecast, by Application 2020 & 2033
- Table 86: Global Mobility in Healthcare Industry Volume K Unit Forecast, by Application 2020 & 2033
- Table 87: Global Mobility in Healthcare Industry Revenue Million Forecast, by End User 2020 & 2033
- Table 88: Global Mobility in Healthcare Industry Volume K Unit Forecast, by End User 2020 & 2033
- Table 89: Global Mobility in Healthcare Industry Revenue Million Forecast, by Country 2020 & 2033
- Table 90: Global Mobility in Healthcare Industry Volume K Unit Forecast, by Country 2020 & 2033
- Table 91: Brazil Mobility in Healthcare Industry Revenue (Million) Forecast, by Application 2020 & 2033
- Table 92: Brazil Mobility in Healthcare Industry Volume (K Unit) Forecast, by Application 2020 & 2033
- Table 93: Argentina Mobility in Healthcare Industry Revenue (Million) Forecast, by Application 2020 & 2033
- Table 94: Argentina Mobility in Healthcare Industry Volume (K Unit) Forecast, by Application 2020 & 2033
- Table 95: Rest of South America Mobility in Healthcare Industry Revenue (Million) Forecast, by Application 2020 & 2033
- Table 96: Rest of South America Mobility in Healthcare Industry Volume (K Unit) Forecast, by Application 2020 & 2033
Frequently Asked Questions
1. What is the projected Compound Annual Growth Rate (CAGR) of the Mobility in Healthcare Industry?
The projected CAGR is approximately 21.32%.
2. Which companies are prominent players in the Mobility in Healthcare Industry?
Key companies in the market include Mckesson Corporation, Zebra Technologies Corporation, Koninklijke Philips N V, Cisco Systems Inc, Airstrip Technologies Inc, Omron Corporation, At&T Inc, SAP SE, Oracle Cerner.
3. What are the main segments of the Mobility in Healthcare Industry?
The market segments include Products and Services, Application, End User.
4. Can you provide details about the market size?
The market size is estimated to be USD 135.43 Million as of 2022.
5. What are some drivers contributing to market growth?
Increasing Utilization of the Smart Devices (Smartphones. Smart watches. etc.); Increased Influence of the Social Media on Healthcare; Rise in the Demand of Personalized Medicines.
6. What are the notable trends driving market growth?
Patient Care Management Segment is Expected to Witness a Healthy Growth Over the Forecast Period.
7. Are there any restraints impacting market growth?
Safety and Security Issues Associated with Patient Health Information; Lack of Skilled Professionals.
8. Can you provide examples of recent developments in the market?
In August 2022, Indonesia's Health Ministry launched the Indonesia Health Services platform in Jakarta as a part of the country's health technology transformation.
9. What pricing options are available for accessing the report?
Pricing options include single-user, multi-user, and enterprise licenses priced at USD 4750, USD 5250, and USD 8750 respectively.
10. Is the market size provided in terms of value or volume?
The market size is provided in terms of value, measured in Million and volume, measured in K Unit.
11. Are there any specific market keywords associated with the report?
Yes, the market keyword associated with the report is "Mobility in Healthcare Industry," which aids in identifying and referencing the specific market segment covered.
12. How do I determine which pricing option suits my needs best?
The pricing options vary based on user requirements and access needs. Individual users may opt for single-user licenses, while businesses requiring broader access may choose multi-user or enterprise licenses for cost-effective access to the report.
13. Are there any additional resources or data provided in the Mobility in Healthcare Industry report?
While the report offers comprehensive insights, it's advisable to review the specific contents or supplementary materials provided to ascertain if additional resources or data are available.
14. How can I stay updated on further developments or reports in the Mobility in Healthcare Industry?
To stay informed about further developments, trends, and reports in the Mobility in Healthcare Industry, consider subscribing to industry newsletters, following relevant companies and organizations, or regularly checking reputable industry news sources and publications.
Methodology
Step 1 - Identification of Relevant Samples Size from Population Database


Step 2 - Approaches for Defining Global Market Size (Value, Volume* & Price*)

Note*: In applicable scenarios
Step 3 - Data Sources
Primary Research
- Web Analytics
- Survey Reports
- Research Institute
- Latest Research Reports
- Opinion Leaders
Secondary Research
- Annual Reports
- White Paper
- Latest Press Release
- Industry Association
- Paid Database
- Investor Presentations

Step 4 - Data Triangulation
Involves using different sources of information in order to increase the validity of a study
These sources are likely to be stakeholders in a program - participants, other researchers, program staff, other community members, and so on.
Then we put all data in single framework & apply various statistical tools to find out the dynamic on the market.
During the analysis stage, feedback from the stakeholder groups would be compared to determine areas of agreement as well as areas of divergence