

Key Insights
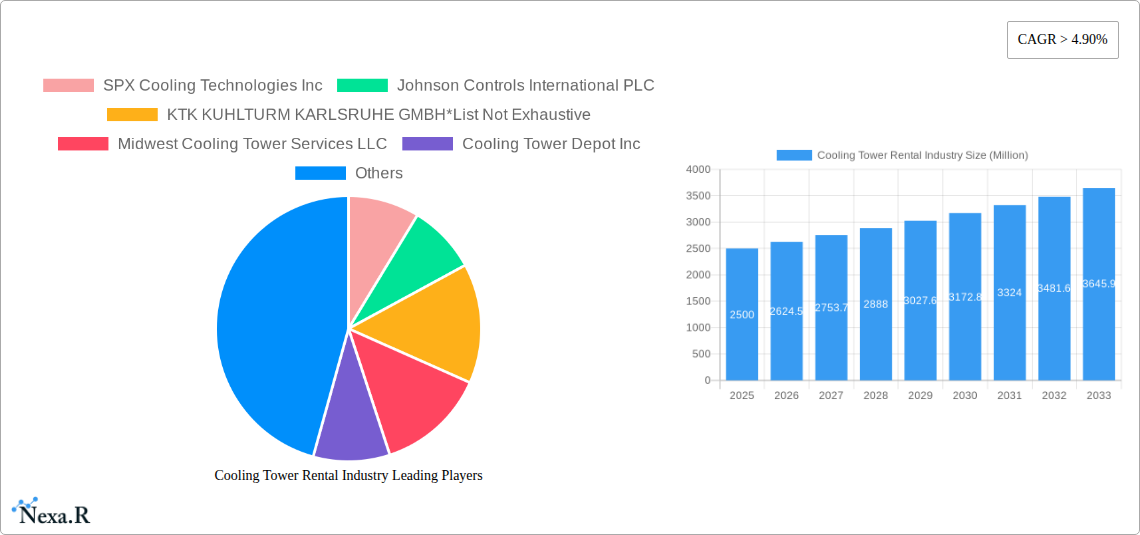
The global cooling tower rental market is experiencing robust growth, driven by increasing demand across diverse sectors. The market's Compound Annual Growth Rate (CAGR) exceeding 4.90% from 2019-2024 indicates a significant upward trajectory. This expansion is fueled primarily by the construction and manufacturing industries, where temporary cooling solutions are crucial for various projects and processes. The rising adoption of sustainable practices is also influencing growth, with rental options offering an environmentally responsible alternative to purchasing new equipment. Furthermore, the market's segmentation into wet, dry, and hybrid cooling towers caters to specific application needs, contributing to its overall dynamism. The dominance of North America and Europe in terms of market share is likely to continue, given the substantial industrial presence in these regions. However, Asia-Pacific, particularly China and India, is anticipated to experience remarkable growth, driven by rapid industrialization and infrastructure development. The rental model’s flexibility and cost-effectiveness are key advantages attracting various end-users.
The competitive landscape is characterized by a mix of both large multinational corporations and regional players. Major players like SPX Cooling Technologies Inc., Johnson Controls International PLC, and others are leveraging their established distribution networks and technological expertise to maintain their market position. However, smaller, specialized companies are also finding success by providing niche services and catering to localized demands. Future market growth will be influenced by factors such as technological advancements in cooling tower design, stricter environmental regulations promoting energy-efficient solutions, and the increasing adoption of modular and pre-fabricated construction practices. These trends will further propel the demand for flexible and adaptable rental solutions in the cooling tower industry. The continued expansion of the industrial and manufacturing sectors across emerging economies, particularly in Asia-Pacific, is expected to be a key driver of growth throughout the forecast period.
Cooling Tower Rental Industry Market Report: 2019-2033
This comprehensive report provides an in-depth analysis of the Cooling Tower Rental market, encompassing market dynamics, growth trends, regional performance, product landscape, key players, and future outlook. The report covers the period from 2019 to 2033, with 2025 as the base year and estimated year. It segments the market by type (Wet, Dry, Hybrid) and end-user (Commercial, Industrial), offering granular insights into this vital sector within the broader industrial cooling equipment market.
Cooling Tower Rental Industry Market Dynamics & Structure
This section analyzes the market structure, competitive landscape, and influential factors shaping the Cooling Tower Rental industry. The report delves into market concentration, identifying key players and their respective market share. We explore technological innovation, regulatory influences, the presence of substitute products, end-user demographics, and the impact of mergers and acquisitions (M&A) activity. Quantitative data, including market share percentages and M&A deal volumes (where available), is presented alongside qualitative insights such as barriers to innovation. The analysis will cover the historical period (2019-2024) and project the market dynamics for the forecast period (2025-2033).
- Market Concentration: xx% market share held by top 5 players.
- Technological Innovation: Focus on energy efficiency and automation driving innovation.
- Regulatory Framework: Compliance with environmental regulations influences market dynamics.
- Competitive Substitutes: Analysis of alternative cooling solutions and their market impact.
- End-User Demographics: Shifting demands from different industrial sectors analyzed.
- M&A Trends: Evaluation of consolidation and strategic partnerships within the industry. xx M&A deals recorded in the historical period.
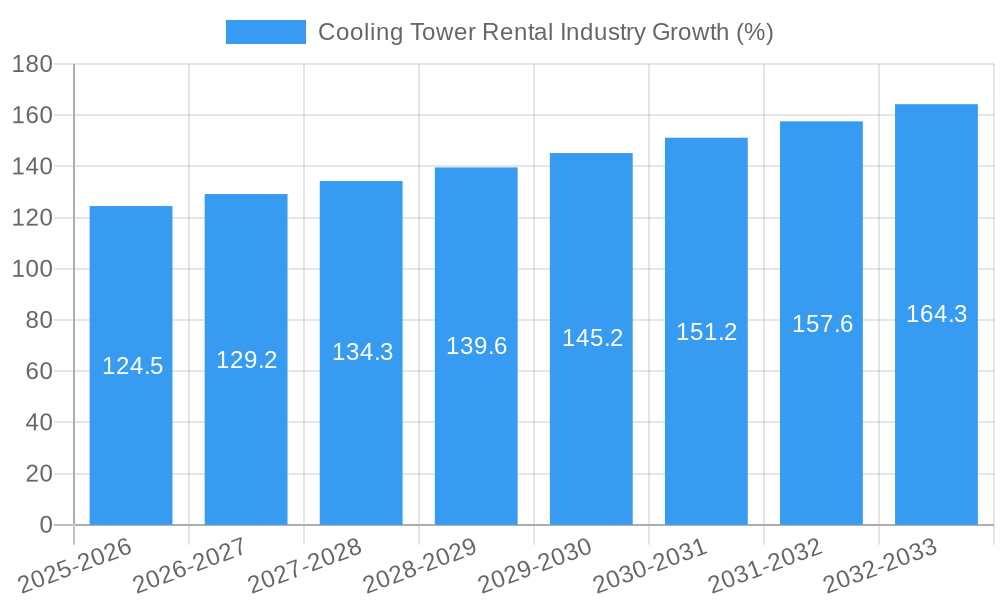
Cooling Tower Rental Industry Growth Trends & Insights
This section presents a detailed analysis of the Cooling Tower Rental market's growth trajectory. Leveraging extensive market research, the report examines market size evolution, adoption rates across different segments, the influence of technological disruptions, and changes in consumer behavior. The analysis includes precise metrics such as Compound Annual Growth Rate (CAGR) and market penetration rates, providing a comprehensive understanding of past performance and future projections. The impact of external factors like the COVID-19 pandemic, which significantly impacted the refinery sector and consequently cooling tower rental demand in 2020, is thoroughly assessed.
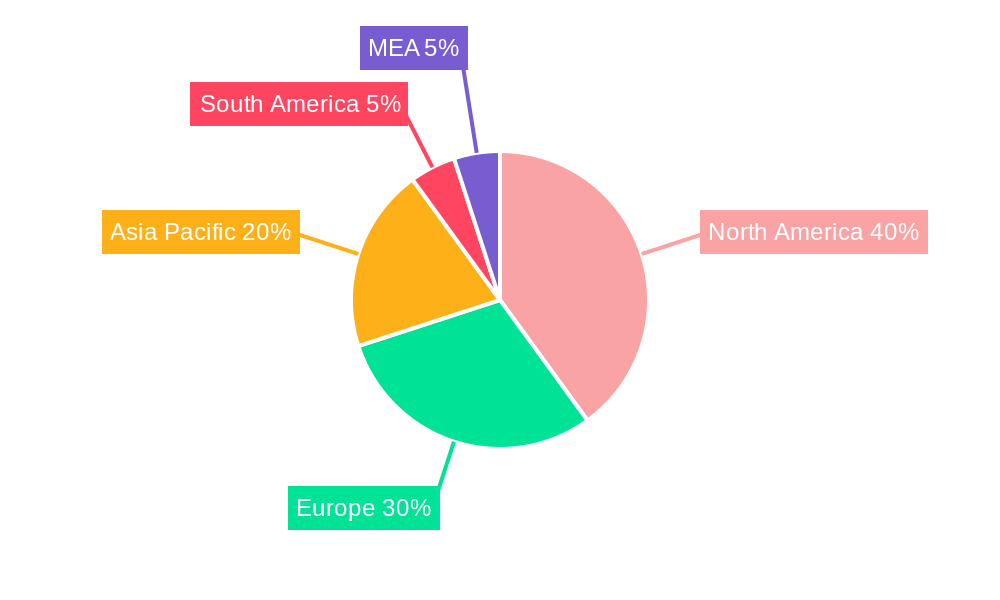
Dominant Regions, Countries, or Segments in Cooling Tower Rental Industry
This section pinpoints the leading geographic regions, countries, and market segments (Wet, Dry, Hybrid; Commercial, Industrial) driving market growth. It details the factors contributing to their dominance, including economic policies, infrastructure development, and unique market characteristics. Market share data and growth potential projections for each leading segment will be provided.
- Leading Region: North America, driven by robust industrial activity.
- Key Country: United States, benefiting from high industrial output and demand.
- Dominant Segment (Type): Wet cooling towers, due to cost-effectiveness and wide applicability.
- Dominant Segment (End-User): Industrial sector, accounting for xx% of market share.
- Key Drivers: Strong industrial growth, infrastructure investments, and favorable government policies.
Cooling Tower Rental Industry Product Landscape
This section provides a concise overview of product innovations, applications, and performance metrics in the cooling tower rental industry. It highlights unique selling propositions (USPs) of different rental offerings and discusses technological advancements, including energy efficiency improvements and remote monitoring capabilities.
Key Drivers, Barriers & Challenges in Cooling Tower Rental Industry
This section identifies the primary drivers and restraining forces affecting the Cooling Tower Rental market. Drivers include increasing industrialization, rising demand for efficient cooling solutions, and technological advancements. Challenges involve supply chain disruptions, regulatory hurdles, and intense competition. Quantifiable impacts of these challenges are assessed wherever possible.
Drivers:
- Growing industrialization in developing economies.
- Demand for energy-efficient cooling solutions.
- Technological advancements in cooling tower design.
Challenges:
- Supply chain disruptions impacting component availability.
- Stringent environmental regulations.
- Intense competition among rental providers. xx% decrease in rental prices observed in 2022 due to competition.
Emerging Opportunities in Cooling Tower Rental Industry
This section highlights emerging trends and lucrative opportunities within the cooling tower rental market. It explores untapped market segments, innovative applications, and evolving consumer preferences, such as the rising adoption of smart technologies and demand for sustainable cooling solutions.
Growth Accelerators in the Cooling Tower Rental Industry
This section identifies key catalysts driving long-term growth in the Cooling Tower Rental market. It focuses on technological breakthroughs, strategic partnerships, and market expansion strategies that will shape the future of the industry. This includes the potential for growth in renewable energy sectors demanding efficient cooling solutions.
Key Players Shaping the Cooling Tower Rental Industry Market
- SPX Cooling Technologies Inc.
- Johnson Controls International PLC
- KTK KUHLTURM KARLSRUHE GMBH
- Midwest Cooling Tower Services LLC
- Cooling Tower Depot Inc
- Caterpillar Inc
- Aggreko PLC
- Baltimore Aircoil Co
- Carrier Rental Systems Inc
- United Rentals Inc
Notable Milestones in Cooling Tower Rental Industry Sector
- 2020 Q2: Significant decline in demand due to COVID-19 related refinery shutdowns.
- 2021 Q4: Gradual market recovery as industrial activity resumed.
- 2022 Q3: Increased investment in energy-efficient cooling tower technologies.
- 2023: xx (add any significant developments such as product launches or mergers)
In-Depth Cooling Tower Rental Industry Market Outlook
This section summarizes the growth drivers and strategic opportunities identified throughout the report, providing a concise outlook on the future potential of the Cooling Tower Rental market. The forecast period (2025-2033) is analyzed for future growth and potential market expansion opportunities, with focus on technological advancements and emerging market segments.
Cooling Tower Rental Industry Segmentation
-
1. Type
- 1.1. Wet
- 1.2. Dry
- 1.3. Hybrid
-
2. End User
- 2.1. Commercial
- 2.2. Industrial
Cooling Tower Rental Industry Segmentation By Geography
- 1. North America
- 2. Europe
- 3. Asia Pacific
- 4. Middle East and Africa
- 5. South America
Cooling Tower Rental Industry REPORT HIGHLIGHTS
| Aspects | Details |
|---|---|
| Study Period | 2019-2033 |
| Base Year | 2024 |
| Estimated Year | 2025 |
| Forecast Period | 2025-2033 |
| Historical Period | 2019-2024 |
| Growth Rate | CAGR of > 4.90% from 2019-2033 |
| Segmentation |
|
Table of Contents
- 1. Introduction
- 1.1. Research Scope
- 1.2. Market Segmentation
- 1.3. Research Methodology
- 1.4. Definitions and Assumptions
- 2. Executive Summary
- 2.1. Introduction
- 3. Market Dynamics
- 3.1. Introduction
- 3.2. Market Drivers
- 3.2.1. 4.; Favorable Government Policies
- 3.3. Market Restrains
- 3.3.1. 4.; Rising Emphasis on Other Alternative Clean Energy Sources
- 3.4. Market Trends
- 3.4.1. Industrial Segment to Dominate the Market
- 4. Market Factor Analysis
- 4.1. Porters Five Forces
- 4.2. Supply/Value Chain
- 4.3. PESTEL analysis
- 4.4. Market Entropy
- 4.5. Patent/Trademark Analysis
- 5. Global Cooling Tower Rental Industry Analysis, Insights and Forecast, 2019-2031
- 5.1. Market Analysis, Insights and Forecast - by Type
- 5.1.1. Wet
- 5.1.2. Dry
- 5.1.3. Hybrid
- 5.2. Market Analysis, Insights and Forecast - by End User
- 5.2.1. Commercial
- 5.2.2. Industrial
- 5.3. Market Analysis, Insights and Forecast - by Region
- 5.3.1. North America
- 5.3.2. Europe
- 5.3.3. Asia Pacific
- 5.3.4. Middle East and Africa
- 5.3.5. South America
- 5.1. Market Analysis, Insights and Forecast - by Type
- 6. North America Cooling Tower Rental Industry Analysis, Insights and Forecast, 2019-2031
- 6.1. Market Analysis, Insights and Forecast - by Type
- 6.1.1. Wet
- 6.1.2. Dry
- 6.1.3. Hybrid
- 6.2. Market Analysis, Insights and Forecast - by End User
- 6.2.1. Commercial
- 6.2.2. Industrial
- 6.1. Market Analysis, Insights and Forecast - by Type
- 7. Europe Cooling Tower Rental Industry Analysis, Insights and Forecast, 2019-2031
- 7.1. Market Analysis, Insights and Forecast - by Type
- 7.1.1. Wet
- 7.1.2. Dry
- 7.1.3. Hybrid
- 7.2. Market Analysis, Insights and Forecast - by End User
- 7.2.1. Commercial
- 7.2.2. Industrial
- 7.1. Market Analysis, Insights and Forecast - by Type
- 8. Asia Pacific Cooling Tower Rental Industry Analysis, Insights and Forecast, 2019-2031
- 8.1. Market Analysis, Insights and Forecast - by Type
- 8.1.1. Wet
- 8.1.2. Dry
- 8.1.3. Hybrid
- 8.2. Market Analysis, Insights and Forecast - by End User
- 8.2.1. Commercial
- 8.2.2. Industrial
- 8.1. Market Analysis, Insights and Forecast - by Type
- 9. Middle East and Africa Cooling Tower Rental Industry Analysis, Insights and Forecast, 2019-2031
- 9.1. Market Analysis, Insights and Forecast - by Type
- 9.1.1. Wet
- 9.1.2. Dry
- 9.1.3. Hybrid
- 9.2. Market Analysis, Insights and Forecast - by End User
- 9.2.1. Commercial
- 9.2.2. Industrial
- 9.1. Market Analysis, Insights and Forecast - by Type
- 10. South America Cooling Tower Rental Industry Analysis, Insights and Forecast, 2019-2031
- 10.1. Market Analysis, Insights and Forecast - by Type
- 10.1.1. Wet
- 10.1.2. Dry
- 10.1.3. Hybrid
- 10.2. Market Analysis, Insights and Forecast - by End User
- 10.2.1. Commercial
- 10.2.2. Industrial
- 10.1. Market Analysis, Insights and Forecast - by Type
- 11. North America Cooling Tower Rental Industry Analysis, Insights and Forecast, 2019-2031
- 11.1. Market Analysis, Insights and Forecast - By Country/Sub-region
- 11.1.1 United States
- 11.1.2 Canada
- 11.1.3 Mexico
- 12. Europe Cooling Tower Rental Industry Analysis, Insights and Forecast, 2019-2031
- 12.1. Market Analysis, Insights and Forecast - By Country/Sub-region
- 12.1.1 Germany
- 12.1.2 United Kingdom
- 12.1.3 France
- 12.1.4 Spain
- 12.1.5 Italy
- 12.1.6 Spain
- 12.1.7 Belgium
- 12.1.8 Netherland
- 12.1.9 Nordics
- 12.1.10 Rest of Europe
- 13. Asia Pacific Cooling Tower Rental Industry Analysis, Insights and Forecast, 2019-2031
- 13.1. Market Analysis, Insights and Forecast - By Country/Sub-region
- 13.1.1 China
- 13.1.2 Japan
- 13.1.3 India
- 13.1.4 South Korea
- 13.1.5 Southeast Asia
- 13.1.6 Australia
- 13.1.7 Indonesia
- 13.1.8 Phillipes
- 13.1.9 Singapore
- 13.1.10 Thailandc
- 13.1.11 Rest of Asia Pacific
- 14. South America Cooling Tower Rental Industry Analysis, Insights and Forecast, 2019-2031
- 14.1. Market Analysis, Insights and Forecast - By Country/Sub-region
- 14.1.1 Brazil
- 14.1.2 Argentina
- 14.1.3 Peru
- 14.1.4 Chile
- 14.1.5 Colombia
- 14.1.6 Ecuador
- 14.1.7 Venezuela
- 14.1.8 Rest of South America
- 15. North America Cooling Tower Rental Industry Analysis, Insights and Forecast, 2019-2031
- 15.1. Market Analysis, Insights and Forecast - By Country/Sub-region
- 15.1.1 United States
- 15.1.2 Canada
- 15.1.3 Mexico
- 16. MEA Cooling Tower Rental Industry Analysis, Insights and Forecast, 2019-2031
- 16.1. Market Analysis, Insights and Forecast - By Country/Sub-region
- 16.1.1 United Arab Emirates
- 16.1.2 Saudi Arabia
- 16.1.3 South Africa
- 16.1.4 Rest of Middle East and Africa
- 17. Competitive Analysis
- 17.1. Global Market Share Analysis 2024
- 17.2. Company Profiles
- 17.2.1 SPX Cooling Technologies Inc
- 17.2.1.1. Overview
- 17.2.1.2. Products
- 17.2.1.3. SWOT Analysis
- 17.2.1.4. Recent Developments
- 17.2.1.5. Financials (Based on Availability)
- 17.2.2 Johnson Controls International PLC
- 17.2.2.1. Overview
- 17.2.2.2. Products
- 17.2.2.3. SWOT Analysis
- 17.2.2.4. Recent Developments
- 17.2.2.5. Financials (Based on Availability)
- 17.2.3 KTK KUHLTURM KARLSRUHE GMBH*List Not Exhaustive
- 17.2.3.1. Overview
- 17.2.3.2. Products
- 17.2.3.3. SWOT Analysis
- 17.2.3.4. Recent Developments
- 17.2.3.5. Financials (Based on Availability)
- 17.2.4 Midwest Cooling Tower Services LLC
- 17.2.4.1. Overview
- 17.2.4.2. Products
- 17.2.4.3. SWOT Analysis
- 17.2.4.4. Recent Developments
- 17.2.4.5. Financials (Based on Availability)
- 17.2.5 Cooling Tower Depot Inc
- 17.2.5.1. Overview
- 17.2.5.2. Products
- 17.2.5.3. SWOT Analysis
- 17.2.5.4. Recent Developments
- 17.2.5.5. Financials (Based on Availability)
- 17.2.6 Caterpillar Inc
- 17.2.6.1. Overview
- 17.2.6.2. Products
- 17.2.6.3. SWOT Analysis
- 17.2.6.4. Recent Developments
- 17.2.6.5. Financials (Based on Availability)
- 17.2.7 Aggreko PLC
- 17.2.7.1. Overview
- 17.2.7.2. Products
- 17.2.7.3. SWOT Analysis
- 17.2.7.4. Recent Developments
- 17.2.7.5. Financials (Based on Availability)
- 17.2.8 Baltimore Aircoil Co
- 17.2.8.1. Overview
- 17.2.8.2. Products
- 17.2.8.3. SWOT Analysis
- 17.2.8.4. Recent Developments
- 17.2.8.5. Financials (Based on Availability)
- 17.2.9 Carrier Rental Systems Inc
- 17.2.9.1. Overview
- 17.2.9.2. Products
- 17.2.9.3. SWOT Analysis
- 17.2.9.4. Recent Developments
- 17.2.9.5. Financials (Based on Availability)
- 17.2.10 United Rentals Inc
- 17.2.10.1. Overview
- 17.2.10.2. Products
- 17.2.10.3. SWOT Analysis
- 17.2.10.4. Recent Developments
- 17.2.10.5. Financials (Based on Availability)
- 17.2.1 SPX Cooling Technologies Inc
List of Figures
- Figure 1: Global Cooling Tower Rental Industry Revenue Breakdown (Million, %) by Region 2024 & 2032
- Figure 2: North America Cooling Tower Rental Industry Revenue (Million), by Country 2024 & 2032
- Figure 3: North America Cooling Tower Rental Industry Revenue Share (%), by Country 2024 & 2032
- Figure 4: Europe Cooling Tower Rental Industry Revenue (Million), by Country 2024 & 2032
- Figure 5: Europe Cooling Tower Rental Industry Revenue Share (%), by Country 2024 & 2032
- Figure 6: Asia Pacific Cooling Tower Rental Industry Revenue (Million), by Country 2024 & 2032
- Figure 7: Asia Pacific Cooling Tower Rental Industry Revenue Share (%), by Country 2024 & 2032
- Figure 8: South America Cooling Tower Rental Industry Revenue (Million), by Country 2024 & 2032
- Figure 9: South America Cooling Tower Rental Industry Revenue Share (%), by Country 2024 & 2032
- Figure 10: North America Cooling Tower Rental Industry Revenue (Million), by Country 2024 & 2032
- Figure 11: North America Cooling Tower Rental Industry Revenue Share (%), by Country 2024 & 2032
- Figure 12: MEA Cooling Tower Rental Industry Revenue (Million), by Country 2024 & 2032
- Figure 13: MEA Cooling Tower Rental Industry Revenue Share (%), by Country 2024 & 2032
- Figure 14: North America Cooling Tower Rental Industry Revenue (Million), by Type 2024 & 2032
- Figure 15: North America Cooling Tower Rental Industry Revenue Share (%), by Type 2024 & 2032
- Figure 16: North America Cooling Tower Rental Industry Revenue (Million), by End User 2024 & 2032
- Figure 17: North America Cooling Tower Rental Industry Revenue Share (%), by End User 2024 & 2032
- Figure 18: North America Cooling Tower Rental Industry Revenue (Million), by Country 2024 & 2032
- Figure 19: North America Cooling Tower Rental Industry Revenue Share (%), by Country 2024 & 2032
- Figure 20: Europe Cooling Tower Rental Industry Revenue (Million), by Type 2024 & 2032
- Figure 21: Europe Cooling Tower Rental Industry Revenue Share (%), by Type 2024 & 2032
- Figure 22: Europe Cooling Tower Rental Industry Revenue (Million), by End User 2024 & 2032
- Figure 23: Europe Cooling Tower Rental Industry Revenue Share (%), by End User 2024 & 2032
- Figure 24: Europe Cooling Tower Rental Industry Revenue (Million), by Country 2024 & 2032
- Figure 25: Europe Cooling Tower Rental Industry Revenue Share (%), by Country 2024 & 2032
- Figure 26: Asia Pacific Cooling Tower Rental Industry Revenue (Million), by Type 2024 & 2032
- Figure 27: Asia Pacific Cooling Tower Rental Industry Revenue Share (%), by Type 2024 & 2032
- Figure 28: Asia Pacific Cooling Tower Rental Industry Revenue (Million), by End User 2024 & 2032
- Figure 29: Asia Pacific Cooling Tower Rental Industry Revenue Share (%), by End User 2024 & 2032
- Figure 30: Asia Pacific Cooling Tower Rental Industry Revenue (Million), by Country 2024 & 2032
- Figure 31: Asia Pacific Cooling Tower Rental Industry Revenue Share (%), by Country 2024 & 2032
- Figure 32: Middle East and Africa Cooling Tower Rental Industry Revenue (Million), by Type 2024 & 2032
- Figure 33: Middle East and Africa Cooling Tower Rental Industry Revenue Share (%), by Type 2024 & 2032
- Figure 34: Middle East and Africa Cooling Tower Rental Industry Revenue (Million), by End User 2024 & 2032
- Figure 35: Middle East and Africa Cooling Tower Rental Industry Revenue Share (%), by End User 2024 & 2032
- Figure 36: Middle East and Africa Cooling Tower Rental Industry Revenue (Million), by Country 2024 & 2032
- Figure 37: Middle East and Africa Cooling Tower Rental Industry Revenue Share (%), by Country 2024 & 2032
- Figure 38: South America Cooling Tower Rental Industry Revenue (Million), by Type 2024 & 2032
- Figure 39: South America Cooling Tower Rental Industry Revenue Share (%), by Type 2024 & 2032
- Figure 40: South America Cooling Tower Rental Industry Revenue (Million), by End User 2024 & 2032
- Figure 41: South America Cooling Tower Rental Industry Revenue Share (%), by End User 2024 & 2032
- Figure 42: South America Cooling Tower Rental Industry Revenue (Million), by Country 2024 & 2032
- Figure 43: South America Cooling Tower Rental Industry Revenue Share (%), by Country 2024 & 2032
List of Tables
- Table 1: Global Cooling Tower Rental Industry Revenue Million Forecast, by Region 2019 & 2032
- Table 2: Global Cooling Tower Rental Industry Revenue Million Forecast, by Type 2019 & 2032
- Table 3: Global Cooling Tower Rental Industry Revenue Million Forecast, by End User 2019 & 2032
- Table 4: Global Cooling Tower Rental Industry Revenue Million Forecast, by Region 2019 & 2032
- Table 5: Global Cooling Tower Rental Industry Revenue Million Forecast, by Country 2019 & 2032
- Table 6: United States Cooling Tower Rental Industry Revenue (Million) Forecast, by Application 2019 & 2032
- Table 7: Canada Cooling Tower Rental Industry Revenue (Million) Forecast, by Application 2019 & 2032
- Table 8: Mexico Cooling Tower Rental Industry Revenue (Million) Forecast, by Application 2019 & 2032
- Table 9: Global Cooling Tower Rental Industry Revenue Million Forecast, by Country 2019 & 2032
- Table 10: Germany Cooling Tower Rental Industry Revenue (Million) Forecast, by Application 2019 & 2032
- Table 11: United Kingdom Cooling Tower Rental Industry Revenue (Million) Forecast, by Application 2019 & 2032
- Table 12: France Cooling Tower Rental Industry Revenue (Million) Forecast, by Application 2019 & 2032
- Table 13: Spain Cooling Tower Rental Industry Revenue (Million) Forecast, by Application 2019 & 2032
- Table 14: Italy Cooling Tower Rental Industry Revenue (Million) Forecast, by Application 2019 & 2032
- Table 15: Spain Cooling Tower Rental Industry Revenue (Million) Forecast, by Application 2019 & 2032
- Table 16: Belgium Cooling Tower Rental Industry Revenue (Million) Forecast, by Application 2019 & 2032
- Table 17: Netherland Cooling Tower Rental Industry Revenue (Million) Forecast, by Application 2019 & 2032
- Table 18: Nordics Cooling Tower Rental Industry Revenue (Million) Forecast, by Application 2019 & 2032
- Table 19: Rest of Europe Cooling Tower Rental Industry Revenue (Million) Forecast, by Application 2019 & 2032
- Table 20: Global Cooling Tower Rental Industry Revenue Million Forecast, by Country 2019 & 2032
- Table 21: China Cooling Tower Rental Industry Revenue (Million) Forecast, by Application 2019 & 2032
- Table 22: Japan Cooling Tower Rental Industry Revenue (Million) Forecast, by Application 2019 & 2032
- Table 23: India Cooling Tower Rental Industry Revenue (Million) Forecast, by Application 2019 & 2032
- Table 24: South Korea Cooling Tower Rental Industry Revenue (Million) Forecast, by Application 2019 & 2032
- Table 25: Southeast Asia Cooling Tower Rental Industry Revenue (Million) Forecast, by Application 2019 & 2032
- Table 26: Australia Cooling Tower Rental Industry Revenue (Million) Forecast, by Application 2019 & 2032
- Table 27: Indonesia Cooling Tower Rental Industry Revenue (Million) Forecast, by Application 2019 & 2032
- Table 28: Phillipes Cooling Tower Rental Industry Revenue (Million) Forecast, by Application 2019 & 2032
- Table 29: Singapore Cooling Tower Rental Industry Revenue (Million) Forecast, by Application 2019 & 2032
- Table 30: Thailandc Cooling Tower Rental Industry Revenue (Million) Forecast, by Application 2019 & 2032
- Table 31: Rest of Asia Pacific Cooling Tower Rental Industry Revenue (Million) Forecast, by Application 2019 & 2032
- Table 32: Global Cooling Tower Rental Industry Revenue Million Forecast, by Country 2019 & 2032
- Table 33: Brazil Cooling Tower Rental Industry Revenue (Million) Forecast, by Application 2019 & 2032
- Table 34: Argentina Cooling Tower Rental Industry Revenue (Million) Forecast, by Application 2019 & 2032
- Table 35: Peru Cooling Tower Rental Industry Revenue (Million) Forecast, by Application 2019 & 2032
- Table 36: Chile Cooling Tower Rental Industry Revenue (Million) Forecast, by Application 2019 & 2032
- Table 37: Colombia Cooling Tower Rental Industry Revenue (Million) Forecast, by Application 2019 & 2032
- Table 38: Ecuador Cooling Tower Rental Industry Revenue (Million) Forecast, by Application 2019 & 2032
- Table 39: Venezuela Cooling Tower Rental Industry Revenue (Million) Forecast, by Application 2019 & 2032
- Table 40: Rest of South America Cooling Tower Rental Industry Revenue (Million) Forecast, by Application 2019 & 2032
- Table 41: Global Cooling Tower Rental Industry Revenue Million Forecast, by Country 2019 & 2032
- Table 42: United States Cooling Tower Rental Industry Revenue (Million) Forecast, by Application 2019 & 2032
- Table 43: Canada Cooling Tower Rental Industry Revenue (Million) Forecast, by Application 2019 & 2032
- Table 44: Mexico Cooling Tower Rental Industry Revenue (Million) Forecast, by Application 2019 & 2032
- Table 45: Global Cooling Tower Rental Industry Revenue Million Forecast, by Country 2019 & 2032
- Table 46: United Arab Emirates Cooling Tower Rental Industry Revenue (Million) Forecast, by Application 2019 & 2032
- Table 47: Saudi Arabia Cooling Tower Rental Industry Revenue (Million) Forecast, by Application 2019 & 2032
- Table 48: South Africa Cooling Tower Rental Industry Revenue (Million) Forecast, by Application 2019 & 2032
- Table 49: Rest of Middle East and Africa Cooling Tower Rental Industry Revenue (Million) Forecast, by Application 2019 & 2032
- Table 50: Global Cooling Tower Rental Industry Revenue Million Forecast, by Type 2019 & 2032
- Table 51: Global Cooling Tower Rental Industry Revenue Million Forecast, by End User 2019 & 2032
- Table 52: Global Cooling Tower Rental Industry Revenue Million Forecast, by Country 2019 & 2032
- Table 53: Global Cooling Tower Rental Industry Revenue Million Forecast, by Type 2019 & 2032
- Table 54: Global Cooling Tower Rental Industry Revenue Million Forecast, by End User 2019 & 2032
- Table 55: Global Cooling Tower Rental Industry Revenue Million Forecast, by Country 2019 & 2032
- Table 56: Global Cooling Tower Rental Industry Revenue Million Forecast, by Type 2019 & 2032
- Table 57: Global Cooling Tower Rental Industry Revenue Million Forecast, by End User 2019 & 2032
- Table 58: Global Cooling Tower Rental Industry Revenue Million Forecast, by Country 2019 & 2032
- Table 59: Global Cooling Tower Rental Industry Revenue Million Forecast, by Type 2019 & 2032
- Table 60: Global Cooling Tower Rental Industry Revenue Million Forecast, by End User 2019 & 2032
- Table 61: Global Cooling Tower Rental Industry Revenue Million Forecast, by Country 2019 & 2032
- Table 62: Global Cooling Tower Rental Industry Revenue Million Forecast, by Type 2019 & 2032
- Table 63: Global Cooling Tower Rental Industry Revenue Million Forecast, by End User 2019 & 2032
- Table 64: Global Cooling Tower Rental Industry Revenue Million Forecast, by Country 2019 & 2032
Frequently Asked Questions
1. What is the projected Compound Annual Growth Rate (CAGR) of the Cooling Tower Rental Industry?
The projected CAGR is approximately > 4.90%.
2. Which companies are prominent players in the Cooling Tower Rental Industry?
Key companies in the market include SPX Cooling Technologies Inc, Johnson Controls International PLC, KTK KUHLTURM KARLSRUHE GMBH*List Not Exhaustive, Midwest Cooling Tower Services LLC, Cooling Tower Depot Inc, Caterpillar Inc, Aggreko PLC, Baltimore Aircoil Co, Carrier Rental Systems Inc, United Rentals Inc.
3. What are the main segments of the Cooling Tower Rental Industry?
The market segments include Type, End User.
4. Can you provide details about the market size?
The market size is estimated to be USD XX Million as of 2022.
5. What are some drivers contributing to market growth?
4.; Favorable Government Policies.
6. What are the notable trends driving market growth?
Industrial Segment to Dominate the Market.
7. Are there any restraints impacting market growth?
4.; Rising Emphasis on Other Alternative Clean Energy Sources.
8. Can you provide examples of recent developments in the market?
Restrictions and impacts related to COVID-19 significantly reduced activities like air travel and commuting. This reduced the demand for fuels for transportation, and the shutdown restrictions on refineries affected the downstream sector in 2020. Since cooling towers play a major role in refinery operations, the shutdowns and reduced production rates affected the market for cooling tower rental.
9. What pricing options are available for accessing the report?
Pricing options include single-user, multi-user, and enterprise licenses priced at USD 4750, USD 5250, and USD 8750 respectively.
10. Is the market size provided in terms of value or volume?
The market size is provided in terms of value, measured in Million.
11. Are there any specific market keywords associated with the report?
Yes, the market keyword associated with the report is "Cooling Tower Rental Industry," which aids in identifying and referencing the specific market segment covered.
12. How do I determine which pricing option suits my needs best?
The pricing options vary based on user requirements and access needs. Individual users may opt for single-user licenses, while businesses requiring broader access may choose multi-user or enterprise licenses for cost-effective access to the report.
13. Are there any additional resources or data provided in the Cooling Tower Rental Industry report?
While the report offers comprehensive insights, it's advisable to review the specific contents or supplementary materials provided to ascertain if additional resources or data are available.
14. How can I stay updated on further developments or reports in the Cooling Tower Rental Industry?
To stay informed about further developments, trends, and reports in the Cooling Tower Rental Industry, consider subscribing to industry newsletters, following relevant companies and organizations, or regularly checking reputable industry news sources and publications.
Methodology
Step 1 - Identification of Relevant Samples Size from Population Database


Step 2 - Approaches for Defining Global Market Size (Value, Volume* & Price*)

Note*: In applicable scenarios
Step 3 - Data Sources
Primary Research
- Web Analytics
- Survey Reports
- Research Institute
- Latest Research Reports
- Opinion Leaders
Secondary Research
- Annual Reports
- White Paper
- Latest Press Release
- Industry Association
- Paid Database
- Investor Presentations

Step 4 - Data Triangulation
Involves using different sources of information in order to increase the validity of a study
These sources are likely to be stakeholders in a program - participants, other researchers, program staff, other community members, and so on.
Then we put all data in single framework & apply various statistical tools to find out the dynamic on the market.
During the analysis stage, feedback from the stakeholder groups would be compared to determine areas of agreement as well as areas of divergence
