

Key Insights
The European hydro turbine market, valued at €58.5 billion in 2024, is projected to grow at a compound annual growth rate (CAGR) of 3.4% through 2033. This expansion is driven by the escalating need for renewable energy to combat climate change, substantial investments in hydroelectric power, and advancements in turbine technology (including reaction and impulse designs) that improve efficiency and cost-effectiveness. Supportive government policies, incentives, and favorable regulations across key European nations are further accelerating market development. Germany, France, Italy, and the United Kingdom are prominent contributors to this market growth.
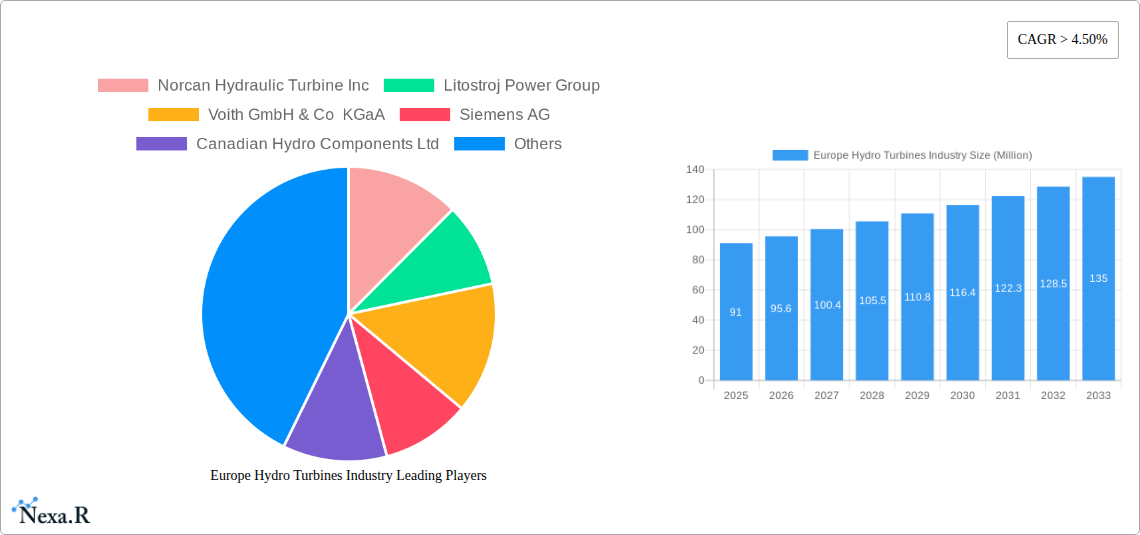
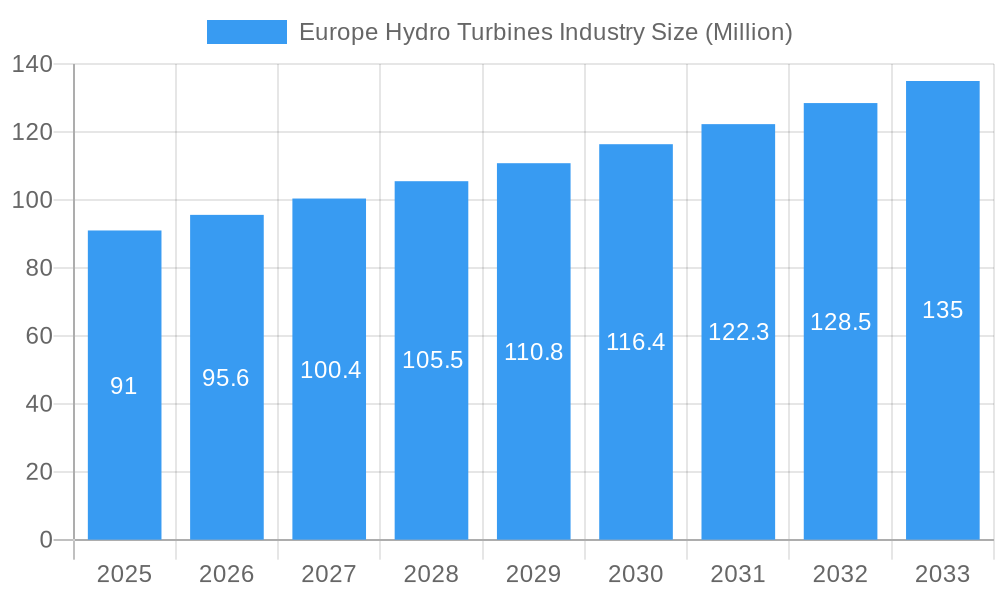
Europe Hydro Turbines Industry Market Size (In Billion)
Despite these positive trends, market expansion faces constraints. These include the limited availability of suitable sites for new hydropower projects, particularly in urbanized regions, and the high initial capital investment required for infrastructure development. Environmental considerations concerning the impact of dams on aquatic ecosystems necessitate meticulous planning and mitigation efforts, increasing project complexity and costs. Nevertheless, the long-term outlook for the European hydro turbine market remains robust, supported by persistent demand for renewable energy and ongoing technological innovation across small, medium, and large-scale projects. Leading companies such as Voith, Siemens, and Andritz are well-positioned to capitalize on this growth through innovation and strategic market expansion.
Europe Hydro Turbines Industry Company Market Share
Europe Hydro Turbines Industry: A Comprehensive Market Report (2019-2033)
This comprehensive report provides an in-depth analysis of the Europe Hydro Turbines Industry, encompassing market dynamics, growth trends, regional dominance, product landscape, key players, and future outlook. The study period covers 2019-2033, with 2025 as the base year and a forecast period extending to 2033. The report utilizes a combination of quantitative data and qualitative insights to deliver actionable intelligence for industry professionals. This detailed analysis covers the parent market of Renewable Energy and the child market of Hydropower Generation, providing a granular perspective on this crucial sector.
Europe Hydro Turbines Industry Market Dynamics & Structure
The European hydro turbine market is characterized by a moderately concentrated landscape with a few major players holding significant market share. Technological innovation, driven by efficiency improvements and integration with smart grids, plays a crucial role. Stringent environmental regulations and the increasing focus on renewable energy sources are key drivers. Competition from alternative energy sources, such as wind and solar, presents a challenge. End-user demographics, primarily comprising energy generation companies and governmental entities, influence market demand. M&A activity within the sector remains moderate, with xx deals recorded in the historical period (2019-2024), representing an average deal value of xx Million.
- Market Concentration: Moderately concentrated, with top 5 players holding approximately 60% market share (estimated).
- Technological Innovation: Focus on improving efficiency (e.g., higher energy conversion rates), reducing maintenance costs, and integrating smart grid technologies.
- Regulatory Framework: Stringent environmental regulations, incentives for renewable energy adoption, and grid modernization initiatives significantly impact market growth.
- Competitive Substitutes: Wind, solar, and other renewable energy sources.
- End-User Demographics: Primarily utility companies, independent power producers (IPPs), and governmental organizations.
- M&A Trends: Moderate M&A activity, driven by expansion strategies and technological collaborations.
Europe Hydro Turbines Industry Growth Trends & Insights
The European hydro turbine market experienced steady growth during the historical period (2019-2024), with a CAGR of xx%. This growth is attributed to factors such as increasing demand for renewable energy, government support for hydropower projects, and advancements in turbine technology. The market size in 2024 was estimated at xx Million, and is projected to reach xx Million by 2033, exhibiting a CAGR of xx% during the forecast period (2025-2033). Market penetration rates vary across different regions and turbine capacity segments. Technological disruptions, such as the development of more efficient and sustainable turbines, are further driving market expansion. Consumer behavior shifts towards greater environmental consciousness underpin the sustained growth trajectory. Furthermore, the rising awareness of climate change is expected to further fuel demand for cleaner energy sources, creating favorable market conditions.
Dominant Regions, Countries, or Segments in Europe Hydro Turbines Industry
The countries with the largest installed hydropower capacity, such as Norway, Switzerland, Austria, and France, represent the dominant segments of the market. The large (greater than 100MW) capacity segment dominates overall market revenue. Within technology segments, reaction turbines currently hold a larger market share than impulse turbines, owing to their suitability for various applications.
Key Drivers:
- Government Policies: Supportive renewable energy policies and investments in hydropower infrastructure.
- Economic Growth: Strong economic growth in certain regions driving energy demand.
- Geographical Advantages: Countries with abundant water resources exhibit higher growth potential.
- Technological Advancements: Increased efficiency and reduced maintenance costs make hydropower more competitive.
Dominance Factors: Existing hydropower infrastructure, government incentives, and favorable geographical conditions.
Europe Hydro Turbines Industry Product Landscape
The market offers a range of hydro turbines categorized by technology (reaction and impulse) and capacity (small, medium, and large). Recent innovations include improved blade designs for enhanced efficiency, advanced control systems for optimized energy generation, and integration of digital technologies for predictive maintenance and performance monitoring. These technological advancements enhance the reliability, efficiency, and sustainability of hydropower operations, contributing to the overall improvement of the energy generation process. Key selling propositions include higher efficiency rates, lower lifecycle costs, and reduced environmental impact.
Key Drivers, Barriers & Challenges in Europe Hydro Turbines Industry
Key Drivers:
- Increasing demand for renewable energy sources due to climate change concerns.
- Government policies and incentives promoting the adoption of hydropower.
- Technological advancements leading to higher efficiency and reduced operational costs.
Challenges and Restraints:
- High upfront capital costs associated with hydropower project development.
- Environmental concerns related to dam construction and ecological impact.
- Potential for water scarcity in certain regions affecting energy generation.
- Competition from other renewable energy technologies, including solar and wind power. This competition is estimated to reduce the market CAGR by approximately xx percentage points.
Emerging Opportunities in Europe Hydro Turbines Industry
- Small-scale hydropower: Expanding opportunities in smaller, decentralized hydropower systems.
- Hybrid energy solutions: Integrating hydropower with other renewable sources to create more robust and reliable energy systems.
- Modernization and upgrades: The rehabilitation of existing hydropower plants offers significant growth potential.
- Smart grid integration: Enhanced grid integration improves system efficiency and reliability.
Growth Accelerators in the Europe Hydro Turbines Industry
Technological breakthroughs in turbine design, leading to increased efficiency and reduced operating costs, are significant growth accelerators. Strategic partnerships and collaborations among turbine manufacturers, energy companies, and research institutions foster innovation and drive market expansion. Moreover, the ongoing expansion of renewable energy portfolios, and the ongoing drive towards energy independence across European nations, create a significant long-term market opportunity.
Key Players Shaping the Europe Hydro Turbines Industry Market
- Norcan Hydraulic Turbine Inc
- Litostroj Power Group
- Voith GmbH & Co KGaA
- Siemens AG
- Canadian Hydro Components Ltd
- Toshiba Energy
- Kirloskar Brothers Ltd
- General Electric Company
- Andritz AG
Notable Milestones in Europe Hydro Turbines Industry Sector
- July 2022: ANDRITZ secures a significant order to rehabilitate four Kaplan turbines at the Ryburg-Schwörstadt hydropower station in Switzerland, showcasing the continued demand for refurbishment and upgrade services in the existing hydropower infrastructure.
- June 2022: Voith Hydro and Augwind announce a strategic collaboration, highlighting the growing importance of integration with energy storage solutions within the hydropower sector. This partnership is expected to stimulate innovation in hybrid energy systems and drive future market growth.
In-Depth Europe Hydro Turbines Industry Market Outlook
The European hydro turbine market is poised for sustained growth driven by continued investment in renewable energy, technological advancements leading to improved efficiency, and government support for hydropower projects. Strategic opportunities exist in modernization projects, small-scale hydropower development, and the integration of hydropower with other renewable energy technologies and energy storage solutions. The market is expected to witness substantial expansion, particularly in regions with strong renewable energy targets and abundant water resources, creating substantial opportunities for manufacturers, developers, and investors.
Europe Hydro Turbines Industry Segmentation
-
1. Technology
- 1.1. Reaction
- 1.2. Impulse
-
2. Capacity
- 2.1. Small (Less than 10MW)
- 2.2. Medium (10MW - 100MW)
- 2.3. Large (Greater than 100MW)
Europe Hydro Turbines Industry Segmentation By Geography
- 1. Germay
- 2. United Kingdom
- 3. Norway
- 4. Italy
- 5. Rest of Europe
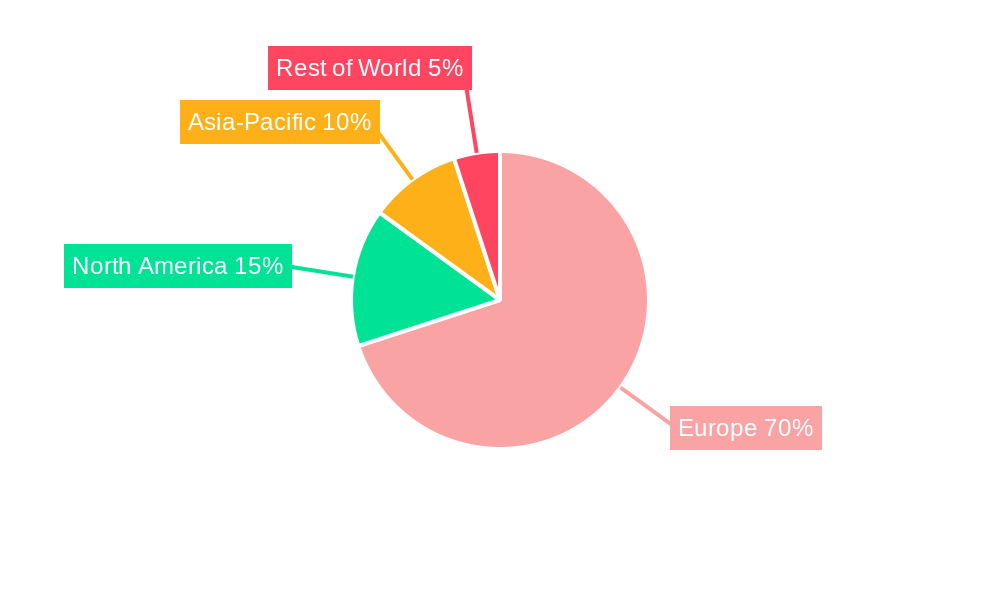
Europe Hydro Turbines Industry Regional Market Share
Geographic Coverage of Europe Hydro Turbines Industry
Europe Hydro Turbines Industry REPORT HIGHLIGHTS
| Aspects | Details |
|---|---|
| Study Period | 2020-2034 |
| Base Year | 2025 |
| Estimated Year | 2026 |
| Forecast Period | 2026-2034 |
| Historical Period | 2020-2025 |
| Growth Rate | CAGR of 3.4% from 2020-2034 |
| Segmentation |
|
Table of Contents
- 1. Introduction
- 1.1. Research Scope
- 1.2. Market Segmentation
- 1.3. Research Objective
- 1.4. Definitions and Assumptions
- 2. Executive Summary
- 2.1. Market Snapshot
- 3. Market Dynamics
- 3.1. Market Drivers
- 3.2. Market Restrains
- 3.3. Market Trends
- 3.4. Market Opportunities
- 4. Market Factor Analysis
- 4.1. Porters Five Forces
- 4.1.1. Bargaining Power of Suppliers
- 4.1.2. Bargaining Power of Buyers
- 4.1.3. Threat of New Entrants
- 4.1.4. Threat of Substitutes
- 4.1.5. Competitive Rivalry
- 4.2. PESTEL analysis
- 4.3. BCG Analysis
- 4.3.1. Stars (High Growth, High Market Share)
- 4.3.2. Cash Cows (Low Growth, High Market Share)
- 4.3.3. Question Mark (High Growth, Low Market Share)
- 4.3.4. Dogs (Low Growth, Low Market Share)
- 4.4. Ansoff Matrix Analysis
- 4.5. Supply Chain Analysis
- 4.6. Regulatory Landscape
- 4.7. Current Market Potential and Opportunity Assessment (TAM–SAM–SOM Framework)
- 4.8. NRP Analyst Note
- 4.1. Porters Five Forces
- 5. Market Analysis, Insights and Forecast 2021-2033
- 5.1. Market Analysis, Insights and Forecast - by Technology
- 5.1.1. Reaction
- 5.1.2. Impulse
- 5.2. Market Analysis, Insights and Forecast - by Capacity
- 5.2.1. Small (Less than 10MW)
- 5.2.2. Medium (10MW - 100MW)
- 5.2.3. Large (Greater than 100MW)
- 5.3. Market Analysis, Insights and Forecast - by Region
- 5.3.1. Germay
- 5.3.2. United Kingdom
- 5.3.3. Norway
- 5.3.4. Italy
- 5.3.5. Rest of Europe
- 5.1. Market Analysis, Insights and Forecast - by Technology
- 6. Europe Hydro Turbines Industry Analysis, Insights and Forecast, 2021-2033
- 6.1. Market Analysis, Insights and Forecast - by Technology
- 6.1.1. Reaction
- 6.1.2. Impulse
- 6.2. Market Analysis, Insights and Forecast - by Capacity
- 6.2.1. Small (Less than 10MW)
- 6.2.2. Medium (10MW - 100MW)
- 6.2.3. Large (Greater than 100MW)
- 6.1. Market Analysis, Insights and Forecast - by Technology
- 7. Germay Europe Hydro Turbines Industry Analysis, Insights and Forecast, 2020-2032
- 7.1. Market Analysis, Insights and Forecast - by Technology
- 7.1.1. Reaction
- 7.1.2. Impulse
- 7.2. Market Analysis, Insights and Forecast - by Capacity
- 7.2.1. Small (Less than 10MW)
- 7.2.2. Medium (10MW - 100MW)
- 7.2.3. Large (Greater than 100MW)
- 7.1. Market Analysis, Insights and Forecast - by Technology
- 8. United Kingdom Europe Hydro Turbines Industry Analysis, Insights and Forecast, 2020-2032
- 8.1. Market Analysis, Insights and Forecast - by Technology
- 8.1.1. Reaction
- 8.1.2. Impulse
- 8.2. Market Analysis, Insights and Forecast - by Capacity
- 8.2.1. Small (Less than 10MW)
- 8.2.2. Medium (10MW - 100MW)
- 8.2.3. Large (Greater than 100MW)
- 8.1. Market Analysis, Insights and Forecast - by Technology
- 9. Norway Europe Hydro Turbines Industry Analysis, Insights and Forecast, 2020-2032
- 9.1. Market Analysis, Insights and Forecast - by Technology
- 9.1.1. Reaction
- 9.1.2. Impulse
- 9.2. Market Analysis, Insights and Forecast - by Capacity
- 9.2.1. Small (Less than 10MW)
- 9.2.2. Medium (10MW - 100MW)
- 9.2.3. Large (Greater than 100MW)
- 9.1. Market Analysis, Insights and Forecast - by Technology
- 10. Italy Europe Hydro Turbines Industry Analysis, Insights and Forecast, 2020-2032
- 10.1. Market Analysis, Insights and Forecast - by Technology
- 10.1.1. Reaction
- 10.1.2. Impulse
- 10.2. Market Analysis, Insights and Forecast - by Capacity
- 10.2.1. Small (Less than 10MW)
- 10.2.2. Medium (10MW - 100MW)
- 10.2.3. Large (Greater than 100MW)
- 10.1. Market Analysis, Insights and Forecast - by Technology
- 11. Rest of Europe Europe Hydro Turbines Industry Analysis, Insights and Forecast, 2020-2032
- 11.1. Market Analysis, Insights and Forecast - by Technology
- 11.1.1. Reaction
- 11.1.2. Impulse
- 11.2. Market Analysis, Insights and Forecast - by Capacity
- 11.2.1. Small (Less than 10MW)
- 11.2.2. Medium (10MW - 100MW)
- 11.2.3. Large (Greater than 100MW)
- 11.1. Market Analysis, Insights and Forecast - by Technology
- 12. Competitive Analysis
- 12.1. Company Profiles
- 12.1.1 Norcan Hydraulic Turbine Inc
- 12.1.1.1. Company Overview
- 12.1.1.2. Products
- 12.1.1.3. Company Financials
- 12.1.1.4. SWOT Analysis
- 12.1.2 Litostroj Power Group
- 12.1.2.1. Company Overview
- 12.1.2.2. Products
- 12.1.2.3. Company Financials
- 12.1.2.4. SWOT Analysis
- 12.1.3 Voith GmbH & Co KGaA
- 12.1.3.1. Company Overview
- 12.1.3.2. Products
- 12.1.3.3. Company Financials
- 12.1.3.4. SWOT Analysis
- 12.1.4 Siemens AG
- 12.1.4.1. Company Overview
- 12.1.4.2. Products
- 12.1.4.3. Company Financials
- 12.1.4.4. SWOT Analysis
- 12.1.5 Canadian Hydro Components Ltd
- 12.1.5.1. Company Overview
- 12.1.5.2. Products
- 12.1.5.3. Company Financials
- 12.1.5.4. SWOT Analysis
- 12.1.6 Toshiba Energy*List Not Exhaustive
- 12.1.6.1. Company Overview
- 12.1.6.2. Products
- 12.1.6.3. Company Financials
- 12.1.6.4. SWOT Analysis
- 12.1.7 Kirloskar Brothers Ltd
- 12.1.7.1. Company Overview
- 12.1.7.2. Products
- 12.1.7.3. Company Financials
- 12.1.7.4. SWOT Analysis
- 12.1.8 General Electric Company
- 12.1.8.1. Company Overview
- 12.1.8.2. Products
- 12.1.8.3. Company Financials
- 12.1.8.4. SWOT Analysis
- 12.1.9 Andritz AG
- 12.1.9.1. Company Overview
- 12.1.9.2. Products
- 12.1.9.3. Company Financials
- 12.1.9.4. SWOT Analysis
- 12.1.1 Norcan Hydraulic Turbine Inc
- 12.2. Market Entropy
- 12.2.1 Company's Key Areas Served
- 12.2.2 Recent Developments
- 12.3. Company Market Share Analysis 2025
- 12.3.1 Top 5 Companies Market Share Analysis
- 12.3.2 Top 3 Companies Market Share Analysis
- 12.4. List of Potential Customers
- 13. Research Methodology
List of Figures
- Figure 1: Europe Hydro Turbines Industry Revenue Breakdown (billion, %) by Product 2025 & 2033
- Figure 2: Europe Hydro Turbines Industry Share (%) by Company 2025
List of Tables
- Table 1: Europe Hydro Turbines Industry Revenue billion Forecast, by Technology 2020 & 2033
- Table 2: Europe Hydro Turbines Industry Volume K Unit Forecast, by Technology 2020 & 2033
- Table 3: Europe Hydro Turbines Industry Revenue billion Forecast, by Capacity 2020 & 2033
- Table 4: Europe Hydro Turbines Industry Volume K Unit Forecast, by Capacity 2020 & 2033
- Table 5: Europe Hydro Turbines Industry Revenue billion Forecast, by Region 2020 & 2033
- Table 6: Europe Hydro Turbines Industry Volume K Unit Forecast, by Region 2020 & 2033
- Table 7: Europe Hydro Turbines Industry Revenue billion Forecast, by Technology 2020 & 2033
- Table 8: Europe Hydro Turbines Industry Volume K Unit Forecast, by Technology 2020 & 2033
- Table 9: Europe Hydro Turbines Industry Revenue billion Forecast, by Capacity 2020 & 2033
- Table 10: Europe Hydro Turbines Industry Volume K Unit Forecast, by Capacity 2020 & 2033
- Table 11: Europe Hydro Turbines Industry Revenue billion Forecast, by Country 2020 & 2033
- Table 12: Europe Hydro Turbines Industry Volume K Unit Forecast, by Country 2020 & 2033
- Table 13: Europe Hydro Turbines Industry Revenue billion Forecast, by Technology 2020 & 2033
- Table 14: Europe Hydro Turbines Industry Volume K Unit Forecast, by Technology 2020 & 2033
- Table 15: Europe Hydro Turbines Industry Revenue billion Forecast, by Capacity 2020 & 2033
- Table 16: Europe Hydro Turbines Industry Volume K Unit Forecast, by Capacity 2020 & 2033
- Table 17: Europe Hydro Turbines Industry Revenue billion Forecast, by Country 2020 & 2033
- Table 18: Europe Hydro Turbines Industry Volume K Unit Forecast, by Country 2020 & 2033
- Table 19: Europe Hydro Turbines Industry Revenue billion Forecast, by Technology 2020 & 2033
- Table 20: Europe Hydro Turbines Industry Volume K Unit Forecast, by Technology 2020 & 2033
- Table 21: Europe Hydro Turbines Industry Revenue billion Forecast, by Capacity 2020 & 2033
- Table 22: Europe Hydro Turbines Industry Volume K Unit Forecast, by Capacity 2020 & 2033
- Table 23: Europe Hydro Turbines Industry Revenue billion Forecast, by Country 2020 & 2033
- Table 24: Europe Hydro Turbines Industry Volume K Unit Forecast, by Country 2020 & 2033
- Table 25: Europe Hydro Turbines Industry Revenue billion Forecast, by Technology 2020 & 2033
- Table 26: Europe Hydro Turbines Industry Volume K Unit Forecast, by Technology 2020 & 2033
- Table 27: Europe Hydro Turbines Industry Revenue billion Forecast, by Capacity 2020 & 2033
- Table 28: Europe Hydro Turbines Industry Volume K Unit Forecast, by Capacity 2020 & 2033
- Table 29: Europe Hydro Turbines Industry Revenue billion Forecast, by Country 2020 & 2033
- Table 30: Europe Hydro Turbines Industry Volume K Unit Forecast, by Country 2020 & 2033
- Table 31: Europe Hydro Turbines Industry Revenue billion Forecast, by Technology 2020 & 2033
- Table 32: Europe Hydro Turbines Industry Volume K Unit Forecast, by Technology 2020 & 2033
- Table 33: Europe Hydro Turbines Industry Revenue billion Forecast, by Capacity 2020 & 2033
- Table 34: Europe Hydro Turbines Industry Volume K Unit Forecast, by Capacity 2020 & 2033
- Table 35: Europe Hydro Turbines Industry Revenue billion Forecast, by Country 2020 & 2033
- Table 36: Europe Hydro Turbines Industry Volume K Unit Forecast, by Country 2020 & 2033
Frequently Asked Questions
1. What is the projected Compound Annual Growth Rate (CAGR) of the Europe Hydro Turbines Industry?
The projected CAGR is approximately 3.4%.
2. Which companies are prominent players in the Europe Hydro Turbines Industry?
Key companies in the market include Norcan Hydraulic Turbine Inc, Litostroj Power Group, Voith GmbH & Co KGaA, Siemens AG, Canadian Hydro Components Ltd, Toshiba Energy*List Not Exhaustive, Kirloskar Brothers Ltd, General Electric Company, Andritz AG.
3. What are the main segments of the Europe Hydro Turbines Industry?
The market segments include Technology, Capacity.
4. Can you provide details about the market size?
The market size is estimated to be USD 58.5 billion as of 2022.
5. What are some drivers contributing to market growth?
4.; Replacement of Existing Grids and the Expansion of Distribution Networks.
6. What are the notable trends driving market growth?
Large (Greater than 100MW) segment to Dominate the Market.
7. Are there any restraints impacting market growth?
4.; High Installation Costs.
8. Can you provide examples of recent developments in the market?
July 2022: ANDRITZ, an international technology group, received an order from Kraftwerk Ryburg-Schwörstadt AG to rehabilitate all four Kaplan turbines at the Ryburg-Schwörstadt hydropower station on the Rhine in Switzerland. Its installed capacity is 120 megawatts, making it the most powerful hydroelectric plant on the High Rhine. ANDRITZ is one of the original suppliers, having installed two units when the plant was completed in 1930.
9. What pricing options are available for accessing the report?
Pricing options include single-user, multi-user, and enterprise licenses priced at USD 4750, USD 5250, and USD 8750 respectively.
10. Is the market size provided in terms of value or volume?
The market size is provided in terms of value, measured in billion and volume, measured in K Unit.
11. Are there any specific market keywords associated with the report?
Yes, the market keyword associated with the report is "Europe Hydro Turbines Industry," which aids in identifying and referencing the specific market segment covered.
12. How do I determine which pricing option suits my needs best?
The pricing options vary based on user requirements and access needs. Individual users may opt for single-user licenses, while businesses requiring broader access may choose multi-user or enterprise licenses for cost-effective access to the report.
13. Are there any additional resources or data provided in the Europe Hydro Turbines Industry report?
While the report offers comprehensive insights, it's advisable to review the specific contents or supplementary materials provided to ascertain if additional resources or data are available.
14. How can I stay updated on further developments or reports in the Europe Hydro Turbines Industry?
To stay informed about further developments, trends, and reports in the Europe Hydro Turbines Industry, consider subscribing to industry newsletters, following relevant companies and organizations, or regularly checking reputable industry news sources and publications.
Methodology
Step 1 - Identification of Relevant Samples Size from Population Database


Step 2 - Approaches for Defining Global Market Size (Value, Volume* & Price*)

Note*: In applicable scenarios
Step 3 - Data Sources
Primary Research
- Web Analytics
- Survey Reports
- Research Institute
- Latest Research Reports
- Opinion Leaders
Secondary Research
- Annual Reports
- White Paper
- Latest Press Release
- Industry Association
- Paid Database
- Investor Presentations

Step 4 - Data Triangulation
Involves using different sources of information in order to increase the validity of a study
These sources are likely to be stakeholders in a program - participants, other researchers, program staff, other community members, and so on.
Then we put all data in single framework & apply various statistical tools to find out the dynamic on the market.
During the analysis stage, feedback from the stakeholder groups would be compared to determine areas of agreement as well as areas of divergence