

Key Insights
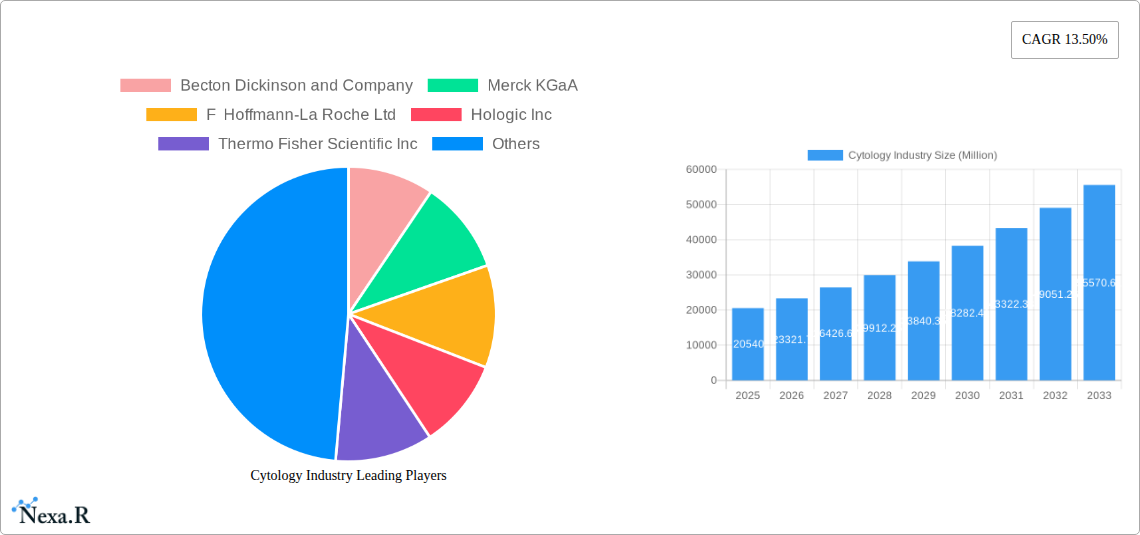
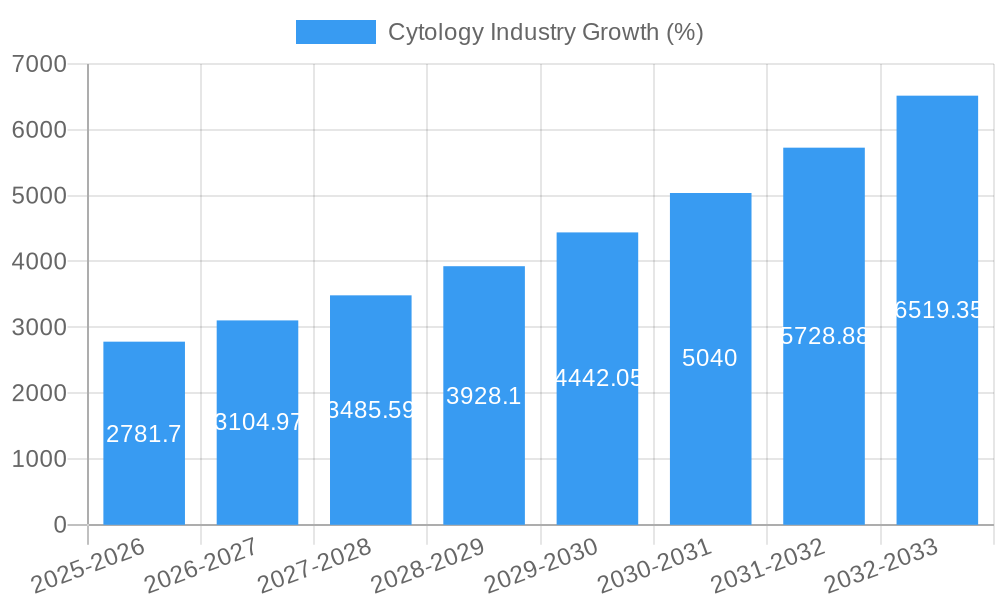
The global cytology market, valued at $20.54 billion in 2025, is projected to experience robust growth, driven by a compound annual growth rate (CAGR) of 13.50% from 2025 to 2033. This expansion is fueled by several key factors. The increasing prevalence of cervical cancer and other gynecological cancers necessitates frequent screening, significantly boosting demand for cytology services. Advancements in cytology techniques, such as liquid-based cytology (LBC) and automated systems, enhance diagnostic accuracy and efficiency, further driving market growth. The rising geriatric population, susceptible to age-related diseases requiring cytological examination, also contributes to market expansion. Furthermore, the growing adoption of molecular diagnostics integrated with cytology improves diagnostic capabilities and treatment strategies, creating new avenues for market growth. Technological advancements in microscopy, particularly automated digital microscopy, are streamlining workflows and reducing turnaround times, making cytology more accessible and efficient.
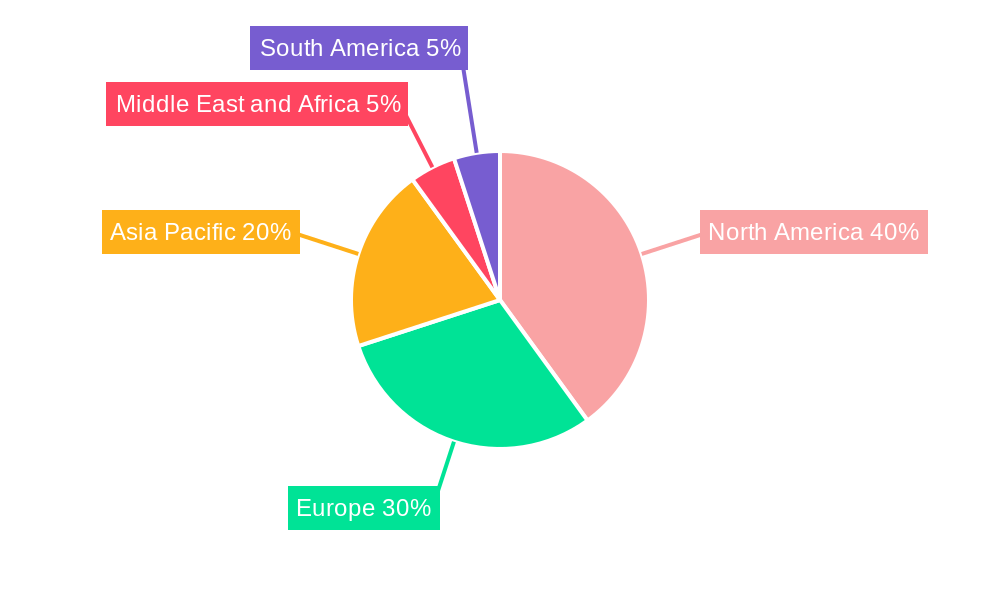
Significant regional variations exist within the cytology market. North America and Europe currently hold substantial market shares due to well-established healthcare infrastructure and high adoption rates of advanced cytology technologies. However, the Asia-Pacific region is expected to witness the fastest growth, driven by increasing healthcare expenditure, rising awareness of cancer screening, and expanding diagnostic facilities. The market segmentation reveals significant opportunities within various examination types (histology, cytology), test types (microscopy, cytogenetic), and end-users (hospitals, research institutes). Major players like Becton Dickinson, Merck KGaA, and Thermo Fisher Scientific are actively investing in research and development, contributing to market innovation and competition. The market's future growth trajectory will be influenced by factors such as government initiatives promoting cancer screening programs, technological innovations, and the ongoing development of point-of-care diagnostics in cytology.
Cytology Industry Market Report: 2019-2033
This comprehensive report provides an in-depth analysis of the Cytology Industry, encompassing market dynamics, growth trends, competitive landscape, and future outlook. Covering the period 2019-2033, with a base year of 2025 and a forecast period of 2025-2033, this report is an invaluable resource for industry professionals, investors, and researchers seeking to understand and capitalize on opportunities within this dynamic sector. The report segments the market by Type of Examination (Histology, Cytology), Test Type (Microscopy Tests, Cytogenic Tests, Other Microscopy Tests), End User (Hospitals and Clinics, Academic and Research Institutes, Other End Users), and key players including Becton Dickinson and Company, Merck KGaA, F Hoffmann-La Roche Ltd, Hologic Inc, Thermo Fisher Scientific Inc, Trivitron Healthcare, Danaher Corporation, Abbott, PerkinElmer Inc, and Sysmex Corporation.
Cytology Industry Market Dynamics & Structure
The Cytology industry is characterized by a moderately concentrated market structure, with several multinational corporations holding significant market share. Technological innovation, particularly in automation and molecular diagnostics, is a key driver, alongside increasing demand for early cancer detection and personalized medicine. Stringent regulatory frameworks, particularly concerning diagnostic accuracy and safety, influence market dynamics. Competitive pressures arise from the availability of substitute diagnostic techniques. The end-user demographic is primarily driven by the growth of hospitals and clinics, complemented by the expanding academic and research sector. M&A activity within the industry remains significant, with larger players strategically acquiring smaller companies to expand their product portfolios and geographical reach. The total market size in 2025 is estimated at xx Million units, with a projected CAGR of xx% during the forecast period.
- Market Concentration: The top 5 players account for approximately xx% of the market share in 2025.
- Technological Innovation: Advancements in microscopy, molecular genetics, and flow cytometry are driving market growth.
- Regulatory Landscape: FDA approvals and international regulatory compliance are crucial for market entry and product success.
- Competitive Substitutes: Other diagnostic imaging techniques and blood tests present some level of substitution.
- M&A Activity: An estimated xx M&A deals occurred between 2019 and 2024, signifying consolidation within the industry.
- End-User Demographics: Hospitals and clinics constitute the largest end-user segment, accounting for xx% of the market in 2025.
Cytology Industry Growth Trends & Insights
The Cytology industry has witnessed substantial growth over the past five years, driven by increasing prevalence of chronic diseases, rising healthcare expenditure, and technological advancements. Adoption rates of advanced cytology techniques, such as molecular diagnostics, are steadily increasing. Technological disruptions, including the integration of AI and big data analytics, are transforming diagnostic workflows and improving accuracy. Consumer behavior shifts towards preventive healthcare and personalized medicine are also fueling market growth. The market size is projected to reach xx Million units by 2033, exhibiting a robust CAGR of xx% during the forecast period (2025-2033). Market penetration of advanced cytology techniques, particularly molecular tests, is expected to rise from xx% in 2025 to xx% by 2033. This growth is further fueled by increasing awareness of early detection benefits and government initiatives supporting cancer screening programs.
Dominant Regions, Countries, or Segments in Cytology Industry
North America currently holds the largest market share in the cytology industry, driven by high healthcare expenditure, advanced infrastructure, and early adoption of new technologies. Within North America, the United States demonstrates the highest growth potential. Europe follows as a significant market, with Western European countries exhibiting strong growth due to robust healthcare systems and increasing prevalence of chronic diseases. Asia-Pacific is experiencing rapid expansion due to rising healthcare expenditure, increasing disease prevalence, and growing awareness of advanced diagnostic techniques. Among segments, Cytology testing holds a dominant position, followed by Microscopy Tests and Cytogenic Tests (Karyotyping and FISH). Hospitals and clinics form the largest end-user segment, due to their volume of patient throughput.
- Key Drivers: Strong healthcare infrastructure, high healthcare expenditure, government support for cancer screening programs, and rising disease prevalence.
- Dominance Factors: North America's dominance is attributed to high adoption rates of new technologies and robust healthcare systems.
- Growth Potential: Asia-Pacific shows significant growth potential due to increasing healthcare spending and rising disease rates.
Cytology Industry Product Landscape
The Cytology industry features a diverse range of products, including automated slide stainers, digital imaging systems, and molecular diagnostic kits. Product innovations focus on enhancing accuracy, speed, and efficiency of diagnostic testing. Advanced features, such as AI-powered image analysis and automated workflow management, are driving the adoption of newer systems. The emphasis is on developing user-friendly interfaces and providing comprehensive reporting capabilities. The unique selling propositions revolve around improved diagnostic accuracy, reduced turnaround times, and streamlined workflows.
Key Drivers, Barriers & Challenges in Cytology Industry
Key Drivers: Technological advancements, increasing prevalence of chronic diseases, government initiatives promoting early cancer detection, and rising healthcare expenditure are major drivers of market growth. For example, the introduction of new molecular tests improves diagnostic accuracy.
Challenges: Stringent regulatory approvals, high costs associated with advanced technologies, skilled labor shortages, and potential reimbursement challenges hinder market growth. Supply chain disruptions can impact the availability of reagents and consumables, leading to delays in testing.
Emerging Opportunities in Cytology Industry
Emerging opportunities lie in the development and adoption of point-of-care diagnostics, personalized medicine approaches, and the integration of AI and big data analytics for improved diagnostic accuracy and efficiency. Untapped markets in developing countries present significant growth potential.
Growth Accelerators in the Cytology Industry
Technological breakthroughs in areas such as liquid biopsy and advanced imaging techniques, coupled with strategic partnerships between diagnostic companies and healthcare providers, are key growth accelerators. Expanding into underserved markets and developing innovative diagnostic solutions for early disease detection will propel market expansion.
Key Players Shaping the Cytology Industry Market
- Becton Dickinson and Company
- Merck KGaA
- F Hoffmann-La Roche Ltd
- Hologic Inc
- Thermo Fisher Scientific Inc
- Trivitron Healthcare
- Danaher Corporation
- Abbott
- PerkinElmer Inc
- Sysmex Corporation
Notable Milestones in Cytology Industry Sector
- February 2023: BioReference Health LLC announced the offering of the CINtec PLUS Cytology test from Roche Diagnostics, an FDA-approved dual-stain triage test for high-risk HPV.
- July 2022: Nanostics Inc. launched a clinical study to validate its Clarity DX Bladder test for bladder cancer.
In-Depth Cytology Industry Market Outlook
The Cytology industry is poised for continued growth, driven by technological advancements, increasing disease prevalence, and expanding healthcare infrastructure. Strategic partnerships, market expansion into emerging economies, and the development of innovative diagnostic solutions will shape the future of the industry. The focus on early disease detection and personalized medicine will create significant opportunities for market players.
Cytology Industry Segmentation
-
1. Type of Examination
- 1.1. Histology
-
1.2. Cytology
- 1.2.1. Breast Cancer
- 1.2.2. Cervical Cancer
- 1.2.3. Others
-
2. Test Type
-
2.1. Microscopy Tests
-
2.1.1. Cytogenic Tests
- 2.1.1.1. Karyotyping
- 2.1.1.2. Fluorescent In-situ Hybridization (FISH)
- 2.1.2. Polymerase Chain Reaction
- 2.1.3. Other Microscopy Tests
-
2.1.1. Cytogenic Tests
- 2.2. Molecular Genetics Tests
- 2.3. Flow Cytomtery
-
2.1. Microscopy Tests
-
3. End User
- 3.1. Hospitals and Clinics
- 3.2. Academic and Research Institutes
- 3.3. Other End Users
Cytology Industry Segmentation By Geography
-
1. North America
- 1.1. United States
- 1.2. Canada
- 1.3. Mexico
-
2. Europe
- 2.1. Germany
- 2.2. United Kingdom
- 2.3. France
- 2.4. Italy
- 2.5. Spain
- 2.6. Rest of Europe
-
3. Asia Pacific
- 3.1. China
- 3.2. Japan
- 3.3. India
- 3.4. Australia
- 3.5. South korea
- 3.6. Rest of Asia Pacific
-
4. Middle East and Africa
- 4.1. GCC
- 4.2. South Africa
- 4.3. Rest of Middle East and Africa
-
5. South America
- 5.1. Brazil
- 5.2. Argentina
- 5.3. Rest of South America
Cytology Industry REPORT HIGHLIGHTS
| Aspects | Details |
|---|---|
| Study Period | 2019-2033 |
| Base Year | 2024 |
| Estimated Year | 2025 |
| Forecast Period | 2025-2033 |
| Historical Period | 2019-2024 |
| Growth Rate | CAGR of 13.50% from 2019-2033 |
| Segmentation |
|
Table of Contents
- 1. Introduction
- 1.1. Research Scope
- 1.2. Market Segmentation
- 1.3. Research Methodology
- 1.4. Definitions and Assumptions
- 2. Executive Summary
- 2.1. Introduction
- 3. Market Dynamics
- 3.1. Introduction
- 3.2. Market Drivers
- 3.2.1. Rising Prevalence of Cancer; Increasing Standardization of Pathological Laboratories; Technological Advancements in Diagnostic and Molecular Techniques
- 3.3. Market Restrains
- 3.3.1. Safety Issues and Diagnostic Accuracy Issues with Histopathological and Cytopathological Tests; Lack of Awareness among the Public for Diagnostic Tests
- 3.4. Market Trends
- 3.4.1. Cervical Cancer Segment is Expected to Have a Significant Market Share During the Forecast Period
- 4. Market Factor Analysis
- 4.1. Porters Five Forces
- 4.2. Supply/Value Chain
- 4.3. PESTEL analysis
- 4.4. Market Entropy
- 4.5. Patent/Trademark Analysis
- 5. Global Cytology Industry Analysis, Insights and Forecast, 2019-2031
- 5.1. Market Analysis, Insights and Forecast - by Type of Examination
- 5.1.1. Histology
- 5.1.2. Cytology
- 5.1.2.1. Breast Cancer
- 5.1.2.2. Cervical Cancer
- 5.1.2.3. Others
- 5.2. Market Analysis, Insights and Forecast - by Test Type
- 5.2.1. Microscopy Tests
- 5.2.1.1. Cytogenic Tests
- 5.2.1.1.1. Karyotyping
- 5.2.1.1.2. Fluorescent In-situ Hybridization (FISH)
- 5.2.1.2. Polymerase Chain Reaction
- 5.2.1.3. Other Microscopy Tests
- 5.2.1.1. Cytogenic Tests
- 5.2.2. Molecular Genetics Tests
- 5.2.3. Flow Cytomtery
- 5.2.1. Microscopy Tests
- 5.3. Market Analysis, Insights and Forecast - by End User
- 5.3.1. Hospitals and Clinics
- 5.3.2. Academic and Research Institutes
- 5.3.3. Other End Users
- 5.4. Market Analysis, Insights and Forecast - by Region
- 5.4.1. North America
- 5.4.2. Europe
- 5.4.3. Asia Pacific
- 5.4.4. Middle East and Africa
- 5.4.5. South America
- 5.1. Market Analysis, Insights and Forecast - by Type of Examination
- 6. North America Cytology Industry Analysis, Insights and Forecast, 2019-2031
- 6.1. Market Analysis, Insights and Forecast - by Type of Examination
- 6.1.1. Histology
- 6.1.2. Cytology
- 6.1.2.1. Breast Cancer
- 6.1.2.2. Cervical Cancer
- 6.1.2.3. Others
- 6.2. Market Analysis, Insights and Forecast - by Test Type
- 6.2.1. Microscopy Tests
- 6.2.1.1. Cytogenic Tests
- 6.2.1.1.1. Karyotyping
- 6.2.1.1.2. Fluorescent In-situ Hybridization (FISH)
- 6.2.1.2. Polymerase Chain Reaction
- 6.2.1.3. Other Microscopy Tests
- 6.2.1.1. Cytogenic Tests
- 6.2.2. Molecular Genetics Tests
- 6.2.3. Flow Cytomtery
- 6.2.1. Microscopy Tests
- 6.3. Market Analysis, Insights and Forecast - by End User
- 6.3.1. Hospitals and Clinics
- 6.3.2. Academic and Research Institutes
- 6.3.3. Other End Users
- 6.1. Market Analysis, Insights and Forecast - by Type of Examination
- 7. Europe Cytology Industry Analysis, Insights and Forecast, 2019-2031
- 7.1. Market Analysis, Insights and Forecast - by Type of Examination
- 7.1.1. Histology
- 7.1.2. Cytology
- 7.1.2.1. Breast Cancer
- 7.1.2.2. Cervical Cancer
- 7.1.2.3. Others
- 7.2. Market Analysis, Insights and Forecast - by Test Type
- 7.2.1. Microscopy Tests
- 7.2.1.1. Cytogenic Tests
- 7.2.1.1.1. Karyotyping
- 7.2.1.1.2. Fluorescent In-situ Hybridization (FISH)
- 7.2.1.2. Polymerase Chain Reaction
- 7.2.1.3. Other Microscopy Tests
- 7.2.1.1. Cytogenic Tests
- 7.2.2. Molecular Genetics Tests
- 7.2.3. Flow Cytomtery
- 7.2.1. Microscopy Tests
- 7.3. Market Analysis, Insights and Forecast - by End User
- 7.3.1. Hospitals and Clinics
- 7.3.2. Academic and Research Institutes
- 7.3.3. Other End Users
- 7.1. Market Analysis, Insights and Forecast - by Type of Examination
- 8. Asia Pacific Cytology Industry Analysis, Insights and Forecast, 2019-2031
- 8.1. Market Analysis, Insights and Forecast - by Type of Examination
- 8.1.1. Histology
- 8.1.2. Cytology
- 8.1.2.1. Breast Cancer
- 8.1.2.2. Cervical Cancer
- 8.1.2.3. Others
- 8.2. Market Analysis, Insights and Forecast - by Test Type
- 8.2.1. Microscopy Tests
- 8.2.1.1. Cytogenic Tests
- 8.2.1.1.1. Karyotyping
- 8.2.1.1.2. Fluorescent In-situ Hybridization (FISH)
- 8.2.1.2. Polymerase Chain Reaction
- 8.2.1.3. Other Microscopy Tests
- 8.2.1.1. Cytogenic Tests
- 8.2.2. Molecular Genetics Tests
- 8.2.3. Flow Cytomtery
- 8.2.1. Microscopy Tests
- 8.3. Market Analysis, Insights and Forecast - by End User
- 8.3.1. Hospitals and Clinics
- 8.3.2. Academic and Research Institutes
- 8.3.3. Other End Users
- 8.1. Market Analysis, Insights and Forecast - by Type of Examination
- 9. Middle East and Africa Cytology Industry Analysis, Insights and Forecast, 2019-2031
- 9.1. Market Analysis, Insights and Forecast - by Type of Examination
- 9.1.1. Histology
- 9.1.2. Cytology
- 9.1.2.1. Breast Cancer
- 9.1.2.2. Cervical Cancer
- 9.1.2.3. Others
- 9.2. Market Analysis, Insights and Forecast - by Test Type
- 9.2.1. Microscopy Tests
- 9.2.1.1. Cytogenic Tests
- 9.2.1.1.1. Karyotyping
- 9.2.1.1.2. Fluorescent In-situ Hybridization (FISH)
- 9.2.1.2. Polymerase Chain Reaction
- 9.2.1.3. Other Microscopy Tests
- 9.2.1.1. Cytogenic Tests
- 9.2.2. Molecular Genetics Tests
- 9.2.3. Flow Cytomtery
- 9.2.1. Microscopy Tests
- 9.3. Market Analysis, Insights and Forecast - by End User
- 9.3.1. Hospitals and Clinics
- 9.3.2. Academic and Research Institutes
- 9.3.3. Other End Users
- 9.1. Market Analysis, Insights and Forecast - by Type of Examination
- 10. South America Cytology Industry Analysis, Insights and Forecast, 2019-2031
- 10.1. Market Analysis, Insights and Forecast - by Type of Examination
- 10.1.1. Histology
- 10.1.2. Cytology
- 10.1.2.1. Breast Cancer
- 10.1.2.2. Cervical Cancer
- 10.1.2.3. Others
- 10.2. Market Analysis, Insights and Forecast - by Test Type
- 10.2.1. Microscopy Tests
- 10.2.1.1. Cytogenic Tests
- 10.2.1.1.1. Karyotyping
- 10.2.1.1.2. Fluorescent In-situ Hybridization (FISH)
- 10.2.1.2. Polymerase Chain Reaction
- 10.2.1.3. Other Microscopy Tests
- 10.2.1.1. Cytogenic Tests
- 10.2.2. Molecular Genetics Tests
- 10.2.3. Flow Cytomtery
- 10.2.1. Microscopy Tests
- 10.3. Market Analysis, Insights and Forecast - by End User
- 10.3.1. Hospitals and Clinics
- 10.3.2. Academic and Research Institutes
- 10.3.3. Other End Users
- 10.1. Market Analysis, Insights and Forecast - by Type of Examination
- 11. North America Cytology Industry Analysis, Insights and Forecast, 2019-2031
- 11.1. Market Analysis, Insights and Forecast - By Country/Sub-region
- 11.1.1 United States
- 11.1.2 Canada
- 11.1.3 Mexico
- 12. Europe Cytology Industry Analysis, Insights and Forecast, 2019-2031
- 12.1. Market Analysis, Insights and Forecast - By Country/Sub-region
- 12.1.1 Germany
- 12.1.2 United Kingdom
- 12.1.3 France
- 12.1.4 Italy
- 12.1.5 Spain
- 12.1.6 Rest of Europe
- 13. Asia Pacific Cytology Industry Analysis, Insights and Forecast, 2019-2031
- 13.1. Market Analysis, Insights and Forecast - By Country/Sub-region
- 13.1.1 China
- 13.1.2 Japan
- 13.1.3 India
- 13.1.4 Australia
- 13.1.5 South korea
- 13.1.6 Rest of Asia Pacific
- 14. Middle East and Africa Cytology Industry Analysis, Insights and Forecast, 2019-2031
- 14.1. Market Analysis, Insights and Forecast - By Country/Sub-region
- 14.1.1 GCC
- 14.1.2 South Africa
- 14.1.3 Rest of Middle East and Africa
- 15. South America Cytology Industry Analysis, Insights and Forecast, 2019-2031
- 15.1. Market Analysis, Insights and Forecast - By Country/Sub-region
- 15.1.1 Brazil
- 15.1.2 Argentina
- 15.1.3 Rest of South America
- 16. Competitive Analysis
- 16.1. Global Market Share Analysis 2024
- 16.2. Company Profiles
- 16.2.1 Becton Dickinson and Company
- 16.2.1.1. Overview
- 16.2.1.2. Products
- 16.2.1.3. SWOT Analysis
- 16.2.1.4. Recent Developments
- 16.2.1.5. Financials (Based on Availability)
- 16.2.2 Merck KGaA
- 16.2.2.1. Overview
- 16.2.2.2. Products
- 16.2.2.3. SWOT Analysis
- 16.2.2.4. Recent Developments
- 16.2.2.5. Financials (Based on Availability)
- 16.2.3 F Hoffmann-La Roche Ltd
- 16.2.3.1. Overview
- 16.2.3.2. Products
- 16.2.3.3. SWOT Analysis
- 16.2.3.4. Recent Developments
- 16.2.3.5. Financials (Based on Availability)
- 16.2.4 Hologic Inc
- 16.2.4.1. Overview
- 16.2.4.2. Products
- 16.2.4.3. SWOT Analysis
- 16.2.4.4. Recent Developments
- 16.2.4.5. Financials (Based on Availability)
- 16.2.5 Thermo Fisher Scientific Inc
- 16.2.5.1. Overview
- 16.2.5.2. Products
- 16.2.5.3. SWOT Analysis
- 16.2.5.4. Recent Developments
- 16.2.5.5. Financials (Based on Availability)
- 16.2.6 Trivitron Healthcare
- 16.2.6.1. Overview
- 16.2.6.2. Products
- 16.2.6.3. SWOT Analysis
- 16.2.6.4. Recent Developments
- 16.2.6.5. Financials (Based on Availability)
- 16.2.7 Danaher Corporation
- 16.2.7.1. Overview
- 16.2.7.2. Products
- 16.2.7.3. SWOT Analysis
- 16.2.7.4. Recent Developments
- 16.2.7.5. Financials (Based on Availability)
- 16.2.8 Abbott
- 16.2.8.1. Overview
- 16.2.8.2. Products
- 16.2.8.3. SWOT Analysis
- 16.2.8.4. Recent Developments
- 16.2.8.5. Financials (Based on Availability)
- 16.2.9 PerkinElmer Inc
- 16.2.9.1. Overview
- 16.2.9.2. Products
- 16.2.9.3. SWOT Analysis
- 16.2.9.4. Recent Developments
- 16.2.9.5. Financials (Based on Availability)
- 16.2.10 Sysmex Corporation
- 16.2.10.1. Overview
- 16.2.10.2. Products
- 16.2.10.3. SWOT Analysis
- 16.2.10.4. Recent Developments
- 16.2.10.5. Financials (Based on Availability)
- 16.2.1 Becton Dickinson and Company
List of Figures
- Figure 1: Global Cytology Industry Revenue Breakdown (Million, %) by Region 2024 & 2032
- Figure 2: Global Cytology Industry Volume Breakdown (K Unit, %) by Region 2024 & 2032
- Figure 3: North America Cytology Industry Revenue (Million), by Country 2024 & 2032
- Figure 4: North America Cytology Industry Volume (K Unit), by Country 2024 & 2032
- Figure 5: North America Cytology Industry Revenue Share (%), by Country 2024 & 2032
- Figure 6: North America Cytology Industry Volume Share (%), by Country 2024 & 2032
- Figure 7: Europe Cytology Industry Revenue (Million), by Country 2024 & 2032
- Figure 8: Europe Cytology Industry Volume (K Unit), by Country 2024 & 2032
- Figure 9: Europe Cytology Industry Revenue Share (%), by Country 2024 & 2032
- Figure 10: Europe Cytology Industry Volume Share (%), by Country 2024 & 2032
- Figure 11: Asia Pacific Cytology Industry Revenue (Million), by Country 2024 & 2032
- Figure 12: Asia Pacific Cytology Industry Volume (K Unit), by Country 2024 & 2032
- Figure 13: Asia Pacific Cytology Industry Revenue Share (%), by Country 2024 & 2032
- Figure 14: Asia Pacific Cytology Industry Volume Share (%), by Country 2024 & 2032
- Figure 15: Middle East and Africa Cytology Industry Revenue (Million), by Country 2024 & 2032
- Figure 16: Middle East and Africa Cytology Industry Volume (K Unit), by Country 2024 & 2032
- Figure 17: Middle East and Africa Cytology Industry Revenue Share (%), by Country 2024 & 2032
- Figure 18: Middle East and Africa Cytology Industry Volume Share (%), by Country 2024 & 2032
- Figure 19: South America Cytology Industry Revenue (Million), by Country 2024 & 2032
- Figure 20: South America Cytology Industry Volume (K Unit), by Country 2024 & 2032
- Figure 21: South America Cytology Industry Revenue Share (%), by Country 2024 & 2032
- Figure 22: South America Cytology Industry Volume Share (%), by Country 2024 & 2032
- Figure 23: North America Cytology Industry Revenue (Million), by Type of Examination 2024 & 2032
- Figure 24: North America Cytology Industry Volume (K Unit), by Type of Examination 2024 & 2032
- Figure 25: North America Cytology Industry Revenue Share (%), by Type of Examination 2024 & 2032
- Figure 26: North America Cytology Industry Volume Share (%), by Type of Examination 2024 & 2032
- Figure 27: North America Cytology Industry Revenue (Million), by Test Type 2024 & 2032
- Figure 28: North America Cytology Industry Volume (K Unit), by Test Type 2024 & 2032
- Figure 29: North America Cytology Industry Revenue Share (%), by Test Type 2024 & 2032
- Figure 30: North America Cytology Industry Volume Share (%), by Test Type 2024 & 2032
- Figure 31: North America Cytology Industry Revenue (Million), by End User 2024 & 2032
- Figure 32: North America Cytology Industry Volume (K Unit), by End User 2024 & 2032
- Figure 33: North America Cytology Industry Revenue Share (%), by End User 2024 & 2032
- Figure 34: North America Cytology Industry Volume Share (%), by End User 2024 & 2032
- Figure 35: North America Cytology Industry Revenue (Million), by Country 2024 & 2032
- Figure 36: North America Cytology Industry Volume (K Unit), by Country 2024 & 2032
- Figure 37: North America Cytology Industry Revenue Share (%), by Country 2024 & 2032
- Figure 38: North America Cytology Industry Volume Share (%), by Country 2024 & 2032
- Figure 39: Europe Cytology Industry Revenue (Million), by Type of Examination 2024 & 2032
- Figure 40: Europe Cytology Industry Volume (K Unit), by Type of Examination 2024 & 2032
- Figure 41: Europe Cytology Industry Revenue Share (%), by Type of Examination 2024 & 2032
- Figure 42: Europe Cytology Industry Volume Share (%), by Type of Examination 2024 & 2032
- Figure 43: Europe Cytology Industry Revenue (Million), by Test Type 2024 & 2032
- Figure 44: Europe Cytology Industry Volume (K Unit), by Test Type 2024 & 2032
- Figure 45: Europe Cytology Industry Revenue Share (%), by Test Type 2024 & 2032
- Figure 46: Europe Cytology Industry Volume Share (%), by Test Type 2024 & 2032
- Figure 47: Europe Cytology Industry Revenue (Million), by End User 2024 & 2032
- Figure 48: Europe Cytology Industry Volume (K Unit), by End User 2024 & 2032
- Figure 49: Europe Cytology Industry Revenue Share (%), by End User 2024 & 2032
- Figure 50: Europe Cytology Industry Volume Share (%), by End User 2024 & 2032
- Figure 51: Europe Cytology Industry Revenue (Million), by Country 2024 & 2032
- Figure 52: Europe Cytology Industry Volume (K Unit), by Country 2024 & 2032
- Figure 53: Europe Cytology Industry Revenue Share (%), by Country 2024 & 2032
- Figure 54: Europe Cytology Industry Volume Share (%), by Country 2024 & 2032
- Figure 55: Asia Pacific Cytology Industry Revenue (Million), by Type of Examination 2024 & 2032
- Figure 56: Asia Pacific Cytology Industry Volume (K Unit), by Type of Examination 2024 & 2032
- Figure 57: Asia Pacific Cytology Industry Revenue Share (%), by Type of Examination 2024 & 2032
- Figure 58: Asia Pacific Cytology Industry Volume Share (%), by Type of Examination 2024 & 2032
- Figure 59: Asia Pacific Cytology Industry Revenue (Million), by Test Type 2024 & 2032
- Figure 60: Asia Pacific Cytology Industry Volume (K Unit), by Test Type 2024 & 2032
- Figure 61: Asia Pacific Cytology Industry Revenue Share (%), by Test Type 2024 & 2032
- Figure 62: Asia Pacific Cytology Industry Volume Share (%), by Test Type 2024 & 2032
- Figure 63: Asia Pacific Cytology Industry Revenue (Million), by End User 2024 & 2032
- Figure 64: Asia Pacific Cytology Industry Volume (K Unit), by End User 2024 & 2032
- Figure 65: Asia Pacific Cytology Industry Revenue Share (%), by End User 2024 & 2032
- Figure 66: Asia Pacific Cytology Industry Volume Share (%), by End User 2024 & 2032
- Figure 67: Asia Pacific Cytology Industry Revenue (Million), by Country 2024 & 2032
- Figure 68: Asia Pacific Cytology Industry Volume (K Unit), by Country 2024 & 2032
- Figure 69: Asia Pacific Cytology Industry Revenue Share (%), by Country 2024 & 2032
- Figure 70: Asia Pacific Cytology Industry Volume Share (%), by Country 2024 & 2032
- Figure 71: Middle East and Africa Cytology Industry Revenue (Million), by Type of Examination 2024 & 2032
- Figure 72: Middle East and Africa Cytology Industry Volume (K Unit), by Type of Examination 2024 & 2032
- Figure 73: Middle East and Africa Cytology Industry Revenue Share (%), by Type of Examination 2024 & 2032
- Figure 74: Middle East and Africa Cytology Industry Volume Share (%), by Type of Examination 2024 & 2032
- Figure 75: Middle East and Africa Cytology Industry Revenue (Million), by Test Type 2024 & 2032
- Figure 76: Middle East and Africa Cytology Industry Volume (K Unit), by Test Type 2024 & 2032
- Figure 77: Middle East and Africa Cytology Industry Revenue Share (%), by Test Type 2024 & 2032
- Figure 78: Middle East and Africa Cytology Industry Volume Share (%), by Test Type 2024 & 2032
- Figure 79: Middle East and Africa Cytology Industry Revenue (Million), by End User 2024 & 2032
- Figure 80: Middle East and Africa Cytology Industry Volume (K Unit), by End User 2024 & 2032
- Figure 81: Middle East and Africa Cytology Industry Revenue Share (%), by End User 2024 & 2032
- Figure 82: Middle East and Africa Cytology Industry Volume Share (%), by End User 2024 & 2032
- Figure 83: Middle East and Africa Cytology Industry Revenue (Million), by Country 2024 & 2032
- Figure 84: Middle East and Africa Cytology Industry Volume (K Unit), by Country 2024 & 2032
- Figure 85: Middle East and Africa Cytology Industry Revenue Share (%), by Country 2024 & 2032
- Figure 86: Middle East and Africa Cytology Industry Volume Share (%), by Country 2024 & 2032
- Figure 87: South America Cytology Industry Revenue (Million), by Type of Examination 2024 & 2032
- Figure 88: South America Cytology Industry Volume (K Unit), by Type of Examination 2024 & 2032
- Figure 89: South America Cytology Industry Revenue Share (%), by Type of Examination 2024 & 2032
- Figure 90: South America Cytology Industry Volume Share (%), by Type of Examination 2024 & 2032
- Figure 91: South America Cytology Industry Revenue (Million), by Test Type 2024 & 2032
- Figure 92: South America Cytology Industry Volume (K Unit), by Test Type 2024 & 2032
- Figure 93: South America Cytology Industry Revenue Share (%), by Test Type 2024 & 2032
- Figure 94: South America Cytology Industry Volume Share (%), by Test Type 2024 & 2032
- Figure 95: South America Cytology Industry Revenue (Million), by End User 2024 & 2032
- Figure 96: South America Cytology Industry Volume (K Unit), by End User 2024 & 2032
- Figure 97: South America Cytology Industry Revenue Share (%), by End User 2024 & 2032
- Figure 98: South America Cytology Industry Volume Share (%), by End User 2024 & 2032
- Figure 99: South America Cytology Industry Revenue (Million), by Country 2024 & 2032
- Figure 100: South America Cytology Industry Volume (K Unit), by Country 2024 & 2032
- Figure 101: South America Cytology Industry Revenue Share (%), by Country 2024 & 2032
- Figure 102: South America Cytology Industry Volume Share (%), by Country 2024 & 2032
List of Tables
- Table 1: Global Cytology Industry Revenue Million Forecast, by Region 2019 & 2032
- Table 2: Global Cytology Industry Volume K Unit Forecast, by Region 2019 & 2032
- Table 3: Global Cytology Industry Revenue Million Forecast, by Type of Examination 2019 & 2032
- Table 4: Global Cytology Industry Volume K Unit Forecast, by Type of Examination 2019 & 2032
- Table 5: Global Cytology Industry Revenue Million Forecast, by Test Type 2019 & 2032
- Table 6: Global Cytology Industry Volume K Unit Forecast, by Test Type 2019 & 2032
- Table 7: Global Cytology Industry Revenue Million Forecast, by End User 2019 & 2032
- Table 8: Global Cytology Industry Volume K Unit Forecast, by End User 2019 & 2032
- Table 9: Global Cytology Industry Revenue Million Forecast, by Region 2019 & 2032
- Table 10: Global Cytology Industry Volume K Unit Forecast, by Region 2019 & 2032
- Table 11: Global Cytology Industry Revenue Million Forecast, by Country 2019 & 2032
- Table 12: Global Cytology Industry Volume K Unit Forecast, by Country 2019 & 2032
- Table 13: United States Cytology Industry Revenue (Million) Forecast, by Application 2019 & 2032
- Table 14: United States Cytology Industry Volume (K Unit) Forecast, by Application 2019 & 2032
- Table 15: Canada Cytology Industry Revenue (Million) Forecast, by Application 2019 & 2032
- Table 16: Canada Cytology Industry Volume (K Unit) Forecast, by Application 2019 & 2032
- Table 17: Mexico Cytology Industry Revenue (Million) Forecast, by Application 2019 & 2032
- Table 18: Mexico Cytology Industry Volume (K Unit) Forecast, by Application 2019 & 2032
- Table 19: Global Cytology Industry Revenue Million Forecast, by Country 2019 & 2032
- Table 20: Global Cytology Industry Volume K Unit Forecast, by Country 2019 & 2032
- Table 21: Germany Cytology Industry Revenue (Million) Forecast, by Application 2019 & 2032
- Table 22: Germany Cytology Industry Volume (K Unit) Forecast, by Application 2019 & 2032
- Table 23: United Kingdom Cytology Industry Revenue (Million) Forecast, by Application 2019 & 2032
- Table 24: United Kingdom Cytology Industry Volume (K Unit) Forecast, by Application 2019 & 2032
- Table 25: France Cytology Industry Revenue (Million) Forecast, by Application 2019 & 2032
- Table 26: France Cytology Industry Volume (K Unit) Forecast, by Application 2019 & 2032
- Table 27: Italy Cytology Industry Revenue (Million) Forecast, by Application 2019 & 2032
- Table 28: Italy Cytology Industry Volume (K Unit) Forecast, by Application 2019 & 2032
- Table 29: Spain Cytology Industry Revenue (Million) Forecast, by Application 2019 & 2032
- Table 30: Spain Cytology Industry Volume (K Unit) Forecast, by Application 2019 & 2032
- Table 31: Rest of Europe Cytology Industry Revenue (Million) Forecast, by Application 2019 & 2032
- Table 32: Rest of Europe Cytology Industry Volume (K Unit) Forecast, by Application 2019 & 2032
- Table 33: Global Cytology Industry Revenue Million Forecast, by Country 2019 & 2032
- Table 34: Global Cytology Industry Volume K Unit Forecast, by Country 2019 & 2032
- Table 35: China Cytology Industry Revenue (Million) Forecast, by Application 2019 & 2032
- Table 36: China Cytology Industry Volume (K Unit) Forecast, by Application 2019 & 2032
- Table 37: Japan Cytology Industry Revenue (Million) Forecast, by Application 2019 & 2032
- Table 38: Japan Cytology Industry Volume (K Unit) Forecast, by Application 2019 & 2032
- Table 39: India Cytology Industry Revenue (Million) Forecast, by Application 2019 & 2032
- Table 40: India Cytology Industry Volume (K Unit) Forecast, by Application 2019 & 2032
- Table 41: Australia Cytology Industry Revenue (Million) Forecast, by Application 2019 & 2032
- Table 42: Australia Cytology Industry Volume (K Unit) Forecast, by Application 2019 & 2032
- Table 43: South korea Cytology Industry Revenue (Million) Forecast, by Application 2019 & 2032
- Table 44: South korea Cytology Industry Volume (K Unit) Forecast, by Application 2019 & 2032
- Table 45: Rest of Asia Pacific Cytology Industry Revenue (Million) Forecast, by Application 2019 & 2032
- Table 46: Rest of Asia Pacific Cytology Industry Volume (K Unit) Forecast, by Application 2019 & 2032
- Table 47: Global Cytology Industry Revenue Million Forecast, by Country 2019 & 2032
- Table 48: Global Cytology Industry Volume K Unit Forecast, by Country 2019 & 2032
- Table 49: GCC Cytology Industry Revenue (Million) Forecast, by Application 2019 & 2032
- Table 50: GCC Cytology Industry Volume (K Unit) Forecast, by Application 2019 & 2032
- Table 51: South Africa Cytology Industry Revenue (Million) Forecast, by Application 2019 & 2032
- Table 52: South Africa Cytology Industry Volume (K Unit) Forecast, by Application 2019 & 2032
- Table 53: Rest of Middle East and Africa Cytology Industry Revenue (Million) Forecast, by Application 2019 & 2032
- Table 54: Rest of Middle East and Africa Cytology Industry Volume (K Unit) Forecast, by Application 2019 & 2032
- Table 55: Global Cytology Industry Revenue Million Forecast, by Country 2019 & 2032
- Table 56: Global Cytology Industry Volume K Unit Forecast, by Country 2019 & 2032
- Table 57: Brazil Cytology Industry Revenue (Million) Forecast, by Application 2019 & 2032
- Table 58: Brazil Cytology Industry Volume (K Unit) Forecast, by Application 2019 & 2032
- Table 59: Argentina Cytology Industry Revenue (Million) Forecast, by Application 2019 & 2032
- Table 60: Argentina Cytology Industry Volume (K Unit) Forecast, by Application 2019 & 2032
- Table 61: Rest of South America Cytology Industry Revenue (Million) Forecast, by Application 2019 & 2032
- Table 62: Rest of South America Cytology Industry Volume (K Unit) Forecast, by Application 2019 & 2032
- Table 63: Global Cytology Industry Revenue Million Forecast, by Type of Examination 2019 & 2032
- Table 64: Global Cytology Industry Volume K Unit Forecast, by Type of Examination 2019 & 2032
- Table 65: Global Cytology Industry Revenue Million Forecast, by Test Type 2019 & 2032
- Table 66: Global Cytology Industry Volume K Unit Forecast, by Test Type 2019 & 2032
- Table 67: Global Cytology Industry Revenue Million Forecast, by End User 2019 & 2032
- Table 68: Global Cytology Industry Volume K Unit Forecast, by End User 2019 & 2032
- Table 69: Global Cytology Industry Revenue Million Forecast, by Country 2019 & 2032
- Table 70: Global Cytology Industry Volume K Unit Forecast, by Country 2019 & 2032
- Table 71: United States Cytology Industry Revenue (Million) Forecast, by Application 2019 & 2032
- Table 72: United States Cytology Industry Volume (K Unit) Forecast, by Application 2019 & 2032
- Table 73: Canada Cytology Industry Revenue (Million) Forecast, by Application 2019 & 2032
- Table 74: Canada Cytology Industry Volume (K Unit) Forecast, by Application 2019 & 2032
- Table 75: Mexico Cytology Industry Revenue (Million) Forecast, by Application 2019 & 2032
- Table 76: Mexico Cytology Industry Volume (K Unit) Forecast, by Application 2019 & 2032
- Table 77: Global Cytology Industry Revenue Million Forecast, by Type of Examination 2019 & 2032
- Table 78: Global Cytology Industry Volume K Unit Forecast, by Type of Examination 2019 & 2032
- Table 79: Global Cytology Industry Revenue Million Forecast, by Test Type 2019 & 2032
- Table 80: Global Cytology Industry Volume K Unit Forecast, by Test Type 2019 & 2032
- Table 81: Global Cytology Industry Revenue Million Forecast, by End User 2019 & 2032
- Table 82: Global Cytology Industry Volume K Unit Forecast, by End User 2019 & 2032
- Table 83: Global Cytology Industry Revenue Million Forecast, by Country 2019 & 2032
- Table 84: Global Cytology Industry Volume K Unit Forecast, by Country 2019 & 2032
- Table 85: Germany Cytology Industry Revenue (Million) Forecast, by Application 2019 & 2032
- Table 86: Germany Cytology Industry Volume (K Unit) Forecast, by Application 2019 & 2032
- Table 87: United Kingdom Cytology Industry Revenue (Million) Forecast, by Application 2019 & 2032
- Table 88: United Kingdom Cytology Industry Volume (K Unit) Forecast, by Application 2019 & 2032
- Table 89: France Cytology Industry Revenue (Million) Forecast, by Application 2019 & 2032
- Table 90: France Cytology Industry Volume (K Unit) Forecast, by Application 2019 & 2032
- Table 91: Italy Cytology Industry Revenue (Million) Forecast, by Application 2019 & 2032
- Table 92: Italy Cytology Industry Volume (K Unit) Forecast, by Application 2019 & 2032
- Table 93: Spain Cytology Industry Revenue (Million) Forecast, by Application 2019 & 2032
- Table 94: Spain Cytology Industry Volume (K Unit) Forecast, by Application 2019 & 2032
- Table 95: Rest of Europe Cytology Industry Revenue (Million) Forecast, by Application 2019 & 2032
- Table 96: Rest of Europe Cytology Industry Volume (K Unit) Forecast, by Application 2019 & 2032
- Table 97: Global Cytology Industry Revenue Million Forecast, by Type of Examination 2019 & 2032
- Table 98: Global Cytology Industry Volume K Unit Forecast, by Type of Examination 2019 & 2032
- Table 99: Global Cytology Industry Revenue Million Forecast, by Test Type 2019 & 2032
- Table 100: Global Cytology Industry Volume K Unit Forecast, by Test Type 2019 & 2032
- Table 101: Global Cytology Industry Revenue Million Forecast, by End User 2019 & 2032
- Table 102: Global Cytology Industry Volume K Unit Forecast, by End User 2019 & 2032
- Table 103: Global Cytology Industry Revenue Million Forecast, by Country 2019 & 2032
- Table 104: Global Cytology Industry Volume K Unit Forecast, by Country 2019 & 2032
- Table 105: China Cytology Industry Revenue (Million) Forecast, by Application 2019 & 2032
- Table 106: China Cytology Industry Volume (K Unit) Forecast, by Application 2019 & 2032
- Table 107: Japan Cytology Industry Revenue (Million) Forecast, by Application 2019 & 2032
- Table 108: Japan Cytology Industry Volume (K Unit) Forecast, by Application 2019 & 2032
- Table 109: India Cytology Industry Revenue (Million) Forecast, by Application 2019 & 2032
- Table 110: India Cytology Industry Volume (K Unit) Forecast, by Application 2019 & 2032
- Table 111: Australia Cytology Industry Revenue (Million) Forecast, by Application 2019 & 2032
- Table 112: Australia Cytology Industry Volume (K Unit) Forecast, by Application 2019 & 2032
- Table 113: South korea Cytology Industry Revenue (Million) Forecast, by Application 2019 & 2032
- Table 114: South korea Cytology Industry Volume (K Unit) Forecast, by Application 2019 & 2032
- Table 115: Rest of Asia Pacific Cytology Industry Revenue (Million) Forecast, by Application 2019 & 2032
- Table 116: Rest of Asia Pacific Cytology Industry Volume (K Unit) Forecast, by Application 2019 & 2032
- Table 117: Global Cytology Industry Revenue Million Forecast, by Type of Examination 2019 & 2032
- Table 118: Global Cytology Industry Volume K Unit Forecast, by Type of Examination 2019 & 2032
- Table 119: Global Cytology Industry Revenue Million Forecast, by Test Type 2019 & 2032
- Table 120: Global Cytology Industry Volume K Unit Forecast, by Test Type 2019 & 2032
- Table 121: Global Cytology Industry Revenue Million Forecast, by End User 2019 & 2032
- Table 122: Global Cytology Industry Volume K Unit Forecast, by End User 2019 & 2032
- Table 123: Global Cytology Industry Revenue Million Forecast, by Country 2019 & 2032
- Table 124: Global Cytology Industry Volume K Unit Forecast, by Country 2019 & 2032
- Table 125: GCC Cytology Industry Revenue (Million) Forecast, by Application 2019 & 2032
- Table 126: GCC Cytology Industry Volume (K Unit) Forecast, by Application 2019 & 2032
- Table 127: South Africa Cytology Industry Revenue (Million) Forecast, by Application 2019 & 2032
- Table 128: South Africa Cytology Industry Volume (K Unit) Forecast, by Application 2019 & 2032
- Table 129: Rest of Middle East and Africa Cytology Industry Revenue (Million) Forecast, by Application 2019 & 2032
- Table 130: Rest of Middle East and Africa Cytology Industry Volume (K Unit) Forecast, by Application 2019 & 2032
- Table 131: Global Cytology Industry Revenue Million Forecast, by Type of Examination 2019 & 2032
- Table 132: Global Cytology Industry Volume K Unit Forecast, by Type of Examination 2019 & 2032
- Table 133: Global Cytology Industry Revenue Million Forecast, by Test Type 2019 & 2032
- Table 134: Global Cytology Industry Volume K Unit Forecast, by Test Type 2019 & 2032
- Table 135: Global Cytology Industry Revenue Million Forecast, by End User 2019 & 2032
- Table 136: Global Cytology Industry Volume K Unit Forecast, by End User 2019 & 2032
- Table 137: Global Cytology Industry Revenue Million Forecast, by Country 2019 & 2032
- Table 138: Global Cytology Industry Volume K Unit Forecast, by Country 2019 & 2032
- Table 139: Brazil Cytology Industry Revenue (Million) Forecast, by Application 2019 & 2032
- Table 140: Brazil Cytology Industry Volume (K Unit) Forecast, by Application 2019 & 2032
- Table 141: Argentina Cytology Industry Revenue (Million) Forecast, by Application 2019 & 2032
- Table 142: Argentina Cytology Industry Volume (K Unit) Forecast, by Application 2019 & 2032
- Table 143: Rest of South America Cytology Industry Revenue (Million) Forecast, by Application 2019 & 2032
- Table 144: Rest of South America Cytology Industry Volume (K Unit) Forecast, by Application 2019 & 2032
Frequently Asked Questions
1. What is the projected Compound Annual Growth Rate (CAGR) of the Cytology Industry?
The projected CAGR is approximately 13.50%.
2. Which companies are prominent players in the Cytology Industry?
Key companies in the market include Becton Dickinson and Company, Merck KGaA, F Hoffmann-La Roche Ltd, Hologic Inc, Thermo Fisher Scientific Inc, Trivitron Healthcare, Danaher Corporation, Abbott, PerkinElmer Inc, Sysmex Corporation.
3. What are the main segments of the Cytology Industry?
The market segments include Type of Examination, Test Type, End User.
4. Can you provide details about the market size?
The market size is estimated to be USD 20.54 Million as of 2022.
5. What are some drivers contributing to market growth?
Rising Prevalence of Cancer; Increasing Standardization of Pathological Laboratories; Technological Advancements in Diagnostic and Molecular Techniques.
6. What are the notable trends driving market growth?
Cervical Cancer Segment is Expected to Have a Significant Market Share During the Forecast Period.
7. Are there any restraints impacting market growth?
Safety Issues and Diagnostic Accuracy Issues with Histopathological and Cytopathological Tests; Lack of Awareness among the Public for Diagnostic Tests.
8. Can you provide examples of recent developments in the market?
February 2023: BioReference Health LLC announced today it would be one of the first commercial laboratories to offer the CINtec PLUS Cytology test from Roche Diagnostics. CINtec PLUS Cytology is the only FDA-approved dual-stain triage test for patients who have a positive high-risk human papillomavirus (HPV) result.
9. What pricing options are available for accessing the report?
Pricing options include single-user, multi-user, and enterprise licenses priced at USD 4750, USD 5250, and USD 8750 respectively.
10. Is the market size provided in terms of value or volume?
The market size is provided in terms of value, measured in Million and volume, measured in K Unit.
11. Are there any specific market keywords associated with the report?
Yes, the market keyword associated with the report is "Cytology Industry," which aids in identifying and referencing the specific market segment covered.
12. How do I determine which pricing option suits my needs best?
The pricing options vary based on user requirements and access needs. Individual users may opt for single-user licenses, while businesses requiring broader access may choose multi-user or enterprise licenses for cost-effective access to the report.
13. Are there any additional resources or data provided in the Cytology Industry report?
While the report offers comprehensive insights, it's advisable to review the specific contents or supplementary materials provided to ascertain if additional resources or data are available.
14. How can I stay updated on further developments or reports in the Cytology Industry?
To stay informed about further developments, trends, and reports in the Cytology Industry, consider subscribing to industry newsletters, following relevant companies and organizations, or regularly checking reputable industry news sources and publications.
Methodology
Step 1 - Identification of Relevant Samples Size from Population Database


Step 2 - Approaches for Defining Global Market Size (Value, Volume* & Price*)

Note*: In applicable scenarios
Step 3 - Data Sources
Primary Research
- Web Analytics
- Survey Reports
- Research Institute
- Latest Research Reports
- Opinion Leaders
Secondary Research
- Annual Reports
- White Paper
- Latest Press Release
- Industry Association
- Paid Database
- Investor Presentations

Step 4 - Data Triangulation
Involves using different sources of information in order to increase the validity of a study
These sources are likely to be stakeholders in a program - participants, other researchers, program staff, other community members, and so on.
Then we put all data in single framework & apply various statistical tools to find out the dynamic on the market.
During the analysis stage, feedback from the stakeholder groups would be compared to determine areas of agreement as well as areas of divergence
