

Key Insights
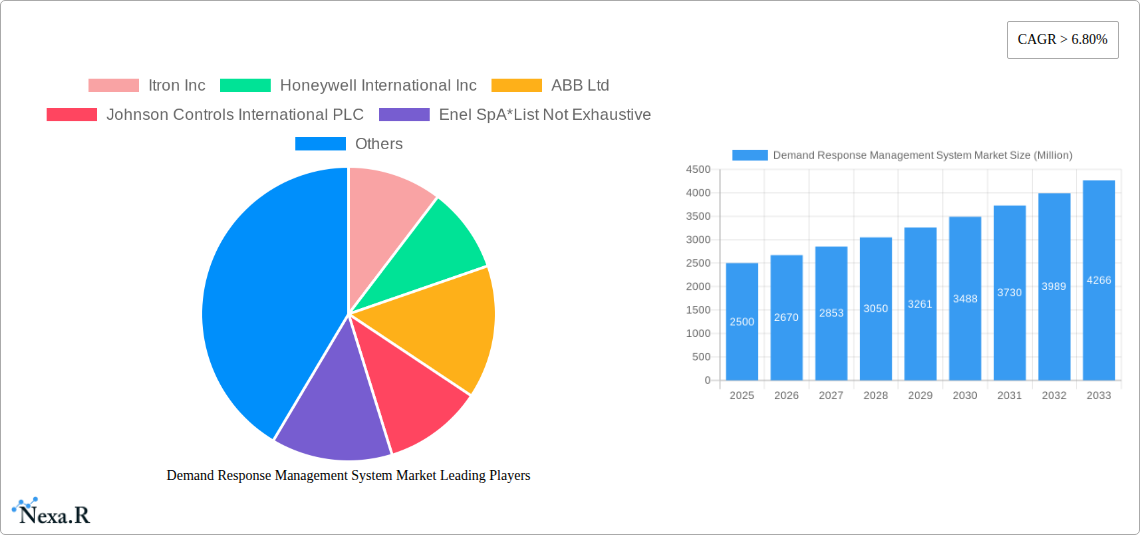
The Demand Response Management System (DRMS) market is experiencing robust growth, fueled by increasing energy costs, stringent environmental regulations, and the expanding integration of renewable energy sources. The market's Compound Annual Growth Rate (CAGR) exceeding 6.80% from 2019 to 2024 indicates significant market expansion. This growth is driven primarily by the escalating need for grid stability and efficiency, particularly with the intermittent nature of solar and wind power. The shift towards smart grids and the rising adoption of advanced metering infrastructure (AMI) further accelerate market expansion. Automated Demand Response (ADR) systems are gaining traction over conventional methods due to their enhanced efficiency and automated functionalities, offering better control and optimized energy consumption. Key players like Itron, Honeywell, ABB, and Johnson Controls are investing heavily in research and development, expanding their product portfolios, and strategically acquiring smaller companies to solidify their market positions. Geographic growth is observed across North America (especially the US), Europe (led by Germany and the UK), and the Asia-Pacific region (driven by China and India), owing to the burgeoning renewable energy sectors and supportive government policies in these regions.
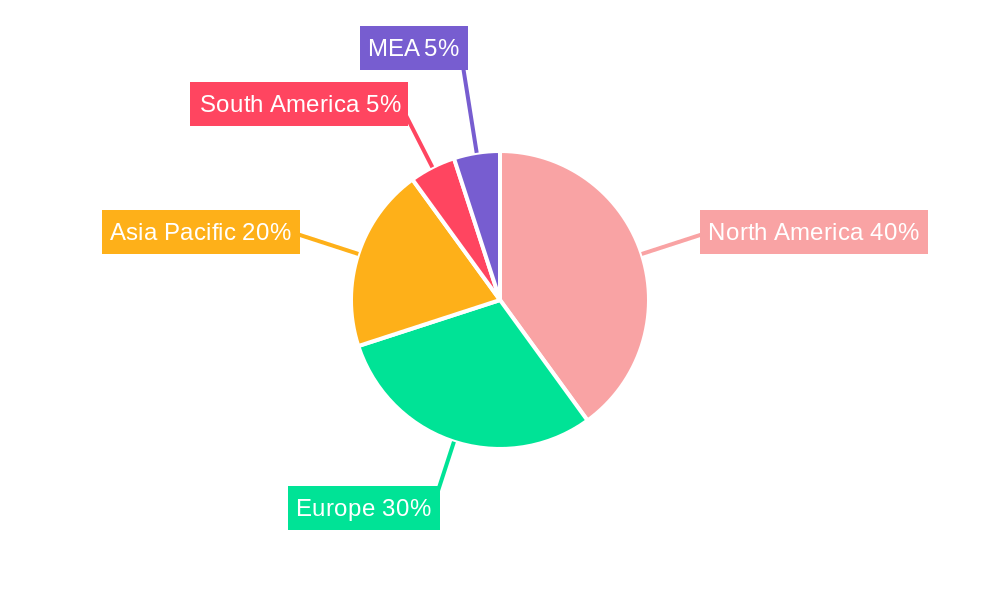
The market segmentation reveals a clear preference towards Automated Demand Response systems, reflecting the industry's broader move towards automation and data-driven optimization. The North American market currently holds a significant share, but the Asia-Pacific region is projected to witness the most substantial growth in the coming years, driven by increasing energy demand and infrastructure development. While challenges remain, such as high initial investment costs and cybersecurity concerns associated with sophisticated ADR systems, the overall market outlook for DRMS remains overwhelmingly positive. Continued technological advancements, supportive regulatory frameworks, and the ongoing need for grid modernization are expected to sustain the market's strong growth trajectory through 2033. Market size estimations suggest a substantial increase in the coming years, reflecting the strong growth trajectory.
Demand Response Management System Market: A Comprehensive Report (2019-2033)
This comprehensive report provides an in-depth analysis of the Demand Response Management System (DRMS) market, encompassing market dynamics, growth trends, regional analysis, product landscape, key players, and future outlook. The study period covers 2019-2033, with 2025 serving as the base and estimated year. The report segments the market by System Type: Conventional Demand Response and Automated Demand Response, offering granular insights into this rapidly evolving sector. The total market size is projected to reach xx Million by 2033.
Demand Response Management System Market Dynamics & Structure
The Demand Response Management System market is characterized by moderate concentration, with key players like Itron Inc, Honeywell International Inc, ABB Ltd, Johnson Controls International PLC, Enel SpA, EnerNOC Inc, Siemens AG, Schneider Electric SE, General Electric Company, and AutoGrid Systems Inc vying for market share. Technological innovation, particularly in AI and IoT integration, is a key driver, while stringent regulatory frameworks aimed at improving grid efficiency and reducing carbon emissions shape market growth. The market experiences competitive pressures from alternative energy solutions and energy efficiency improvements. M&A activity has been moderate in recent years, with xx deals recorded between 2019 and 2024, leading to a xx% increase in market consolidation.
- Market Concentration: Moderately concentrated, with top 5 players holding approximately xx% market share in 2024.
- Technological Innovation: AI, IoT, and advanced analytics are driving the development of sophisticated DRMS solutions.
- Regulatory Landscape: Stringent environmental regulations and grid modernization initiatives are fostering market growth.
- Competitive Substitutes: Energy efficiency improvements and alternative energy sources pose competitive challenges.
- M&A Activity: xx M&A deals between 2019-2024, indicating consolidation trends within the industry.
- Innovation Barriers: High initial investment costs and the need for advanced technical expertise pose barriers to entry.
Demand Response Management System Market Growth Trends & Insights
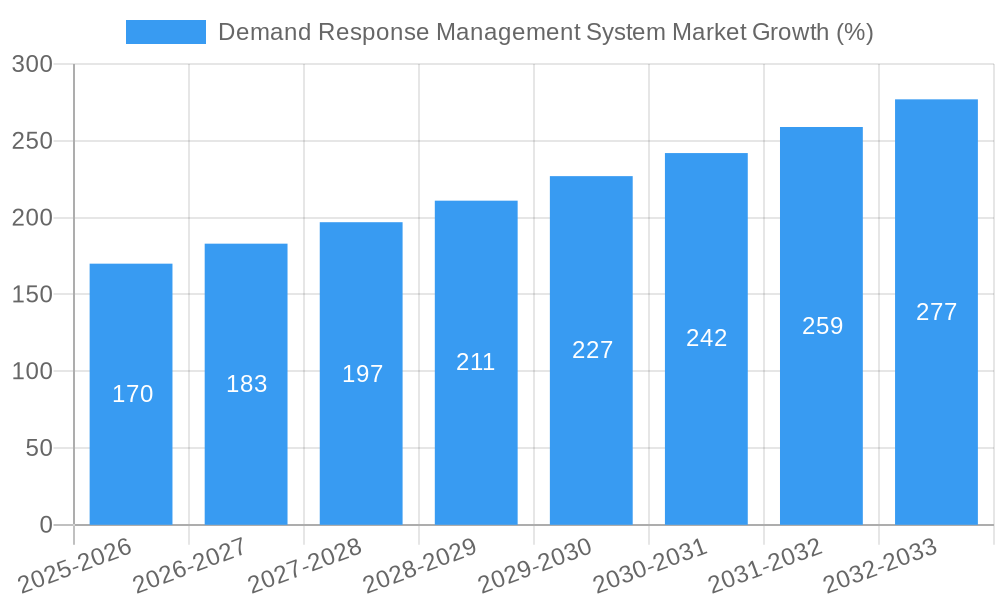
The DRMS market has exhibited robust growth during the historical period (2019-2024), achieving a CAGR of xx%. This growth is fueled by increasing energy prices, rising concerns about grid stability, and the growing adoption of renewable energy sources. The market is expected to continue its upward trajectory during the forecast period (2025-2033), driven by advancements in automation, the integration of smart grid technologies, and the increasing demand for energy efficiency solutions. Market penetration is expected to reach xx% by 2033, indicating significant growth potential. Technological disruptions, like the widespread adoption of AI and machine learning algorithms in DRMS, are transforming the industry's landscape, leading to more efficient and responsive systems. Shifting consumer behavior towards sustainability and energy conservation also contributes significantly to market growth.
Dominant Regions, Countries, or Segments in Demand Response Management System Market
North America currently dominates the DRMS market, driven by robust regulatory support, advanced infrastructure, and early adoption of smart grid technologies. Within system types, Automated Demand Response (ADR) is experiencing faster growth compared to Conventional Demand Response (CDR), due to its enhanced efficiency and scalability.
- North America: Strong regulatory frameworks, advanced infrastructure, and early adoption of smart grid technologies are key drivers.
- Europe: Increasing focus on renewable energy integration and decarbonization goals fuel market growth.
- Asia-Pacific: Rapid urbanization, industrialization, and increasing electricity demand are key growth catalysts.
- Automated Demand Response (ADR): Higher adoption rate compared to CDR due to enhanced efficiency and scalability.
- Conventional Demand Response (CDR): Still holds a significant market share but its growth is expected to be slower than ADR.
Demand Response Management System Market Product Landscape
The DRMS market offers a range of solutions, including software platforms, hardware components, and integrated systems. Recent innovations focus on improved data analytics, predictive capabilities, and enhanced user interfaces. Key performance metrics include energy savings, grid stability improvements, and reduced carbon emissions. Unique selling propositions emphasize ease of integration, cost-effectiveness, and real-time monitoring capabilities. The integration of AI and machine learning is revolutionizing the sector, paving the way for more intelligent and autonomous DRMS systems.
Key Drivers, Barriers & Challenges in Demand Response Management System Market
Key Drivers:
- Rising energy costs and the need for grid optimization are boosting DRMS adoption.
- Increasing integration of renewable energy sources necessitates robust demand-side management.
- Government regulations and incentives are stimulating investments in DRMS technologies.
Key Barriers & Challenges:
- High upfront investment costs can deter adoption, particularly for smaller businesses.
- Lack of awareness and understanding of DRMS benefits among consumers and businesses.
- Interoperability issues among different DRMS systems and legacy infrastructure.
- xx% of market players face significant challenges in securing funding for projects.
Emerging Opportunities in Demand Response Management System Market
- Growing demand for microgrids and distributed energy resources is creating new opportunities for DRMS solutions.
- The increasing adoption of electric vehicles (EVs) necessitates sophisticated DRMS capabilities for grid management.
- The development of smart building technologies is fostering the integration of DRMS into building automation systems.
Growth Accelerators in the Demand Response Management System Market Industry
Technological advancements, strategic partnerships between energy providers and technology companies, and expansion into new geographical markets are key growth accelerators. The development of user-friendly interfaces and enhanced data analytics capabilities are improving DRMS adoption rates. Government support through incentives and regulatory frameworks further propels market growth.
Key Players Shaping the Demand Response Management System Market Market
- Itron Inc
- Honeywell International Inc
- ABB Ltd
- Johnson Controls International PLC
- Enel SpA
- EnerNOC Inc
- Siemens AG
- Schneider Electric SE
- General Electric Company
- AutoGrid Systems Inc
Notable Milestones in Demand Response Management System Market Sector
- July 2020: Enel X launched a demand response program in Taiwan, expanding its reach into the Asian market.
- February 2022: Tata Consultancy Services (TCS) launched TCS Clever Energy, enhancing the software solutions available in the DRMS market.
In-Depth Demand Response Management System Market Market Outlook
The DRMS market is poised for sustained growth, driven by technological innovation, increasing energy costs, and the growing need for grid modernization. Strategic partnerships, expansion into emerging markets, and the development of sophisticated AI-powered solutions will further fuel market expansion. The market presents significant opportunities for businesses that can offer cost-effective, scalable, and user-friendly DRMS solutions. The focus on integrating DRMS with renewable energy sources and smart grid technologies will be crucial for future growth.
Demand Response Management System Market Segmentation
-
1. System Type
- 1.1. Conventional Demand Response
- 1.2. Automated Demand Response
Demand Response Management System Market Segmentation By Geography
- 1. North America
- 2. Europe
- 3. Asia Pacific
- 4. South America
- 5. Middle East
Demand Response Management System Market REPORT HIGHLIGHTS
| Aspects | Details |
|---|---|
| Study Period | 2019-2033 |
| Base Year | 2024 |
| Estimated Year | 2025 |
| Forecast Period | 2025-2033 |
| Historical Period | 2019-2024 |
| Growth Rate | CAGR of > 6.80% from 2019-2033 |
| Segmentation |
|
Table of Contents
- 1. Introduction
- 1.1. Research Scope
- 1.2. Market Segmentation
- 1.3. Research Methodology
- 1.4. Definitions and Assumptions
- 2. Executive Summary
- 2.1. Introduction
- 3. Market Dynamics
- 3.1. Introduction
- 3.2. Market Drivers
- 3.2.1. 4.; Increasing Integration Of Renewable Energy Generation4.; Aging Power Grids And Investments In Transmission And Distribution Infrastructure
- 3.3. Market Restrains
- 3.3.1. 4.; Lack Of Investor Confidence Due To Sociopolitical Instability In Some Countries
- 3.4. Market Trends
- 3.4.1. Automated Demand Response Management System Type to Witness Significant Growth
- 4. Market Factor Analysis
- 4.1. Porters Five Forces
- 4.2. Supply/Value Chain
- 4.3. PESTEL analysis
- 4.4. Market Entropy
- 4.5. Patent/Trademark Analysis
- 5. Global Demand Response Management System Market Analysis, Insights and Forecast, 2019-2031
- 5.1. Market Analysis, Insights and Forecast - by System Type
- 5.1.1. Conventional Demand Response
- 5.1.2. Automated Demand Response
- 5.2. Market Analysis, Insights and Forecast - by Region
- 5.2.1. North America
- 5.2.2. Europe
- 5.2.3. Asia Pacific
- 5.2.4. South America
- 5.2.5. Middle East
- 5.1. Market Analysis, Insights and Forecast - by System Type
- 6. North America Demand Response Management System Market Analysis, Insights and Forecast, 2019-2031
- 6.1. Market Analysis, Insights and Forecast - by System Type
- 6.1.1. Conventional Demand Response
- 6.1.2. Automated Demand Response
- 6.1. Market Analysis, Insights and Forecast - by System Type
- 7. Europe Demand Response Management System Market Analysis, Insights and Forecast, 2019-2031
- 7.1. Market Analysis, Insights and Forecast - by System Type
- 7.1.1. Conventional Demand Response
- 7.1.2. Automated Demand Response
- 7.1. Market Analysis, Insights and Forecast - by System Type
- 8. Asia Pacific Demand Response Management System Market Analysis, Insights and Forecast, 2019-2031
- 8.1. Market Analysis, Insights and Forecast - by System Type
- 8.1.1. Conventional Demand Response
- 8.1.2. Automated Demand Response
- 8.1. Market Analysis, Insights and Forecast - by System Type
- 9. South America Demand Response Management System Market Analysis, Insights and Forecast, 2019-2031
- 9.1. Market Analysis, Insights and Forecast - by System Type
- 9.1.1. Conventional Demand Response
- 9.1.2. Automated Demand Response
- 9.1. Market Analysis, Insights and Forecast - by System Type
- 10. Middle East Demand Response Management System Market Analysis, Insights and Forecast, 2019-2031
- 10.1. Market Analysis, Insights and Forecast - by System Type
- 10.1.1. Conventional Demand Response
- 10.1.2. Automated Demand Response
- 10.1. Market Analysis, Insights and Forecast - by System Type
- 11. North America Demand Response Management System Market Analysis, Insights and Forecast, 2019-2031
- 11.1. Market Analysis, Insights and Forecast - By Country/Sub-region
- 11.1.1 United States
- 11.1.2 Canada
- 11.1.3 Mexico
- 12. Europe Demand Response Management System Market Analysis, Insights and Forecast, 2019-2031
- 12.1. Market Analysis, Insights and Forecast - By Country/Sub-region
- 12.1.1 Germany
- 12.1.2 United Kingdom
- 12.1.3 France
- 12.1.4 Spain
- 12.1.5 Italy
- 12.1.6 Spain
- 12.1.7 Belgium
- 12.1.8 Netherland
- 12.1.9 Nordics
- 12.1.10 Rest of Europe
- 13. Asia Pacific Demand Response Management System Market Analysis, Insights and Forecast, 2019-2031
- 13.1. Market Analysis, Insights and Forecast - By Country/Sub-region
- 13.1.1 China
- 13.1.2 Japan
- 13.1.3 India
- 13.1.4 South Korea
- 13.1.5 Southeast Asia
- 13.1.6 Australia
- 13.1.7 Indonesia
- 13.1.8 Phillipes
- 13.1.9 Singapore
- 13.1.10 Thailandc
- 13.1.11 Rest of Asia Pacific
- 14. South America Demand Response Management System Market Analysis, Insights and Forecast, 2019-2031
- 14.1. Market Analysis, Insights and Forecast - By Country/Sub-region
- 14.1.1 Brazil
- 14.1.2 Argentina
- 14.1.3 Peru
- 14.1.4 Chile
- 14.1.5 Colombia
- 14.1.6 Ecuador
- 14.1.7 Venezuela
- 14.1.8 Rest of South America
- 15. North America Demand Response Management System Market Analysis, Insights and Forecast, 2019-2031
- 15.1. Market Analysis, Insights and Forecast - By Country/Sub-region
- 15.1.1 United States
- 15.1.2 Canada
- 15.1.3 Mexico
- 16. MEA Demand Response Management System Market Analysis, Insights and Forecast, 2019-2031
- 16.1. Market Analysis, Insights and Forecast - By Country/Sub-region
- 16.1.1 United Arab Emirates
- 16.1.2 Saudi Arabia
- 16.1.3 South Africa
- 16.1.4 Rest of Middle East and Africa
- 17. Competitive Analysis
- 17.1. Global Market Share Analysis 2024
- 17.2. Company Profiles
- 17.2.1 Itron Inc
- 17.2.1.1. Overview
- 17.2.1.2. Products
- 17.2.1.3. SWOT Analysis
- 17.2.1.4. Recent Developments
- 17.2.1.5. Financials (Based on Availability)
- 17.2.2 Honeywell International Inc
- 17.2.2.1. Overview
- 17.2.2.2. Products
- 17.2.2.3. SWOT Analysis
- 17.2.2.4. Recent Developments
- 17.2.2.5. Financials (Based on Availability)
- 17.2.3 ABB Ltd
- 17.2.3.1. Overview
- 17.2.3.2. Products
- 17.2.3.3. SWOT Analysis
- 17.2.3.4. Recent Developments
- 17.2.3.5. Financials (Based on Availability)
- 17.2.4 Johnson Controls International PLC
- 17.2.4.1. Overview
- 17.2.4.2. Products
- 17.2.4.3. SWOT Analysis
- 17.2.4.4. Recent Developments
- 17.2.4.5. Financials (Based on Availability)
- 17.2.5 Enel SpA*List Not Exhaustive
- 17.2.5.1. Overview
- 17.2.5.2. Products
- 17.2.5.3. SWOT Analysis
- 17.2.5.4. Recent Developments
- 17.2.5.5. Financials (Based on Availability)
- 17.2.6 EnerNOC Inc
- 17.2.6.1. Overview
- 17.2.6.2. Products
- 17.2.6.3. SWOT Analysis
- 17.2.6.4. Recent Developments
- 17.2.6.5. Financials (Based on Availability)
- 17.2.7 Siemens AG
- 17.2.7.1. Overview
- 17.2.7.2. Products
- 17.2.7.3. SWOT Analysis
- 17.2.7.4. Recent Developments
- 17.2.7.5. Financials (Based on Availability)
- 17.2.8 Schneider Electric SE
- 17.2.8.1. Overview
- 17.2.8.2. Products
- 17.2.8.3. SWOT Analysis
- 17.2.8.4. Recent Developments
- 17.2.8.5. Financials (Based on Availability)
- 17.2.9 General Electric Company
- 17.2.9.1. Overview
- 17.2.9.2. Products
- 17.2.9.3. SWOT Analysis
- 17.2.9.4. Recent Developments
- 17.2.9.5. Financials (Based on Availability)
- 17.2.10 AutoGrid Systems Inc
- 17.2.10.1. Overview
- 17.2.10.2. Products
- 17.2.10.3. SWOT Analysis
- 17.2.10.4. Recent Developments
- 17.2.10.5. Financials (Based on Availability)
- 17.2.1 Itron Inc
List of Figures
- Figure 1: Global Demand Response Management System Market Revenue Breakdown (Million, %) by Region 2024 & 2032
- Figure 2: North America Demand Response Management System Market Revenue (Million), by Country 2024 & 2032
- Figure 3: North America Demand Response Management System Market Revenue Share (%), by Country 2024 & 2032
- Figure 4: Europe Demand Response Management System Market Revenue (Million), by Country 2024 & 2032
- Figure 5: Europe Demand Response Management System Market Revenue Share (%), by Country 2024 & 2032
- Figure 6: Asia Pacific Demand Response Management System Market Revenue (Million), by Country 2024 & 2032
- Figure 7: Asia Pacific Demand Response Management System Market Revenue Share (%), by Country 2024 & 2032
- Figure 8: South America Demand Response Management System Market Revenue (Million), by Country 2024 & 2032
- Figure 9: South America Demand Response Management System Market Revenue Share (%), by Country 2024 & 2032
- Figure 10: North America Demand Response Management System Market Revenue (Million), by Country 2024 & 2032
- Figure 11: North America Demand Response Management System Market Revenue Share (%), by Country 2024 & 2032
- Figure 12: MEA Demand Response Management System Market Revenue (Million), by Country 2024 & 2032
- Figure 13: MEA Demand Response Management System Market Revenue Share (%), by Country 2024 & 2032
- Figure 14: North America Demand Response Management System Market Revenue (Million), by System Type 2024 & 2032
- Figure 15: North America Demand Response Management System Market Revenue Share (%), by System Type 2024 & 2032
- Figure 16: North America Demand Response Management System Market Revenue (Million), by Country 2024 & 2032
- Figure 17: North America Demand Response Management System Market Revenue Share (%), by Country 2024 & 2032
- Figure 18: Europe Demand Response Management System Market Revenue (Million), by System Type 2024 & 2032
- Figure 19: Europe Demand Response Management System Market Revenue Share (%), by System Type 2024 & 2032
- Figure 20: Europe Demand Response Management System Market Revenue (Million), by Country 2024 & 2032
- Figure 21: Europe Demand Response Management System Market Revenue Share (%), by Country 2024 & 2032
- Figure 22: Asia Pacific Demand Response Management System Market Revenue (Million), by System Type 2024 & 2032
- Figure 23: Asia Pacific Demand Response Management System Market Revenue Share (%), by System Type 2024 & 2032
- Figure 24: Asia Pacific Demand Response Management System Market Revenue (Million), by Country 2024 & 2032
- Figure 25: Asia Pacific Demand Response Management System Market Revenue Share (%), by Country 2024 & 2032
- Figure 26: South America Demand Response Management System Market Revenue (Million), by System Type 2024 & 2032
- Figure 27: South America Demand Response Management System Market Revenue Share (%), by System Type 2024 & 2032
- Figure 28: South America Demand Response Management System Market Revenue (Million), by Country 2024 & 2032
- Figure 29: South America Demand Response Management System Market Revenue Share (%), by Country 2024 & 2032
- Figure 30: Middle East Demand Response Management System Market Revenue (Million), by System Type 2024 & 2032
- Figure 31: Middle East Demand Response Management System Market Revenue Share (%), by System Type 2024 & 2032
- Figure 32: Middle East Demand Response Management System Market Revenue (Million), by Country 2024 & 2032
- Figure 33: Middle East Demand Response Management System Market Revenue Share (%), by Country 2024 & 2032
List of Tables
- Table 1: Global Demand Response Management System Market Revenue Million Forecast, by Region 2019 & 2032
- Table 2: Global Demand Response Management System Market Revenue Million Forecast, by System Type 2019 & 2032
- Table 3: Global Demand Response Management System Market Revenue Million Forecast, by Region 2019 & 2032
- Table 4: Global Demand Response Management System Market Revenue Million Forecast, by Country 2019 & 2032
- Table 5: United States Demand Response Management System Market Revenue (Million) Forecast, by Application 2019 & 2032
- Table 6: Canada Demand Response Management System Market Revenue (Million) Forecast, by Application 2019 & 2032
- Table 7: Mexico Demand Response Management System Market Revenue (Million) Forecast, by Application 2019 & 2032
- Table 8: Global Demand Response Management System Market Revenue Million Forecast, by Country 2019 & 2032
- Table 9: Germany Demand Response Management System Market Revenue (Million) Forecast, by Application 2019 & 2032
- Table 10: United Kingdom Demand Response Management System Market Revenue (Million) Forecast, by Application 2019 & 2032
- Table 11: France Demand Response Management System Market Revenue (Million) Forecast, by Application 2019 & 2032
- Table 12: Spain Demand Response Management System Market Revenue (Million) Forecast, by Application 2019 & 2032
- Table 13: Italy Demand Response Management System Market Revenue (Million) Forecast, by Application 2019 & 2032
- Table 14: Spain Demand Response Management System Market Revenue (Million) Forecast, by Application 2019 & 2032
- Table 15: Belgium Demand Response Management System Market Revenue (Million) Forecast, by Application 2019 & 2032
- Table 16: Netherland Demand Response Management System Market Revenue (Million) Forecast, by Application 2019 & 2032
- Table 17: Nordics Demand Response Management System Market Revenue (Million) Forecast, by Application 2019 & 2032
- Table 18: Rest of Europe Demand Response Management System Market Revenue (Million) Forecast, by Application 2019 & 2032
- Table 19: Global Demand Response Management System Market Revenue Million Forecast, by Country 2019 & 2032
- Table 20: China Demand Response Management System Market Revenue (Million) Forecast, by Application 2019 & 2032
- Table 21: Japan Demand Response Management System Market Revenue (Million) Forecast, by Application 2019 & 2032
- Table 22: India Demand Response Management System Market Revenue (Million) Forecast, by Application 2019 & 2032
- Table 23: South Korea Demand Response Management System Market Revenue (Million) Forecast, by Application 2019 & 2032
- Table 24: Southeast Asia Demand Response Management System Market Revenue (Million) Forecast, by Application 2019 & 2032
- Table 25: Australia Demand Response Management System Market Revenue (Million) Forecast, by Application 2019 & 2032
- Table 26: Indonesia Demand Response Management System Market Revenue (Million) Forecast, by Application 2019 & 2032
- Table 27: Phillipes Demand Response Management System Market Revenue (Million) Forecast, by Application 2019 & 2032
- Table 28: Singapore Demand Response Management System Market Revenue (Million) Forecast, by Application 2019 & 2032
- Table 29: Thailandc Demand Response Management System Market Revenue (Million) Forecast, by Application 2019 & 2032
- Table 30: Rest of Asia Pacific Demand Response Management System Market Revenue (Million) Forecast, by Application 2019 & 2032
- Table 31: Global Demand Response Management System Market Revenue Million Forecast, by Country 2019 & 2032
- Table 32: Brazil Demand Response Management System Market Revenue (Million) Forecast, by Application 2019 & 2032
- Table 33: Argentina Demand Response Management System Market Revenue (Million) Forecast, by Application 2019 & 2032
- Table 34: Peru Demand Response Management System Market Revenue (Million) Forecast, by Application 2019 & 2032
- Table 35: Chile Demand Response Management System Market Revenue (Million) Forecast, by Application 2019 & 2032
- Table 36: Colombia Demand Response Management System Market Revenue (Million) Forecast, by Application 2019 & 2032
- Table 37: Ecuador Demand Response Management System Market Revenue (Million) Forecast, by Application 2019 & 2032
- Table 38: Venezuela Demand Response Management System Market Revenue (Million) Forecast, by Application 2019 & 2032
- Table 39: Rest of South America Demand Response Management System Market Revenue (Million) Forecast, by Application 2019 & 2032
- Table 40: Global Demand Response Management System Market Revenue Million Forecast, by Country 2019 & 2032
- Table 41: United States Demand Response Management System Market Revenue (Million) Forecast, by Application 2019 & 2032
- Table 42: Canada Demand Response Management System Market Revenue (Million) Forecast, by Application 2019 & 2032
- Table 43: Mexico Demand Response Management System Market Revenue (Million) Forecast, by Application 2019 & 2032
- Table 44: Global Demand Response Management System Market Revenue Million Forecast, by Country 2019 & 2032
- Table 45: United Arab Emirates Demand Response Management System Market Revenue (Million) Forecast, by Application 2019 & 2032
- Table 46: Saudi Arabia Demand Response Management System Market Revenue (Million) Forecast, by Application 2019 & 2032
- Table 47: South Africa Demand Response Management System Market Revenue (Million) Forecast, by Application 2019 & 2032
- Table 48: Rest of Middle East and Africa Demand Response Management System Market Revenue (Million) Forecast, by Application 2019 & 2032
- Table 49: Global Demand Response Management System Market Revenue Million Forecast, by System Type 2019 & 2032
- Table 50: Global Demand Response Management System Market Revenue Million Forecast, by Country 2019 & 2032
- Table 51: Global Demand Response Management System Market Revenue Million Forecast, by System Type 2019 & 2032
- Table 52: Global Demand Response Management System Market Revenue Million Forecast, by Country 2019 & 2032
- Table 53: Global Demand Response Management System Market Revenue Million Forecast, by System Type 2019 & 2032
- Table 54: Global Demand Response Management System Market Revenue Million Forecast, by Country 2019 & 2032
- Table 55: Global Demand Response Management System Market Revenue Million Forecast, by System Type 2019 & 2032
- Table 56: Global Demand Response Management System Market Revenue Million Forecast, by Country 2019 & 2032
- Table 57: Global Demand Response Management System Market Revenue Million Forecast, by System Type 2019 & 2032
- Table 58: Global Demand Response Management System Market Revenue Million Forecast, by Country 2019 & 2032
Frequently Asked Questions
1. What is the projected Compound Annual Growth Rate (CAGR) of the Demand Response Management System Market?
The projected CAGR is approximately > 6.80%.
2. Which companies are prominent players in the Demand Response Management System Market?
Key companies in the market include Itron Inc, Honeywell International Inc, ABB Ltd, Johnson Controls International PLC, Enel SpA*List Not Exhaustive, EnerNOC Inc, Siemens AG, Schneider Electric SE, General Electric Company, AutoGrid Systems Inc.
3. What are the main segments of the Demand Response Management System Market?
The market segments include System Type.
4. Can you provide details about the market size?
The market size is estimated to be USD XX Million as of 2022.
5. What are some drivers contributing to market growth?
4.; Increasing Integration Of Renewable Energy Generation4.; Aging Power Grids And Investments In Transmission And Distribution Infrastructure.
6. What are the notable trends driving market growth?
Automated Demand Response Management System Type to Witness Significant Growth.
7. Are there any restraints impacting market growth?
4.; Lack Of Investor Confidence Due To Sociopolitical Instability In Some Countries.
8. Can you provide examples of recent developments in the market?
In February 2022, Tata Consultancy Services (TCS) offered its suite of sustainability solutions consisting of TCS Clever Energy, Intelligent Power Plant, and TCS Envirozone to help organizations gain insights into energy usage and reduce waste and emissions. TCS Clever Energy addresses various key functions, including demand response.
9. What pricing options are available for accessing the report?
Pricing options include single-user, multi-user, and enterprise licenses priced at USD 4750, USD 5250, and USD 8750 respectively.
10. Is the market size provided in terms of value or volume?
The market size is provided in terms of value, measured in Million.
11. Are there any specific market keywords associated with the report?
Yes, the market keyword associated with the report is "Demand Response Management System Market," which aids in identifying and referencing the specific market segment covered.
12. How do I determine which pricing option suits my needs best?
The pricing options vary based on user requirements and access needs. Individual users may opt for single-user licenses, while businesses requiring broader access may choose multi-user or enterprise licenses for cost-effective access to the report.
13. Are there any additional resources or data provided in the Demand Response Management System Market report?
While the report offers comprehensive insights, it's advisable to review the specific contents or supplementary materials provided to ascertain if additional resources or data are available.
14. How can I stay updated on further developments or reports in the Demand Response Management System Market?
To stay informed about further developments, trends, and reports in the Demand Response Management System Market, consider subscribing to industry newsletters, following relevant companies and organizations, or regularly checking reputable industry news sources and publications.
Methodology
Step 1 - Identification of Relevant Samples Size from Population Database


Step 2 - Approaches for Defining Global Market Size (Value, Volume* & Price*)

Note*: In applicable scenarios
Step 3 - Data Sources
Primary Research
- Web Analytics
- Survey Reports
- Research Institute
- Latest Research Reports
- Opinion Leaders
Secondary Research
- Annual Reports
- White Paper
- Latest Press Release
- Industry Association
- Paid Database
- Investor Presentations

Step 4 - Data Triangulation
Involves using different sources of information in order to increase the validity of a study
These sources are likely to be stakeholders in a program - participants, other researchers, program staff, other community members, and so on.
Then we put all data in single framework & apply various statistical tools to find out the dynamic on the market.
During the analysis stage, feedback from the stakeholder groups would be compared to determine areas of agreement as well as areas of divergence
