

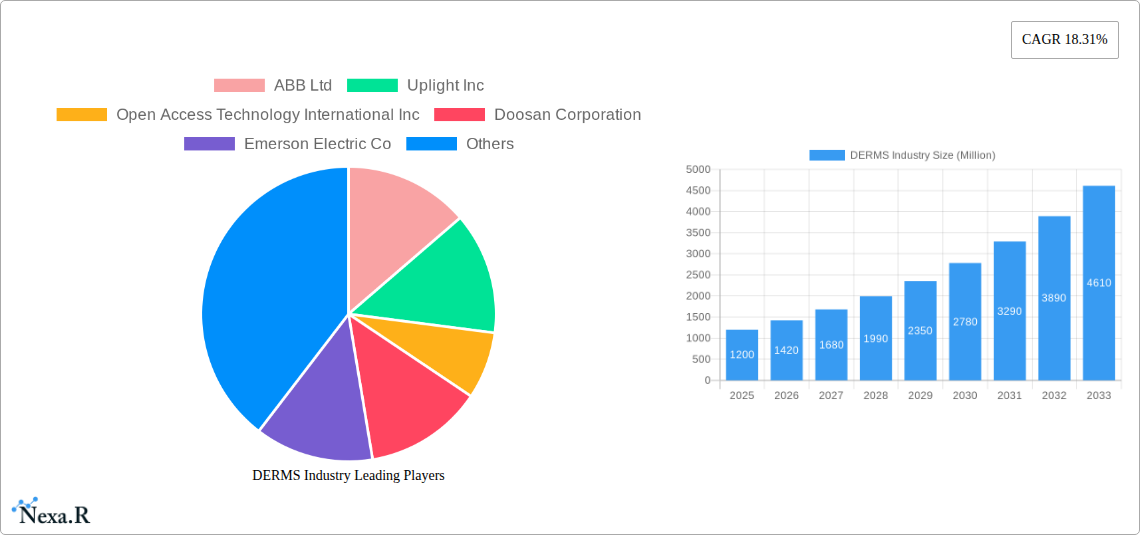
Key Insights
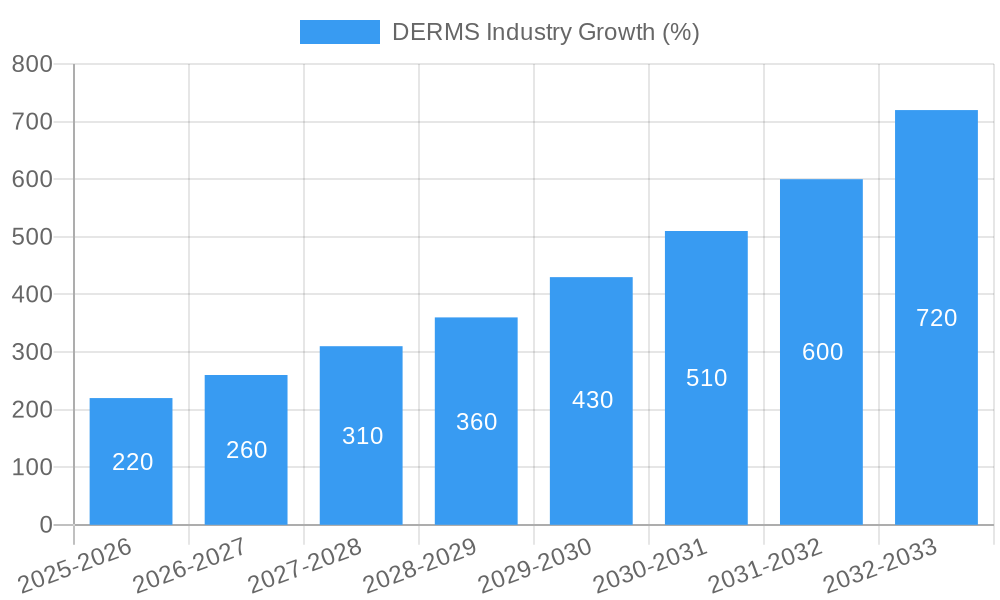
The Distributed Energy Resource Management System (DERMS) market is experiencing robust growth, projected to reach $1.20 billion in 2025 and maintain a Compound Annual Growth Rate (CAGR) of 18.31% from 2025 to 2033. This expansion is driven by several key factors. The increasing integration of renewable energy sources like solar photovoltaic (PV) and wind power necessitates sophisticated management systems to optimize energy distribution and grid stability. Furthermore, the rapid adoption of electric vehicles (EVs) and the emergence of microgrids are significantly contributing to the demand for DERMS solutions. These systems provide crucial functionalities such as real-time monitoring, forecasting, and control of distributed energy resources, ensuring efficient grid operation and minimizing disruptions. The industrial sector is a major adopter, leveraging DERMS to enhance energy efficiency and reduce operational costs. However, high initial investment costs and the complexity of integrating legacy systems with new DERMS technologies present challenges to widespread adoption. Nevertheless, ongoing technological advancements, supportive government policies promoting renewable energy integration, and increasing awareness of the benefits of smart grids are anticipated to overcome these restraints and further propel market growth.
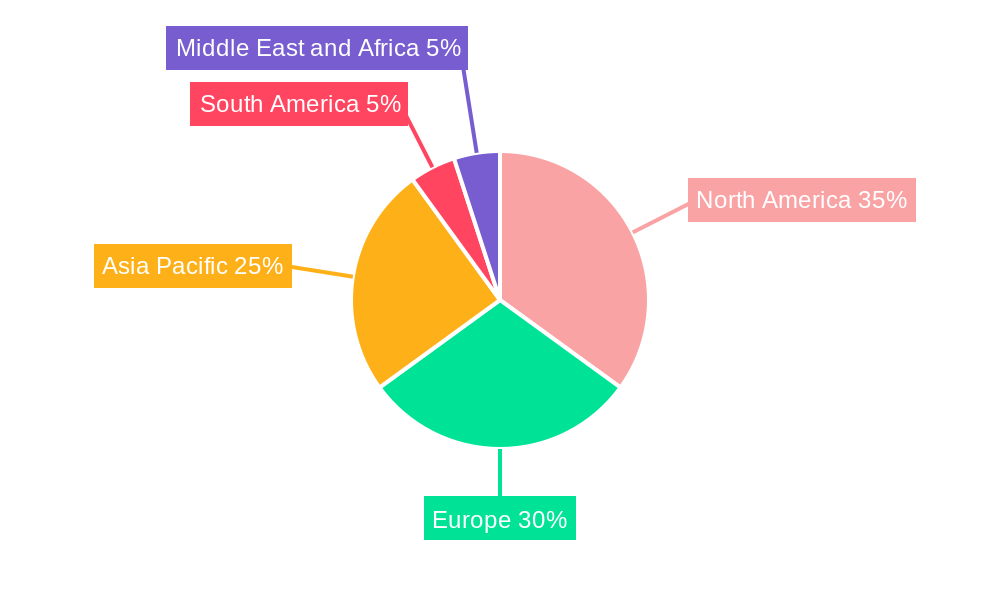
The regional breakdown reveals a strong presence in North America and Europe, driven by early adoption of smart grid technologies and robust regulatory frameworks. Asia Pacific is expected to witness significant growth in the coming years, fueled by rapid urbanization, increasing energy demands, and significant investments in renewable energy infrastructure. Key players such as ABB Ltd, Siemens AG, and Schneider Electric SE are actively shaping the market through continuous innovation and strategic partnerships. The diverse range of end-users—industrial, residential, and commercial—highlights the broad applicability of DERMS across various sectors, paving the way for sustained market expansion throughout the forecast period. The competitive landscape is characterized by both established players and emerging technology providers, fostering innovation and offering a variety of solutions to meet diverse needs.
DERMS Industry Market Report: 2019-2033
This comprehensive report provides an in-depth analysis of the Distributed Energy Resource Management System (DERMS) industry, encompassing market dynamics, growth trends, key players, and future outlook. The study period covers 2019-2033, with 2025 as the base and estimated year. We examine the parent market (renewable energy) and child markets (Solar PV, Electric Vehicles, Microgrids) to deliver a complete understanding of this rapidly evolving sector. The report is crucial for industry professionals, investors, and strategists seeking actionable insights to navigate this dynamic landscape. The total market size is expected to reach xx Million by 2033.
DERMS Industry Market Dynamics & Structure
The DERMS market is characterized by a moderately concentrated landscape, with several major players vying for market share. Technological innovation, driven by advancements in AI, machine learning, and cloud computing, is a key driver of growth. Regulatory frameworks, varying significantly across regions, play a crucial role in shaping market adoption. Competitive product substitutes, such as traditional grid management systems, present challenges, while end-user demographics, particularly the increasing adoption of renewables by industrial and commercial sectors, fuels demand. The M&A activity in the past five years, totaling approximately xx Million deals, reflects the consolidating nature of the industry.
- Market Concentration: Moderately concentrated, with top 5 players holding approximately xx% market share in 2024.
- Technological Innovation: AI, machine learning, and IoT are key drivers, enhancing grid flexibility and optimization.
- Regulatory Frameworks: Varying policies across regions impact adoption rates and investment.
- Competitive Substitutes: Traditional grid management systems pose competition.
- End-User Demographics: Industrial and commercial sectors are driving significant adoption.
- M&A Trends: Consolidation is evident, with xx major deals recorded between 2019 and 2024.
DERMS Industry Growth Trends & Insights
The DERMS market experienced significant growth during the historical period (2019-2024), driven by increasing renewable energy integration and the need for efficient grid management. The market size, valued at xx Million in 2024, is projected to expand at a Compound Annual Growth Rate (CAGR) of xx% during the forecast period (2025-2033), reaching xx Million by 2033. This growth is fueled by technological advancements, rising energy demands, and supportive government policies. Market penetration in key sectors like commercial and industrial is expected to increase significantly. Consumer behavior shifts towards sustainable energy sources further underpin the growth trajectory. The increasing adoption of Solar PV and Electric Vehicles are major contributors to the market's expansion.
Dominant Regions, Countries, or Segments in DERMS Industry
North America currently holds the largest market share in the DERMS industry, driven by strong government support for renewable energy integration and a large installed base of distributed energy resources. Within this region, the U.S. dominates due to its significant investments in grid modernization and technological advancements. The European market is also experiencing significant growth, fueled by stringent environmental regulations and increasing adoption of renewable energy technologies. Asia-Pacific is poised for rapid growth, driven by rising energy demand and significant investments in renewable energy infrastructure. Among segments, the Solar Photovoltaic (PV) and Industrial end-user segments are driving the most significant market growth, due to the increasing adoption of solar energy and the need for efficient energy management in industrial settings.
- Key Drivers:
- North America: Strong government support for renewable energy integration and grid modernization.
- Europe: Stringent environmental regulations and increasing adoption of renewable energy technologies.
- Asia-Pacific: Rising energy demand and significant investments in renewable energy infrastructure.
- Solar PV Segment: Rapid growth of solar energy installations.
- Industrial End-User: Increasing demand for efficient energy management solutions in industrial settings.
DERMS Industry Product Landscape
DERMS solutions are evolving rapidly, incorporating advanced analytics, AI, and machine learning capabilities to optimize grid operations and enhance energy efficiency. Products now offer advanced features such as real-time monitoring, predictive analytics, and automated control functionalities. Unique selling propositions increasingly focus on ease of integration, scalability, and reduced operational costs. Technological advancements are pushing towards more sophisticated solutions, including microgrid management and seamless integration with diverse DER technologies.
Key Drivers, Barriers & Challenges in DERMS Industry
Key Drivers: The increasing penetration of renewable energy sources, coupled with the growing need for efficient grid management and enhanced grid resilience, is a key driver for DERMS adoption. Government regulations and incentives promoting renewable energy integration also spur market growth. Technological advancements, particularly in AI and machine learning, enable the development of more sophisticated and efficient DERMS solutions.
Key Challenges: High initial investment costs, complex integration processes, and cybersecurity concerns pose significant barriers to wider adoption. Interoperability issues between different DER technologies and existing grid infrastructure can also hinder market growth. Furthermore, regulatory uncertainty in certain regions and a lack of skilled workforce hinder market expansion.
Emerging Opportunities in DERMS Industry
Emerging opportunities lie in the integration of DERMS with other smart grid technologies, such as smart meters and advanced metering infrastructure (AMI). The expanding adoption of electric vehicles (EVs) and the rise of microgrids present significant growth potentials. Furthermore, untapped markets in developing countries with rapidly growing energy demands offer substantial opportunities for expansion. The increasing focus on grid resilience and the need to manage extreme weather events will further drive market growth.
Growth Accelerators in the DERMS Industry Industry
Technological advancements, specifically in AI, machine learning, and cloud computing, are accelerating DERMS market growth. Strategic partnerships between DERMS vendors and utility companies are fostering wider adoption. Expansion into new geographic markets and new application domains, such as microgrid management, will boost market expansion. Moreover, increasing awareness of environmental concerns and the growing demand for sustainable energy further accelerate market growth.
Key Players Shaping the DERMS Industry Market
- ABB Ltd
- Uplight Inc
- Open Access Technology International Inc
- Doosan Corporation
- Emerson Electric Co
- Mitsubishi Electric Corporation
- Siemens AG
- Schneider Electric SE
- Oracle Corporation
- Engie SA
- General Electric Company
Notable Milestones in DERMS Industry Sector
- April 2023: Alloy.ai launches new features for demand and inventory control, impacting supply chain management within the DERMS ecosystem.
- January 2024: IEA reports a 50% increase in renewable energy capacity addition in 2023, highlighting the growing need for DERMS solutions. Solar PV accounts for a significant portion of this increase.
- February 2024: NCCETC reports 774 grid modernization actions in 2023 across the US, showing increased interest in VPPs, energy storage, and other DERMS-related initiatives.
In-Depth DERMS Industry Market Outlook
The DERMS market is poised for continued strong growth, driven by the increasing penetration of renewable energy sources, the need for enhanced grid resilience, and ongoing technological advancements. Strategic partnerships and investments in innovative solutions will further shape market dynamics. The focus on smart grid technologies, including microgrid management and the integration of EVs, presents significant opportunities for market expansion. The market’s future hinges on overcoming challenges related to interoperability, standardization, and cybersecurity to ensure seamless and efficient grid operation.
DERMS Industry Segmentation
-
1. Technology
- 1.1. Solar Photovoltaic (PV)
- 1.2. Electric Vehicles
- 1.3. Microgrids
- 1.4. Other Technologies
-
2. End User
- 2.1. Industrial
- 2.2. Residential
- 2.3. Commercial
DERMS Industry Segmentation By Geography
-
1. North America
- 1.1. United States
- 1.2. Canada
- 1.3. Rest of North America
-
2. Europe
- 2.1. Germany
- 2.2. Italy
- 2.3. France
- 2.4. United Kingdom
- 2.5. Rest of Europe
-
3. Asia Pacific
- 3.1. India
- 3.2. China
- 3.3. Japan
- 3.4. South Korea
- 3.5. Rest of Asia Pacific
-
4. South America
- 4.1. Brazil
- 4.2. Argentina
- 4.3. Rest of South America
-
5. Middle East and Africa
- 5.1. United Arab Emirates
- 5.2. Saudi Arabia
- 5.3. Saudi Arabia
- 5.4. Rest of Middle East and Africa
DERMS Industry REPORT HIGHLIGHTS
| Aspects | Details |
|---|---|
| Study Period | 2019-2033 |
| Base Year | 2024 |
| Estimated Year | 2025 |
| Forecast Period | 2025-2033 |
| Historical Period | 2019-2024 |
| Growth Rate | CAGR of 18.31% from 2019-2033 |
| Segmentation |
|
Table of Contents
- 1. Introduction
- 1.1. Research Scope
- 1.2. Market Segmentation
- 1.3. Research Methodology
- 1.4. Definitions and Assumptions
- 2. Executive Summary
- 2.1. Introduction
- 3. Market Dynamics
- 3.1. Introduction
- 3.2. Market Drivers
- 3.2.1. 4.; Increasing Shift Toward Renewables-based Distributed Power Generation4.; Rising Investments in Smart Grid
- 3.3. Market Restrains
- 3.3.1. 4.; Expansion and Upgradation of Centralized Grid
- 3.4. Market Trends
- 3.4.1. Solar Photovoltaic (PV) Segment to Dominate the Market
- 4. Market Factor Analysis
- 4.1. Porters Five Forces
- 4.2. Supply/Value Chain
- 4.3. PESTEL analysis
- 4.4. Market Entropy
- 4.5. Patent/Trademark Analysis
- 5. Global DERMS Industry Analysis, Insights and Forecast, 2019-2031
- 5.1. Market Analysis, Insights and Forecast - by Technology
- 5.1.1. Solar Photovoltaic (PV)
- 5.1.2. Electric Vehicles
- 5.1.3. Microgrids
- 5.1.4. Other Technologies
- 5.2. Market Analysis, Insights and Forecast - by End User
- 5.2.1. Industrial
- 5.2.2. Residential
- 5.2.3. Commercial
- 5.3. Market Analysis, Insights and Forecast - by Region
- 5.3.1. North America
- 5.3.2. Europe
- 5.3.3. Asia Pacific
- 5.3.4. South America
- 5.3.5. Middle East and Africa
- 5.1. Market Analysis, Insights and Forecast - by Technology
- 6. North America DERMS Industry Analysis, Insights and Forecast, 2019-2031
- 6.1. Market Analysis, Insights and Forecast - by Technology
- 6.1.1. Solar Photovoltaic (PV)
- 6.1.2. Electric Vehicles
- 6.1.3. Microgrids
- 6.1.4. Other Technologies
- 6.2. Market Analysis, Insights and Forecast - by End User
- 6.2.1. Industrial
- 6.2.2. Residential
- 6.2.3. Commercial
- 6.1. Market Analysis, Insights and Forecast - by Technology
- 7. Europe DERMS Industry Analysis, Insights and Forecast, 2019-2031
- 7.1. Market Analysis, Insights and Forecast - by Technology
- 7.1.1. Solar Photovoltaic (PV)
- 7.1.2. Electric Vehicles
- 7.1.3. Microgrids
- 7.1.4. Other Technologies
- 7.2. Market Analysis, Insights and Forecast - by End User
- 7.2.1. Industrial
- 7.2.2. Residential
- 7.2.3. Commercial
- 7.1. Market Analysis, Insights and Forecast - by Technology
- 8. Asia Pacific DERMS Industry Analysis, Insights and Forecast, 2019-2031
- 8.1. Market Analysis, Insights and Forecast - by Technology
- 8.1.1. Solar Photovoltaic (PV)
- 8.1.2. Electric Vehicles
- 8.1.3. Microgrids
- 8.1.4. Other Technologies
- 8.2. Market Analysis, Insights and Forecast - by End User
- 8.2.1. Industrial
- 8.2.2. Residential
- 8.2.3. Commercial
- 8.1. Market Analysis, Insights and Forecast - by Technology
- 9. South America DERMS Industry Analysis, Insights and Forecast, 2019-2031
- 9.1. Market Analysis, Insights and Forecast - by Technology
- 9.1.1. Solar Photovoltaic (PV)
- 9.1.2. Electric Vehicles
- 9.1.3. Microgrids
- 9.1.4. Other Technologies
- 9.2. Market Analysis, Insights and Forecast - by End User
- 9.2.1. Industrial
- 9.2.2. Residential
- 9.2.3. Commercial
- 9.1. Market Analysis, Insights and Forecast - by Technology
- 10. Middle East and Africa DERMS Industry Analysis, Insights and Forecast, 2019-2031
- 10.1. Market Analysis, Insights and Forecast - by Technology
- 10.1.1. Solar Photovoltaic (PV)
- 10.1.2. Electric Vehicles
- 10.1.3. Microgrids
- 10.1.4. Other Technologies
- 10.2. Market Analysis, Insights and Forecast - by End User
- 10.2.1. Industrial
- 10.2.2. Residential
- 10.2.3. Commercial
- 10.1. Market Analysis, Insights and Forecast - by Technology
- 11. North America DERMS Industry Analysis, Insights and Forecast, 2019-2031
- 11.1. Market Analysis, Insights and Forecast - By Country/Sub-region
- 11.1.1 United States
- 11.1.2 Canada
- 11.1.3 Rest of North America
- 12. Europe DERMS Industry Analysis, Insights and Forecast, 2019-2031
- 12.1. Market Analysis, Insights and Forecast - By Country/Sub-region
- 12.1.1 Germany
- 12.1.2 Italy
- 12.1.3 France
- 12.1.4 United Kingdom
- 12.1.5 Rest of Europe
- 13. Asia Pacific DERMS Industry Analysis, Insights and Forecast, 2019-2031
- 13.1. Market Analysis, Insights and Forecast - By Country/Sub-region
- 13.1.1 India
- 13.1.2 China
- 13.1.3 Japan
- 13.1.4 South Korea
- 13.1.5 Rest of Asia Pacific
- 14. South America DERMS Industry Analysis, Insights and Forecast, 2019-2031
- 14.1. Market Analysis, Insights and Forecast - By Country/Sub-region
- 14.1.1 Brazil
- 14.1.2 Argentina
- 14.1.3 Rest of South America
- 15. Middle East and Africa DERMS Industry Analysis, Insights and Forecast, 2019-2031
- 15.1. Market Analysis, Insights and Forecast - By Country/Sub-region
- 15.1.1 United Arab Emirates
- 15.1.2 Saudi Arabia
- 15.1.3 Saudi Arabia
- 15.1.4 Rest of Middle East and Africa
- 16. Competitive Analysis
- 16.1. Global Market Share Analysis 2024
- 16.2. Company Profiles
- 16.2.1 ABB Ltd
- 16.2.1.1. Overview
- 16.2.1.2. Products
- 16.2.1.3. SWOT Analysis
- 16.2.1.4. Recent Developments
- 16.2.1.5. Financials (Based on Availability)
- 16.2.2 Uplight Inc
- 16.2.2.1. Overview
- 16.2.2.2. Products
- 16.2.2.3. SWOT Analysis
- 16.2.2.4. Recent Developments
- 16.2.2.5. Financials (Based on Availability)
- 16.2.3 Open Access Technology International Inc
- 16.2.3.1. Overview
- 16.2.3.2. Products
- 16.2.3.3. SWOT Analysis
- 16.2.3.4. Recent Developments
- 16.2.3.5. Financials (Based on Availability)
- 16.2.4 Doosan Corporation
- 16.2.4.1. Overview
- 16.2.4.2. Products
- 16.2.4.3. SWOT Analysis
- 16.2.4.4. Recent Developments
- 16.2.4.5. Financials (Based on Availability)
- 16.2.5 Emerson Electric Co
- 16.2.5.1. Overview
- 16.2.5.2. Products
- 16.2.5.3. SWOT Analysis
- 16.2.5.4. Recent Developments
- 16.2.5.5. Financials (Based on Availability)
- 16.2.6 Mitsubishi Electric Corporation
- 16.2.6.1. Overview
- 16.2.6.2. Products
- 16.2.6.3. SWOT Analysis
- 16.2.6.4. Recent Developments
- 16.2.6.5. Financials (Based on Availability)
- 16.2.7 Siemens AG
- 16.2.7.1. Overview
- 16.2.7.2. Products
- 16.2.7.3. SWOT Analysis
- 16.2.7.4. Recent Developments
- 16.2.7.5. Financials (Based on Availability)
- 16.2.8 Schneider Electric SE
- 16.2.8.1. Overview
- 16.2.8.2. Products
- 16.2.8.3. SWOT Analysis
- 16.2.8.4. Recent Developments
- 16.2.8.5. Financials (Based on Availability)
- 16.2.9 Oracle Corporation
- 16.2.9.1. Overview
- 16.2.9.2. Products
- 16.2.9.3. SWOT Analysis
- 16.2.9.4. Recent Developments
- 16.2.9.5. Financials (Based on Availability)
- 16.2.10 Engie SA
- 16.2.10.1. Overview
- 16.2.10.2. Products
- 16.2.10.3. SWOT Analysis
- 16.2.10.4. Recent Developments
- 16.2.10.5. Financials (Based on Availability)
- 16.2.11 General Electric Company
- 16.2.11.1. Overview
- 16.2.11.2. Products
- 16.2.11.3. SWOT Analysis
- 16.2.11.4. Recent Developments
- 16.2.11.5. Financials (Based on Availability)
- 16.2.1 ABB Ltd
List of Figures
- Figure 1: Global DERMS Industry Revenue Breakdown (Million, %) by Region 2024 & 2032
- Figure 2: North America DERMS Industry Revenue (Million), by Country 2024 & 2032
- Figure 3: North America DERMS Industry Revenue Share (%), by Country 2024 & 2032
- Figure 4: Europe DERMS Industry Revenue (Million), by Country 2024 & 2032
- Figure 5: Europe DERMS Industry Revenue Share (%), by Country 2024 & 2032
- Figure 6: Asia Pacific DERMS Industry Revenue (Million), by Country 2024 & 2032
- Figure 7: Asia Pacific DERMS Industry Revenue Share (%), by Country 2024 & 2032
- Figure 8: South America DERMS Industry Revenue (Million), by Country 2024 & 2032
- Figure 9: South America DERMS Industry Revenue Share (%), by Country 2024 & 2032
- Figure 10: Middle East and Africa DERMS Industry Revenue (Million), by Country 2024 & 2032
- Figure 11: Middle East and Africa DERMS Industry Revenue Share (%), by Country 2024 & 2032
- Figure 12: North America DERMS Industry Revenue (Million), by Technology 2024 & 2032
- Figure 13: North America DERMS Industry Revenue Share (%), by Technology 2024 & 2032
- Figure 14: North America DERMS Industry Revenue (Million), by End User 2024 & 2032
- Figure 15: North America DERMS Industry Revenue Share (%), by End User 2024 & 2032
- Figure 16: North America DERMS Industry Revenue (Million), by Country 2024 & 2032
- Figure 17: North America DERMS Industry Revenue Share (%), by Country 2024 & 2032
- Figure 18: Europe DERMS Industry Revenue (Million), by Technology 2024 & 2032
- Figure 19: Europe DERMS Industry Revenue Share (%), by Technology 2024 & 2032
- Figure 20: Europe DERMS Industry Revenue (Million), by End User 2024 & 2032
- Figure 21: Europe DERMS Industry Revenue Share (%), by End User 2024 & 2032
- Figure 22: Europe DERMS Industry Revenue (Million), by Country 2024 & 2032
- Figure 23: Europe DERMS Industry Revenue Share (%), by Country 2024 & 2032
- Figure 24: Asia Pacific DERMS Industry Revenue (Million), by Technology 2024 & 2032
- Figure 25: Asia Pacific DERMS Industry Revenue Share (%), by Technology 2024 & 2032
- Figure 26: Asia Pacific DERMS Industry Revenue (Million), by End User 2024 & 2032
- Figure 27: Asia Pacific DERMS Industry Revenue Share (%), by End User 2024 & 2032
- Figure 28: Asia Pacific DERMS Industry Revenue (Million), by Country 2024 & 2032
- Figure 29: Asia Pacific DERMS Industry Revenue Share (%), by Country 2024 & 2032
- Figure 30: South America DERMS Industry Revenue (Million), by Technology 2024 & 2032
- Figure 31: South America DERMS Industry Revenue Share (%), by Technology 2024 & 2032
- Figure 32: South America DERMS Industry Revenue (Million), by End User 2024 & 2032
- Figure 33: South America DERMS Industry Revenue Share (%), by End User 2024 & 2032
- Figure 34: South America DERMS Industry Revenue (Million), by Country 2024 & 2032
- Figure 35: South America DERMS Industry Revenue Share (%), by Country 2024 & 2032
- Figure 36: Middle East and Africa DERMS Industry Revenue (Million), by Technology 2024 & 2032
- Figure 37: Middle East and Africa DERMS Industry Revenue Share (%), by Technology 2024 & 2032
- Figure 38: Middle East and Africa DERMS Industry Revenue (Million), by End User 2024 & 2032
- Figure 39: Middle East and Africa DERMS Industry Revenue Share (%), by End User 2024 & 2032
- Figure 40: Middle East and Africa DERMS Industry Revenue (Million), by Country 2024 & 2032
- Figure 41: Middle East and Africa DERMS Industry Revenue Share (%), by Country 2024 & 2032
List of Tables
- Table 1: Global DERMS Industry Revenue Million Forecast, by Region 2019 & 2032
- Table 2: Global DERMS Industry Revenue Million Forecast, by Technology 2019 & 2032
- Table 3: Global DERMS Industry Revenue Million Forecast, by End User 2019 & 2032
- Table 4: Global DERMS Industry Revenue Million Forecast, by Region 2019 & 2032
- Table 5: Global DERMS Industry Revenue Million Forecast, by Country 2019 & 2032
- Table 6: United States DERMS Industry Revenue (Million) Forecast, by Application 2019 & 2032
- Table 7: Canada DERMS Industry Revenue (Million) Forecast, by Application 2019 & 2032
- Table 8: Rest of North America DERMS Industry Revenue (Million) Forecast, by Application 2019 & 2032
- Table 9: Global DERMS Industry Revenue Million Forecast, by Country 2019 & 2032
- Table 10: Germany DERMS Industry Revenue (Million) Forecast, by Application 2019 & 2032
- Table 11: Italy DERMS Industry Revenue (Million) Forecast, by Application 2019 & 2032
- Table 12: France DERMS Industry Revenue (Million) Forecast, by Application 2019 & 2032
- Table 13: United Kingdom DERMS Industry Revenue (Million) Forecast, by Application 2019 & 2032
- Table 14: Rest of Europe DERMS Industry Revenue (Million) Forecast, by Application 2019 & 2032
- Table 15: Global DERMS Industry Revenue Million Forecast, by Country 2019 & 2032
- Table 16: India DERMS Industry Revenue (Million) Forecast, by Application 2019 & 2032
- Table 17: China DERMS Industry Revenue (Million) Forecast, by Application 2019 & 2032
- Table 18: Japan DERMS Industry Revenue (Million) Forecast, by Application 2019 & 2032
- Table 19: South Korea DERMS Industry Revenue (Million) Forecast, by Application 2019 & 2032
- Table 20: Rest of Asia Pacific DERMS Industry Revenue (Million) Forecast, by Application 2019 & 2032
- Table 21: Global DERMS Industry Revenue Million Forecast, by Country 2019 & 2032
- Table 22: Brazil DERMS Industry Revenue (Million) Forecast, by Application 2019 & 2032
- Table 23: Argentina DERMS Industry Revenue (Million) Forecast, by Application 2019 & 2032
- Table 24: Rest of South America DERMS Industry Revenue (Million) Forecast, by Application 2019 & 2032
- Table 25: Global DERMS Industry Revenue Million Forecast, by Country 2019 & 2032
- Table 26: United Arab Emirates DERMS Industry Revenue (Million) Forecast, by Application 2019 & 2032
- Table 27: Saudi Arabia DERMS Industry Revenue (Million) Forecast, by Application 2019 & 2032
- Table 28: Saudi Arabia DERMS Industry Revenue (Million) Forecast, by Application 2019 & 2032
- Table 29: Rest of Middle East and Africa DERMS Industry Revenue (Million) Forecast, by Application 2019 & 2032
- Table 30: Global DERMS Industry Revenue Million Forecast, by Technology 2019 & 2032
- Table 31: Global DERMS Industry Revenue Million Forecast, by End User 2019 & 2032
- Table 32: Global DERMS Industry Revenue Million Forecast, by Country 2019 & 2032
- Table 33: United States DERMS Industry Revenue (Million) Forecast, by Application 2019 & 2032
- Table 34: Canada DERMS Industry Revenue (Million) Forecast, by Application 2019 & 2032
- Table 35: Rest of North America DERMS Industry Revenue (Million) Forecast, by Application 2019 & 2032
- Table 36: Global DERMS Industry Revenue Million Forecast, by Technology 2019 & 2032
- Table 37: Global DERMS Industry Revenue Million Forecast, by End User 2019 & 2032
- Table 38: Global DERMS Industry Revenue Million Forecast, by Country 2019 & 2032
- Table 39: Germany DERMS Industry Revenue (Million) Forecast, by Application 2019 & 2032
- Table 40: Italy DERMS Industry Revenue (Million) Forecast, by Application 2019 & 2032
- Table 41: France DERMS Industry Revenue (Million) Forecast, by Application 2019 & 2032
- Table 42: United Kingdom DERMS Industry Revenue (Million) Forecast, by Application 2019 & 2032
- Table 43: Rest of Europe DERMS Industry Revenue (Million) Forecast, by Application 2019 & 2032
- Table 44: Global DERMS Industry Revenue Million Forecast, by Technology 2019 & 2032
- Table 45: Global DERMS Industry Revenue Million Forecast, by End User 2019 & 2032
- Table 46: Global DERMS Industry Revenue Million Forecast, by Country 2019 & 2032
- Table 47: India DERMS Industry Revenue (Million) Forecast, by Application 2019 & 2032
- Table 48: China DERMS Industry Revenue (Million) Forecast, by Application 2019 & 2032
- Table 49: Japan DERMS Industry Revenue (Million) Forecast, by Application 2019 & 2032
- Table 50: South Korea DERMS Industry Revenue (Million) Forecast, by Application 2019 & 2032
- Table 51: Rest of Asia Pacific DERMS Industry Revenue (Million) Forecast, by Application 2019 & 2032
- Table 52: Global DERMS Industry Revenue Million Forecast, by Technology 2019 & 2032
- Table 53: Global DERMS Industry Revenue Million Forecast, by End User 2019 & 2032
- Table 54: Global DERMS Industry Revenue Million Forecast, by Country 2019 & 2032
- Table 55: Brazil DERMS Industry Revenue (Million) Forecast, by Application 2019 & 2032
- Table 56: Argentina DERMS Industry Revenue (Million) Forecast, by Application 2019 & 2032
- Table 57: Rest of South America DERMS Industry Revenue (Million) Forecast, by Application 2019 & 2032
- Table 58: Global DERMS Industry Revenue Million Forecast, by Technology 2019 & 2032
- Table 59: Global DERMS Industry Revenue Million Forecast, by End User 2019 & 2032
- Table 60: Global DERMS Industry Revenue Million Forecast, by Country 2019 & 2032
- Table 61: United Arab Emirates DERMS Industry Revenue (Million) Forecast, by Application 2019 & 2032
- Table 62: Saudi Arabia DERMS Industry Revenue (Million) Forecast, by Application 2019 & 2032
- Table 63: Saudi Arabia DERMS Industry Revenue (Million) Forecast, by Application 2019 & 2032
- Table 64: Rest of Middle East and Africa DERMS Industry Revenue (Million) Forecast, by Application 2019 & 2032
Frequently Asked Questions
1. What is the projected Compound Annual Growth Rate (CAGR) of the DERMS Industry?
The projected CAGR is approximately 18.31%.
2. Which companies are prominent players in the DERMS Industry?
Key companies in the market include ABB Ltd, Uplight Inc, Open Access Technology International Inc, Doosan Corporation, Emerson Electric Co, Mitsubishi Electric Corporation, Siemens AG, Schneider Electric SE, Oracle Corporation, Engie SA, General Electric Company.
3. What are the main segments of the DERMS Industry?
The market segments include Technology, End User.
4. Can you provide details about the market size?
The market size is estimated to be USD 1.20 Million as of 2022.
5. What are some drivers contributing to market growth?
4.; Increasing Shift Toward Renewables-based Distributed Power Generation4.; Rising Investments in Smart Grid.
6. What are the notable trends driving market growth?
Solar Photovoltaic (PV) Segment to Dominate the Market.
7. Are there any restraints impacting market growth?
4.; Expansion and Upgradation of Centralized Grid.
8. Can you provide examples of recent developments in the market?
February 2024: According to the N.C. Clean Energy Technology Center (NCCETC), a total of 774 grid modernization actions were taken in more than fifty states in 2023. The top trend in grid modernization includes the growing interest in virtual power plants, cost recovery for interconnection upgrades, examining the impacts of wholesale market participation, studying long-duration energy storage, utilities proposing new performance incentive mechanisms, undertaking grid resilience planning, utilities pursuing pilot programs and projects, utilizing green button standards for access to customer energy usage data, providing customers with demand response incentive opportunities, and utilities exploring opt-out time-varying rates.
9. What pricing options are available for accessing the report?
Pricing options include single-user, multi-user, and enterprise licenses priced at USD 4750, USD 5250, and USD 8750 respectively.
10. Is the market size provided in terms of value or volume?
The market size is provided in terms of value, measured in Million.
11. Are there any specific market keywords associated with the report?
Yes, the market keyword associated with the report is "DERMS Industry," which aids in identifying and referencing the specific market segment covered.
12. How do I determine which pricing option suits my needs best?
The pricing options vary based on user requirements and access needs. Individual users may opt for single-user licenses, while businesses requiring broader access may choose multi-user or enterprise licenses for cost-effective access to the report.
13. Are there any additional resources or data provided in the DERMS Industry report?
While the report offers comprehensive insights, it's advisable to review the specific contents or supplementary materials provided to ascertain if additional resources or data are available.
14. How can I stay updated on further developments or reports in the DERMS Industry?
To stay informed about further developments, trends, and reports in the DERMS Industry, consider subscribing to industry newsletters, following relevant companies and organizations, or regularly checking reputable industry news sources and publications.
Methodology
Step 1 - Identification of Relevant Samples Size from Population Database


Step 2 - Approaches for Defining Global Market Size (Value, Volume* & Price*)

Note*: In applicable scenarios
Step 3 - Data Sources
Primary Research
- Web Analytics
- Survey Reports
- Research Institute
- Latest Research Reports
- Opinion Leaders
Secondary Research
- Annual Reports
- White Paper
- Latest Press Release
- Industry Association
- Paid Database
- Investor Presentations

Step 4 - Data Triangulation
Involves using different sources of information in order to increase the validity of a study
These sources are likely to be stakeholders in a program - participants, other researchers, program staff, other community members, and so on.
Then we put all data in single framework & apply various statistical tools to find out the dynamic on the market.
During the analysis stage, feedback from the stakeholder groups would be compared to determine areas of agreement as well as areas of divergence
