

Key Insights
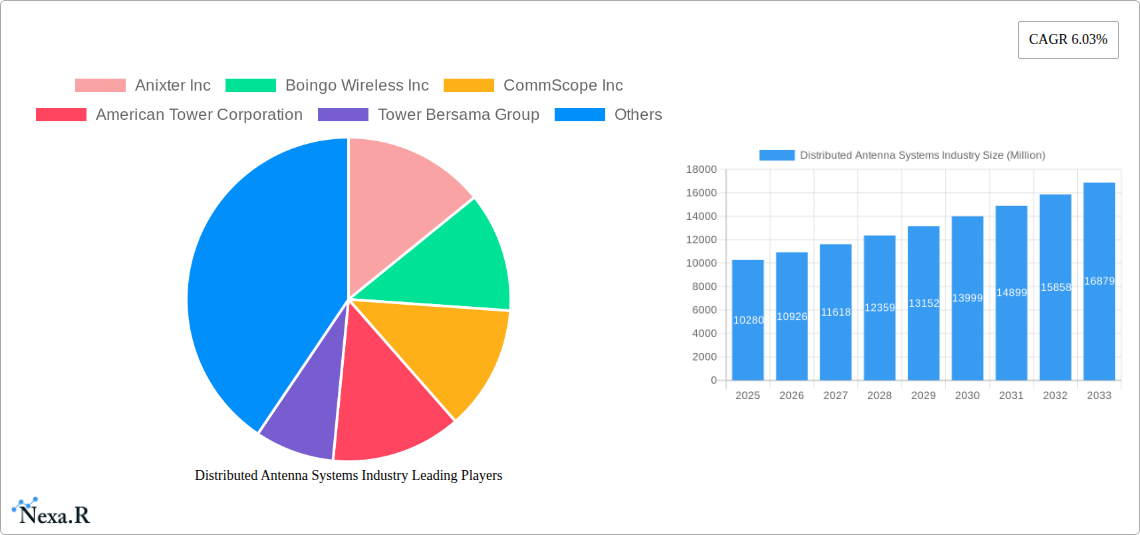
The Distributed Antenna Systems (DAS) market is experiencing robust growth, projected to reach a market size of $10.28 billion in 2025, exhibiting a Compound Annual Growth Rate (CAGR) of 6.03%. This expansion is driven by several key factors. The increasing demand for high-quality cellular connectivity in dense urban areas and venues like stadiums and transportation hubs fuels the adoption of DAS solutions. Furthermore, the growing need for reliable communication infrastructure in public safety applications, particularly for first responders, is a significant driver. Technological advancements, including the development of more efficient and cost-effective active and digital DAS technologies, further contribute to market growth. The shift towards 5G and the Internet of Things (IoT) is also bolstering demand, as DAS networks are crucial for ensuring sufficient network capacity and coverage in these emerging technologies. Segmentation analysis reveals a strong presence across various applications (enterprise, public safety, others), types (active, passive, digital, hybrid), and end-users (manufacturing, healthcare, government, etc.), indicating a diverse and expanding market landscape.
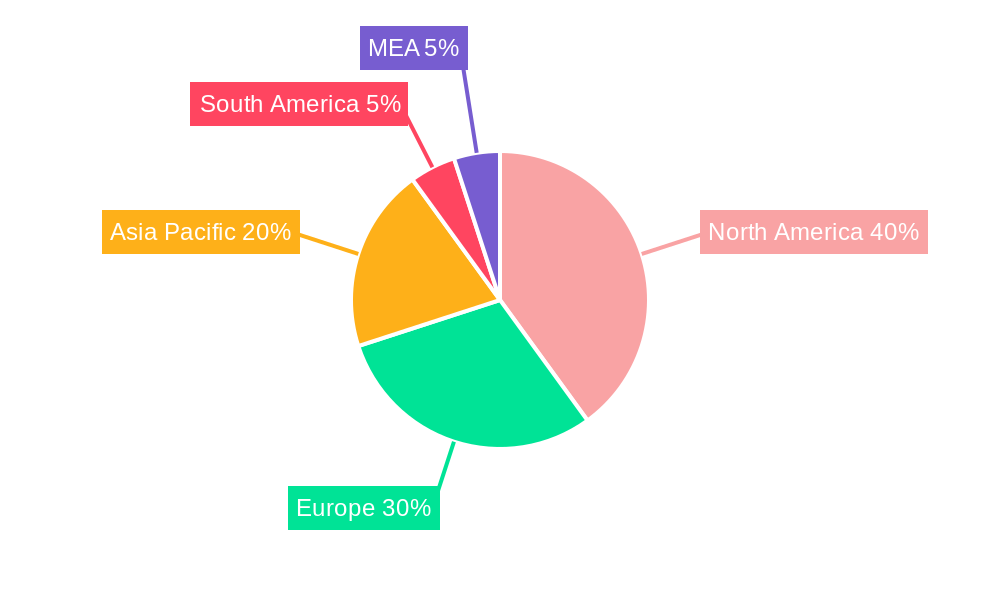
Significant regional variations exist within the DAS market. North America, particularly the United States, is expected to maintain a leading market share due to early adoption of advanced technologies and a strong focus on infrastructure development. However, rapid growth is anticipated in the Asia-Pacific region, driven by expanding urban populations, increasing smartphone penetration, and significant investments in 5G network infrastructure. Europe will also witness substantial growth, fueled by government initiatives to enhance communication infrastructure and increased private sector investments. While challenges such as high initial deployment costs and regulatory hurdles might act as restraints, the overall market outlook for DAS remains positive, promising substantial growth opportunities for industry players over the forecast period (2025-2033). The competition among established players like Anixter, Boingo Wireless, CommScope, and emerging companies will further shape market dynamics and drive innovation in DAS technologies and deployments.
Distributed Antenna Systems (DAS) Industry Market Report: 2019-2033
This comprehensive report provides an in-depth analysis of the Distributed Antenna Systems (DAS) industry, covering market dynamics, growth trends, regional dominance, product landscape, key players, and future outlook. The study period spans from 2019 to 2033, with 2025 serving as the base and estimated year. The report segments the market by application (Enterprise DAS, Public Safety DAS, Other Applications), type (Active, Passive, Digital, Hybrid), and end-user (Manufacturing, Healthcare, Government, Transportation, Sports & Entertainment, Telecommunications, Other End-Users). The total market size in 2025 is estimated at xx Million.
Distributed Antenna Systems Industry Market Dynamics & Structure
This section analyzes the competitive landscape, technological advancements, regulatory influences, and market trends within the DAS industry. The market is characterized by a moderate level of concentration, with key players holding significant market share. However, the entry of new players and technological innovations are constantly reshaping the competitive dynamics. The market size for 2025 is estimated at xx Million, with a projected CAGR of xx% during the forecast period (2025-2033).
- Market Concentration: The top 5 players account for approximately xx% of the global market share in 2025.
- Technological Innovation: 5G deployment and the increasing demand for improved indoor coverage are major drivers of innovation in DAS technologies.
- Regulatory Framework: Government regulations related to spectrum allocation and infrastructure deployment influence market growth.
- Competitive Substitutes: Fiber optics and other wireless technologies present some level of competitive substitution.
- End-User Demographics: The growth is fueled by the increasing adoption of DAS across various end-user segments, particularly in dense urban areas.
- M&A Trends: The number of M&A deals in the DAS sector averaged xx per year during the historical period (2019-2024).
Distributed Antenna Systems Industry Growth Trends & Insights
The DAS market experienced significant growth during the historical period (2019-2024), driven primarily by the increasing demand for high-speed mobile broadband and improved indoor coverage. The market size expanded from xx Million in 2019 to xx Million in 2024, reflecting a CAGR of xx%. This growth is projected to continue during the forecast period, with the market expected to reach xx Million by 2033, driven by factors such as the widespread adoption of 5G, increasing urbanization, and the growing demand for reliable connectivity across diverse sectors. The market penetration rate in 2025 is estimated at xx%. Technological advancements like the development of more efficient and cost-effective DAS solutions further accelerate market growth. Consumer behavior is shifting towards greater demand for seamless connectivity, which fuels the demand for improved indoor wireless coverage.

Dominant Regions, Countries, or Segments in Distributed Antenna Systems Industry
North America currently holds the largest market share in the DAS industry, followed by Europe and Asia-Pacific. Within application segments, Enterprise DAS and Public Safety DAS are the most prominent drivers, fueled by the need for reliable and secure communication in various settings.
- North America: High adoption rates in densely populated urban areas and robust investments in 5G infrastructure drive strong growth.
- Europe: Government initiatives promoting digital infrastructure and growing adoption in commercial buildings contribute to market expansion.
- Asia-Pacific: Rapid urbanization, increasing smartphone penetration, and expanding telecommunication networks fuel significant growth potential.
- Dominant Segment (Application): Enterprise DAS accounts for the largest market share due to high demand for reliable communication in office buildings, shopping malls, and other commercial spaces.
- Dominant Segment (Type): Active DAS dominates the market due to its ability to provide higher signal quality and better coverage compared to passive systems.
Distributed Antenna Systems Industry Product Landscape
The DAS market offers a wide range of products, including active, passive, digital, and hybrid systems. Recent innovations focus on enhancing signal strength, improving network capacity, and reducing installation costs. These advancements include miniaturized antennas, software-defined radios, and remote monitoring capabilities, resulting in improved performance, flexibility, and ease of deployment. The market is witnessing the increasing adoption of 5G-ready DAS solutions that support higher bandwidth and faster data speeds.
Key Drivers, Barriers & Challenges in Distributed Antenna Systems Industry
Key Drivers:
- The rising demand for high-speed mobile broadband and improved indoor coverage.
- The proliferation of 5G networks.
- Increasing investments in infrastructure development.
- Government initiatives promoting digital transformation.
Challenges and Restraints:
- High initial installation costs can limit adoption in some markets.
- Regulatory hurdles and spectrum allocation issues can create implementation barriers.
- Competition from other wireless technologies and solutions might limit market growth. The estimated impact of these factors is a reduction in market growth by approximately xx% in 2025.
Emerging Opportunities in Distributed Antenna Systems Industry
The DAS industry presents several promising opportunities:
- Expansion into untapped markets in developing countries.
- Development of innovative DAS solutions tailored to specific vertical markets (e.g., smart cities, transportation).
- Growing demand for private LTE/5G networks in various industries.
- Integration of DAS with other technologies such as IoT and AI.
Growth Accelerators in the Distributed Antenna Systems Industry
Technological breakthroughs, strategic alliances between DAS providers and telecommunication operators, and government policies supporting the deployment of 5G networks are key catalysts for long-term growth. Market expansion into new geographical regions and vertical industries will further fuel this growth.
Key Players Shaping the Distributed Antenna Systems Industry Market
- Anixter Inc
- Boingo Wireless Inc
- CommScope Inc
- American Tower Corporation
- Tower Bersama Group
- Corning Inc
- TE Connectivity Ltd
- Comba Telecom Systems Holdings Ltd
- Antenna Products Corporation
- Cobham PLC
- SOLiD Inc
Notable Milestones in Distributed Antenna Systems Industry Sector
- July 2023: American Tower Corporation and Xcel Energy Center announced a 5G DAS deployment at the arena.
- October 2022: PROSE Technologies launched a new Active DAS system for 5G networks in India.
In-Depth Distributed Antenna Systems Industry Market Outlook
The DAS market is poised for sustained growth in the coming years, driven by the ongoing expansion of 5G networks, increasing demand for improved indoor connectivity, and the emergence of new applications in diverse sectors. Strategic partnerships, technological innovation, and government support will play a vital role in shaping the future of this dynamic market. The market is expected to reach xx Million by 2033, presenting significant opportunities for both established players and new entrants.
Distributed Antenna Systems Industry Segmentation
-
1. Type
- 1.1. Active
- 1.2. Passive
- 1.3. Digital
- 1.4. Hybrid
-
2. End-User
- 2.1. Manufacturing
- 2.2. Healthcare
- 2.3. Government
- 2.4. Transportation
- 2.5. Sports and Entertainment
- 2.6. Telecommunications
- 2.7. Other End-Users
-
3. Application
- 3.1. Enterprise DAS
- 3.2. Public Safety DAS
- 3.3. Other Applications
Distributed Antenna Systems Industry Segmentation By Geography
- 1. North America
- 2. Europe
- 3. Asia
- 4. Australia and New Zealand
- 5. Latin America
- 6. Middle East and Africa
Distributed Antenna Systems Industry REPORT HIGHLIGHTS
| Aspects | Details |
|---|---|
| Study Period | 2019-2033 |
| Base Year | 2024 |
| Estimated Year | 2025 |
| Forecast Period | 2025-2033 |
| Historical Period | 2019-2024 |
| Growth Rate | CAGR of 6.03% from 2019-2033 |
| Segmentation |
|
Table of Contents
- 1. Introduction
- 1.1. Research Scope
- 1.2. Market Segmentation
- 1.3. Research Methodology
- 1.4. Definitions and Assumptions
- 2. Executive Summary
- 2.1. Introduction
- 3. Market Dynamics
- 3.1. Introduction
- 3.2. Market Drivers
- 3.2.1. DAS Ability to Support Multiple Telecom Carriers and Upcoming Technologies
- 3.3. Market Restrains
- 3.3.1. Lack of Awareness About Intellectual Property Outsourcing
- 3.4. Market Trends
- 3.4.1. Sport and Entertainment Segment to Hold a Significant Market Share
- 4. Market Factor Analysis
- 4.1. Porters Five Forces
- 4.2. Supply/Value Chain
- 4.3. PESTEL analysis
- 4.4. Market Entropy
- 4.5. Patent/Trademark Analysis
- 5. Global Distributed Antenna Systems Industry Analysis, Insights and Forecast, 2019-2031
- 5.1. Market Analysis, Insights and Forecast - by Type
- 5.1.1. Active
- 5.1.2. Passive
- 5.1.3. Digital
- 5.1.4. Hybrid
- 5.2. Market Analysis, Insights and Forecast - by End-User
- 5.2.1. Manufacturing
- 5.2.2. Healthcare
- 5.2.3. Government
- 5.2.4. Transportation
- 5.2.5. Sports and Entertainment
- 5.2.6. Telecommunications
- 5.2.7. Other End-Users
- 5.3. Market Analysis, Insights and Forecast - by Application
- 5.3.1. Enterprise DAS
- 5.3.2. Public Safety DAS
- 5.3.3. Other Applications
- 5.4. Market Analysis, Insights and Forecast - by Region
- 5.4.1. North America
- 5.4.2. Europe
- 5.4.3. Asia
- 5.4.4. Australia and New Zealand
- 5.4.5. Latin America
- 5.4.6. Middle East and Africa
- 5.1. Market Analysis, Insights and Forecast - by Type
- 6. North America Distributed Antenna Systems Industry Analysis, Insights and Forecast, 2019-2031
- 6.1. Market Analysis, Insights and Forecast - by Type
- 6.1.1. Active
- 6.1.2. Passive
- 6.1.3. Digital
- 6.1.4. Hybrid
- 6.2. Market Analysis, Insights and Forecast - by End-User
- 6.2.1. Manufacturing
- 6.2.2. Healthcare
- 6.2.3. Government
- 6.2.4. Transportation
- 6.2.5. Sports and Entertainment
- 6.2.6. Telecommunications
- 6.2.7. Other End-Users
- 6.3. Market Analysis, Insights and Forecast - by Application
- 6.3.1. Enterprise DAS
- 6.3.2. Public Safety DAS
- 6.3.3. Other Applications
- 6.1. Market Analysis, Insights and Forecast - by Type
- 7. Europe Distributed Antenna Systems Industry Analysis, Insights and Forecast, 2019-2031
- 7.1. Market Analysis, Insights and Forecast - by Type
- 7.1.1. Active
- 7.1.2. Passive
- 7.1.3. Digital
- 7.1.4. Hybrid
- 7.2. Market Analysis, Insights and Forecast - by End-User
- 7.2.1. Manufacturing
- 7.2.2. Healthcare
- 7.2.3. Government
- 7.2.4. Transportation
- 7.2.5. Sports and Entertainment
- 7.2.6. Telecommunications
- 7.2.7. Other End-Users
- 7.3. Market Analysis, Insights and Forecast - by Application
- 7.3.1. Enterprise DAS
- 7.3.2. Public Safety DAS
- 7.3.3. Other Applications
- 7.1. Market Analysis, Insights and Forecast - by Type
- 8. Asia Distributed Antenna Systems Industry Analysis, Insights and Forecast, 2019-2031
- 8.1. Market Analysis, Insights and Forecast - by Type
- 8.1.1. Active
- 8.1.2. Passive
- 8.1.3. Digital
- 8.1.4. Hybrid
- 8.2. Market Analysis, Insights and Forecast - by End-User
- 8.2.1. Manufacturing
- 8.2.2. Healthcare
- 8.2.3. Government
- 8.2.4. Transportation
- 8.2.5. Sports and Entertainment
- 8.2.6. Telecommunications
- 8.2.7. Other End-Users
- 8.3. Market Analysis, Insights and Forecast - by Application
- 8.3.1. Enterprise DAS
- 8.3.2. Public Safety DAS
- 8.3.3. Other Applications
- 8.1. Market Analysis, Insights and Forecast - by Type
- 9. Australia and New Zealand Distributed Antenna Systems Industry Analysis, Insights and Forecast, 2019-2031
- 9.1. Market Analysis, Insights and Forecast - by Type
- 9.1.1. Active
- 9.1.2. Passive
- 9.1.3. Digital
- 9.1.4. Hybrid
- 9.2. Market Analysis, Insights and Forecast - by End-User
- 9.2.1. Manufacturing
- 9.2.2. Healthcare
- 9.2.3. Government
- 9.2.4. Transportation
- 9.2.5. Sports and Entertainment
- 9.2.6. Telecommunications
- 9.2.7. Other End-Users
- 9.3. Market Analysis, Insights and Forecast - by Application
- 9.3.1. Enterprise DAS
- 9.3.2. Public Safety DAS
- 9.3.3. Other Applications
- 9.1. Market Analysis, Insights and Forecast - by Type
- 10. Latin America Distributed Antenna Systems Industry Analysis, Insights and Forecast, 2019-2031
- 10.1. Market Analysis, Insights and Forecast - by Type
- 10.1.1. Active
- 10.1.2. Passive
- 10.1.3. Digital
- 10.1.4. Hybrid
- 10.2. Market Analysis, Insights and Forecast - by End-User
- 10.2.1. Manufacturing
- 10.2.2. Healthcare
- 10.2.3. Government
- 10.2.4. Transportation
- 10.2.5. Sports and Entertainment
- 10.2.6. Telecommunications
- 10.2.7. Other End-Users
- 10.3. Market Analysis, Insights and Forecast - by Application
- 10.3.1. Enterprise DAS
- 10.3.2. Public Safety DAS
- 10.3.3. Other Applications
- 10.1. Market Analysis, Insights and Forecast - by Type
- 11. Middle East and Africa Distributed Antenna Systems Industry Analysis, Insights and Forecast, 2019-2031
- 11.1. Market Analysis, Insights and Forecast - by Type
- 11.1.1. Active
- 11.1.2. Passive
- 11.1.3. Digital
- 11.1.4. Hybrid
- 11.2. Market Analysis, Insights and Forecast - by End-User
- 11.2.1. Manufacturing
- 11.2.2. Healthcare
- 11.2.3. Government
- 11.2.4. Transportation
- 11.2.5. Sports and Entertainment
- 11.2.6. Telecommunications
- 11.2.7. Other End-Users
- 11.3. Market Analysis, Insights and Forecast - by Application
- 11.3.1. Enterprise DAS
- 11.3.2. Public Safety DAS
- 11.3.3. Other Applications
- 11.1. Market Analysis, Insights and Forecast - by Type
- 12. North America Distributed Antenna Systems Industry Analysis, Insights and Forecast, 2019-2031
- 12.1. Market Analysis, Insights and Forecast - By Country/Sub-region
- 12.1.1 United States
- 12.1.2 Canada
- 12.1.3 Mexico
- 13. Europe Distributed Antenna Systems Industry Analysis, Insights and Forecast, 2019-2031
- 13.1. Market Analysis, Insights and Forecast - By Country/Sub-region
- 13.1.1 Germany
- 13.1.2 United Kingdom
- 13.1.3 France
- 13.1.4 Spain
- 13.1.5 Italy
- 13.1.6 Spain
- 13.1.7 Belgium
- 13.1.8 Netherland
- 13.1.9 Nordics
- 13.1.10 Rest of Europe
- 14. Asia Pacific Distributed Antenna Systems Industry Analysis, Insights and Forecast, 2019-2031
- 14.1. Market Analysis, Insights and Forecast - By Country/Sub-region
- 14.1.1 China
- 14.1.2 Japan
- 14.1.3 India
- 14.1.4 South Korea
- 14.1.5 Southeast Asia
- 14.1.6 Australia
- 14.1.7 Indonesia
- 14.1.8 Phillipes
- 14.1.9 Singapore
- 14.1.10 Thailandc
- 14.1.11 Rest of Asia Pacific
- 15. South America Distributed Antenna Systems Industry Analysis, Insights and Forecast, 2019-2031
- 15.1. Market Analysis, Insights and Forecast - By Country/Sub-region
- 15.1.1 Brazil
- 15.1.2 Argentina
- 15.1.3 Peru
- 15.1.4 Chile
- 15.1.5 Colombia
- 15.1.6 Ecuador
- 15.1.7 Venezuela
- 15.1.8 Rest of South America
- 16. MEA Distributed Antenna Systems Industry Analysis, Insights and Forecast, 2019-2031
- 16.1. Market Analysis, Insights and Forecast - By Country/Sub-region
- 16.1.1 United Arab Emirates
- 16.1.2 Saudi Arabia
- 16.1.3 South Africa
- 16.1.4 Rest of Middle East and Africa
- 17. Competitive Analysis
- 17.1. Global Market Share Analysis 2024
- 17.2. Company Profiles
- 17.2.1 Anixter Inc
- 17.2.1.1. Overview
- 17.2.1.2. Products
- 17.2.1.3. SWOT Analysis
- 17.2.1.4. Recent Developments
- 17.2.1.5. Financials (Based on Availability)
- 17.2.2 Boingo Wireless Inc
- 17.2.2.1. Overview
- 17.2.2.2. Products
- 17.2.2.3. SWOT Analysis
- 17.2.2.4. Recent Developments
- 17.2.2.5. Financials (Based on Availability)
- 17.2.3 CommScope Inc
- 17.2.3.1. Overview
- 17.2.3.2. Products
- 17.2.3.3. SWOT Analysis
- 17.2.3.4. Recent Developments
- 17.2.3.5. Financials (Based on Availability)
- 17.2.4 American Tower Corporation
- 17.2.4.1. Overview
- 17.2.4.2. Products
- 17.2.4.3. SWOT Analysis
- 17.2.4.4. Recent Developments
- 17.2.4.5. Financials (Based on Availability)
- 17.2.5 Tower Bersama Group
- 17.2.5.1. Overview
- 17.2.5.2. Products
- 17.2.5.3. SWOT Analysis
- 17.2.5.4. Recent Developments
- 17.2.5.5. Financials (Based on Availability)
- 17.2.6 Corning Inc
- 17.2.6.1. Overview
- 17.2.6.2. Products
- 17.2.6.3. SWOT Analysis
- 17.2.6.4. Recent Developments
- 17.2.6.5. Financials (Based on Availability)
- 17.2.7 TE Connectivity Ltd
- 17.2.7.1. Overview
- 17.2.7.2. Products
- 17.2.7.3. SWOT Analysis
- 17.2.7.4. Recent Developments
- 17.2.7.5. Financials (Based on Availability)
- 17.2.8 Comba Telecom Systems Holdings Ltd
- 17.2.8.1. Overview
- 17.2.8.2. Products
- 17.2.8.3. SWOT Analysis
- 17.2.8.4. Recent Developments
- 17.2.8.5. Financials (Based on Availability)
- 17.2.9 Antenna Products Corporation
- 17.2.9.1. Overview
- 17.2.9.2. Products
- 17.2.9.3. SWOT Analysis
- 17.2.9.4. Recent Developments
- 17.2.9.5. Financials (Based on Availability)
- 17.2.10 Cobham PLC
- 17.2.10.1. Overview
- 17.2.10.2. Products
- 17.2.10.3. SWOT Analysis
- 17.2.10.4. Recent Developments
- 17.2.10.5. Financials (Based on Availability)
- 17.2.11 SOLiD Inc
- 17.2.11.1. Overview
- 17.2.11.2. Products
- 17.2.11.3. SWOT Analysis
- 17.2.11.4. Recent Developments
- 17.2.11.5. Financials (Based on Availability)
- 17.2.1 Anixter Inc
List of Figures
- Figure 1: Global Distributed Antenna Systems Industry Revenue Breakdown (Million, %) by Region 2024 & 2032
- Figure 2: North America Distributed Antenna Systems Industry Revenue (Million), by Country 2024 & 2032
- Figure 3: North America Distributed Antenna Systems Industry Revenue Share (%), by Country 2024 & 2032
- Figure 4: Europe Distributed Antenna Systems Industry Revenue (Million), by Country 2024 & 2032
- Figure 5: Europe Distributed Antenna Systems Industry Revenue Share (%), by Country 2024 & 2032
- Figure 6: Asia Pacific Distributed Antenna Systems Industry Revenue (Million), by Country 2024 & 2032
- Figure 7: Asia Pacific Distributed Antenna Systems Industry Revenue Share (%), by Country 2024 & 2032
- Figure 8: South America Distributed Antenna Systems Industry Revenue (Million), by Country 2024 & 2032
- Figure 9: South America Distributed Antenna Systems Industry Revenue Share (%), by Country 2024 & 2032
- Figure 10: MEA Distributed Antenna Systems Industry Revenue (Million), by Country 2024 & 2032
- Figure 11: MEA Distributed Antenna Systems Industry Revenue Share (%), by Country 2024 & 2032
- Figure 12: North America Distributed Antenna Systems Industry Revenue (Million), by Type 2024 & 2032
- Figure 13: North America Distributed Antenna Systems Industry Revenue Share (%), by Type 2024 & 2032
- Figure 14: North America Distributed Antenna Systems Industry Revenue (Million), by End-User 2024 & 2032
- Figure 15: North America Distributed Antenna Systems Industry Revenue Share (%), by End-User 2024 & 2032
- Figure 16: North America Distributed Antenna Systems Industry Revenue (Million), by Application 2024 & 2032
- Figure 17: North America Distributed Antenna Systems Industry Revenue Share (%), by Application 2024 & 2032
- Figure 18: North America Distributed Antenna Systems Industry Revenue (Million), by Country 2024 & 2032
- Figure 19: North America Distributed Antenna Systems Industry Revenue Share (%), by Country 2024 & 2032
- Figure 20: Europe Distributed Antenna Systems Industry Revenue (Million), by Type 2024 & 2032
- Figure 21: Europe Distributed Antenna Systems Industry Revenue Share (%), by Type 2024 & 2032
- Figure 22: Europe Distributed Antenna Systems Industry Revenue (Million), by End-User 2024 & 2032
- Figure 23: Europe Distributed Antenna Systems Industry Revenue Share (%), by End-User 2024 & 2032
- Figure 24: Europe Distributed Antenna Systems Industry Revenue (Million), by Application 2024 & 2032
- Figure 25: Europe Distributed Antenna Systems Industry Revenue Share (%), by Application 2024 & 2032
- Figure 26: Europe Distributed Antenna Systems Industry Revenue (Million), by Country 2024 & 2032
- Figure 27: Europe Distributed Antenna Systems Industry Revenue Share (%), by Country 2024 & 2032
- Figure 28: Asia Distributed Antenna Systems Industry Revenue (Million), by Type 2024 & 2032
- Figure 29: Asia Distributed Antenna Systems Industry Revenue Share (%), by Type 2024 & 2032
- Figure 30: Asia Distributed Antenna Systems Industry Revenue (Million), by End-User 2024 & 2032
- Figure 31: Asia Distributed Antenna Systems Industry Revenue Share (%), by End-User 2024 & 2032
- Figure 32: Asia Distributed Antenna Systems Industry Revenue (Million), by Application 2024 & 2032
- Figure 33: Asia Distributed Antenna Systems Industry Revenue Share (%), by Application 2024 & 2032
- Figure 34: Asia Distributed Antenna Systems Industry Revenue (Million), by Country 2024 & 2032
- Figure 35: Asia Distributed Antenna Systems Industry Revenue Share (%), by Country 2024 & 2032
- Figure 36: Australia and New Zealand Distributed Antenna Systems Industry Revenue (Million), by Type 2024 & 2032
- Figure 37: Australia and New Zealand Distributed Antenna Systems Industry Revenue Share (%), by Type 2024 & 2032
- Figure 38: Australia and New Zealand Distributed Antenna Systems Industry Revenue (Million), by End-User 2024 & 2032
- Figure 39: Australia and New Zealand Distributed Antenna Systems Industry Revenue Share (%), by End-User 2024 & 2032
- Figure 40: Australia and New Zealand Distributed Antenna Systems Industry Revenue (Million), by Application 2024 & 2032
- Figure 41: Australia and New Zealand Distributed Antenna Systems Industry Revenue Share (%), by Application 2024 & 2032
- Figure 42: Australia and New Zealand Distributed Antenna Systems Industry Revenue (Million), by Country 2024 & 2032
- Figure 43: Australia and New Zealand Distributed Antenna Systems Industry Revenue Share (%), by Country 2024 & 2032
- Figure 44: Latin America Distributed Antenna Systems Industry Revenue (Million), by Type 2024 & 2032
- Figure 45: Latin America Distributed Antenna Systems Industry Revenue Share (%), by Type 2024 & 2032
- Figure 46: Latin America Distributed Antenna Systems Industry Revenue (Million), by End-User 2024 & 2032
- Figure 47: Latin America Distributed Antenna Systems Industry Revenue Share (%), by End-User 2024 & 2032
- Figure 48: Latin America Distributed Antenna Systems Industry Revenue (Million), by Application 2024 & 2032
- Figure 49: Latin America Distributed Antenna Systems Industry Revenue Share (%), by Application 2024 & 2032
- Figure 50: Latin America Distributed Antenna Systems Industry Revenue (Million), by Country 2024 & 2032
- Figure 51: Latin America Distributed Antenna Systems Industry Revenue Share (%), by Country 2024 & 2032
- Figure 52: Middle East and Africa Distributed Antenna Systems Industry Revenue (Million), by Type 2024 & 2032
- Figure 53: Middle East and Africa Distributed Antenna Systems Industry Revenue Share (%), by Type 2024 & 2032
- Figure 54: Middle East and Africa Distributed Antenna Systems Industry Revenue (Million), by End-User 2024 & 2032
- Figure 55: Middle East and Africa Distributed Antenna Systems Industry Revenue Share (%), by End-User 2024 & 2032
- Figure 56: Middle East and Africa Distributed Antenna Systems Industry Revenue (Million), by Application 2024 & 2032
- Figure 57: Middle East and Africa Distributed Antenna Systems Industry Revenue Share (%), by Application 2024 & 2032
- Figure 58: Middle East and Africa Distributed Antenna Systems Industry Revenue (Million), by Country 2024 & 2032
- Figure 59: Middle East and Africa Distributed Antenna Systems Industry Revenue Share (%), by Country 2024 & 2032
List of Tables
- Table 1: Global Distributed Antenna Systems Industry Revenue Million Forecast, by Region 2019 & 2032
- Table 2: Global Distributed Antenna Systems Industry Revenue Million Forecast, by Type 2019 & 2032
- Table 3: Global Distributed Antenna Systems Industry Revenue Million Forecast, by End-User 2019 & 2032
- Table 4: Global Distributed Antenna Systems Industry Revenue Million Forecast, by Application 2019 & 2032
- Table 5: Global Distributed Antenna Systems Industry Revenue Million Forecast, by Region 2019 & 2032
- Table 6: Global Distributed Antenna Systems Industry Revenue Million Forecast, by Country 2019 & 2032
- Table 7: United States Distributed Antenna Systems Industry Revenue (Million) Forecast, by Application 2019 & 2032
- Table 8: Canada Distributed Antenna Systems Industry Revenue (Million) Forecast, by Application 2019 & 2032
- Table 9: Mexico Distributed Antenna Systems Industry Revenue (Million) Forecast, by Application 2019 & 2032
- Table 10: Global Distributed Antenna Systems Industry Revenue Million Forecast, by Country 2019 & 2032
- Table 11: Germany Distributed Antenna Systems Industry Revenue (Million) Forecast, by Application 2019 & 2032
- Table 12: United Kingdom Distributed Antenna Systems Industry Revenue (Million) Forecast, by Application 2019 & 2032
- Table 13: France Distributed Antenna Systems Industry Revenue (Million) Forecast, by Application 2019 & 2032
- Table 14: Spain Distributed Antenna Systems Industry Revenue (Million) Forecast, by Application 2019 & 2032
- Table 15: Italy Distributed Antenna Systems Industry Revenue (Million) Forecast, by Application 2019 & 2032
- Table 16: Spain Distributed Antenna Systems Industry Revenue (Million) Forecast, by Application 2019 & 2032
- Table 17: Belgium Distributed Antenna Systems Industry Revenue (Million) Forecast, by Application 2019 & 2032
- Table 18: Netherland Distributed Antenna Systems Industry Revenue (Million) Forecast, by Application 2019 & 2032
- Table 19: Nordics Distributed Antenna Systems Industry Revenue (Million) Forecast, by Application 2019 & 2032
- Table 20: Rest of Europe Distributed Antenna Systems Industry Revenue (Million) Forecast, by Application 2019 & 2032
- Table 21: Global Distributed Antenna Systems Industry Revenue Million Forecast, by Country 2019 & 2032
- Table 22: China Distributed Antenna Systems Industry Revenue (Million) Forecast, by Application 2019 & 2032
- Table 23: Japan Distributed Antenna Systems Industry Revenue (Million) Forecast, by Application 2019 & 2032
- Table 24: India Distributed Antenna Systems Industry Revenue (Million) Forecast, by Application 2019 & 2032
- Table 25: South Korea Distributed Antenna Systems Industry Revenue (Million) Forecast, by Application 2019 & 2032
- Table 26: Southeast Asia Distributed Antenna Systems Industry Revenue (Million) Forecast, by Application 2019 & 2032
- Table 27: Australia Distributed Antenna Systems Industry Revenue (Million) Forecast, by Application 2019 & 2032
- Table 28: Indonesia Distributed Antenna Systems Industry Revenue (Million) Forecast, by Application 2019 & 2032
- Table 29: Phillipes Distributed Antenna Systems Industry Revenue (Million) Forecast, by Application 2019 & 2032
- Table 30: Singapore Distributed Antenna Systems Industry Revenue (Million) Forecast, by Application 2019 & 2032
- Table 31: Thailandc Distributed Antenna Systems Industry Revenue (Million) Forecast, by Application 2019 & 2032
- Table 32: Rest of Asia Pacific Distributed Antenna Systems Industry Revenue (Million) Forecast, by Application 2019 & 2032
- Table 33: Global Distributed Antenna Systems Industry Revenue Million Forecast, by Country 2019 & 2032
- Table 34: Brazil Distributed Antenna Systems Industry Revenue (Million) Forecast, by Application 2019 & 2032
- Table 35: Argentina Distributed Antenna Systems Industry Revenue (Million) Forecast, by Application 2019 & 2032
- Table 36: Peru Distributed Antenna Systems Industry Revenue (Million) Forecast, by Application 2019 & 2032
- Table 37: Chile Distributed Antenna Systems Industry Revenue (Million) Forecast, by Application 2019 & 2032
- Table 38: Colombia Distributed Antenna Systems Industry Revenue (Million) Forecast, by Application 2019 & 2032
- Table 39: Ecuador Distributed Antenna Systems Industry Revenue (Million) Forecast, by Application 2019 & 2032
- Table 40: Venezuela Distributed Antenna Systems Industry Revenue (Million) Forecast, by Application 2019 & 2032
- Table 41: Rest of South America Distributed Antenna Systems Industry Revenue (Million) Forecast, by Application 2019 & 2032
- Table 42: Global Distributed Antenna Systems Industry Revenue Million Forecast, by Country 2019 & 2032
- Table 43: United Arab Emirates Distributed Antenna Systems Industry Revenue (Million) Forecast, by Application 2019 & 2032
- Table 44: Saudi Arabia Distributed Antenna Systems Industry Revenue (Million) Forecast, by Application 2019 & 2032
- Table 45: South Africa Distributed Antenna Systems Industry Revenue (Million) Forecast, by Application 2019 & 2032
- Table 46: Rest of Middle East and Africa Distributed Antenna Systems Industry Revenue (Million) Forecast, by Application 2019 & 2032
- Table 47: Global Distributed Antenna Systems Industry Revenue Million Forecast, by Type 2019 & 2032
- Table 48: Global Distributed Antenna Systems Industry Revenue Million Forecast, by End-User 2019 & 2032
- Table 49: Global Distributed Antenna Systems Industry Revenue Million Forecast, by Application 2019 & 2032
- Table 50: Global Distributed Antenna Systems Industry Revenue Million Forecast, by Country 2019 & 2032
- Table 51: Global Distributed Antenna Systems Industry Revenue Million Forecast, by Type 2019 & 2032
- Table 52: Global Distributed Antenna Systems Industry Revenue Million Forecast, by End-User 2019 & 2032
- Table 53: Global Distributed Antenna Systems Industry Revenue Million Forecast, by Application 2019 & 2032
- Table 54: Global Distributed Antenna Systems Industry Revenue Million Forecast, by Country 2019 & 2032
- Table 55: Global Distributed Antenna Systems Industry Revenue Million Forecast, by Type 2019 & 2032
- Table 56: Global Distributed Antenna Systems Industry Revenue Million Forecast, by End-User 2019 & 2032
- Table 57: Global Distributed Antenna Systems Industry Revenue Million Forecast, by Application 2019 & 2032
- Table 58: Global Distributed Antenna Systems Industry Revenue Million Forecast, by Country 2019 & 2032
- Table 59: Global Distributed Antenna Systems Industry Revenue Million Forecast, by Type 2019 & 2032
- Table 60: Global Distributed Antenna Systems Industry Revenue Million Forecast, by End-User 2019 & 2032
- Table 61: Global Distributed Antenna Systems Industry Revenue Million Forecast, by Application 2019 & 2032
- Table 62: Global Distributed Antenna Systems Industry Revenue Million Forecast, by Country 2019 & 2032
- Table 63: Global Distributed Antenna Systems Industry Revenue Million Forecast, by Type 2019 & 2032
- Table 64: Global Distributed Antenna Systems Industry Revenue Million Forecast, by End-User 2019 & 2032
- Table 65: Global Distributed Antenna Systems Industry Revenue Million Forecast, by Application 2019 & 2032
- Table 66: Global Distributed Antenna Systems Industry Revenue Million Forecast, by Country 2019 & 2032
- Table 67: Global Distributed Antenna Systems Industry Revenue Million Forecast, by Type 2019 & 2032
- Table 68: Global Distributed Antenna Systems Industry Revenue Million Forecast, by End-User 2019 & 2032
- Table 69: Global Distributed Antenna Systems Industry Revenue Million Forecast, by Application 2019 & 2032
- Table 70: Global Distributed Antenna Systems Industry Revenue Million Forecast, by Country 2019 & 2032
Frequently Asked Questions
1. What is the projected Compound Annual Growth Rate (CAGR) of the Distributed Antenna Systems Industry?
The projected CAGR is approximately 6.03%.
2. Which companies are prominent players in the Distributed Antenna Systems Industry?
Key companies in the market include Anixter Inc, Boingo Wireless Inc, CommScope Inc, American Tower Corporation, Tower Bersama Group, Corning Inc, TE Connectivity Ltd, Comba Telecom Systems Holdings Ltd, Antenna Products Corporation, Cobham PLC, SOLiD Inc.
3. What are the main segments of the Distributed Antenna Systems Industry?
The market segments include Type, End-User, Application.
4. Can you provide details about the market size?
The market size is estimated to be USD 10.28 Million as of 2022.
5. What are some drivers contributing to market growth?
DAS Ability to Support Multiple Telecom Carriers and Upcoming Technologies.
6. What are the notable trends driving market growth?
Sport and Entertainment Segment to Hold a Significant Market Share.
7. Are there any restraints impacting market growth?
Lack of Awareness About Intellectual Property Outsourcing.
8. Can you provide examples of recent developments in the market?
July 2023: American Tower Corporation and Xcel Energy Center announced the deployment of a Distributed Antenna System (DAS) solution that will bring 5G technology to the arena. The company enters a new era of fan engagement and provides cutting-edge applications for the Minnesota Wild fans, with an updated, neutral-host 5G DAS.
9. What pricing options are available for accessing the report?
Pricing options include single-user, multi-user, and enterprise licenses priced at USD 4750, USD 5250, and USD 8750 respectively.
10. Is the market size provided in terms of value or volume?
The market size is provided in terms of value, measured in Million.
11. Are there any specific market keywords associated with the report?
Yes, the market keyword associated with the report is "Distributed Antenna Systems Industry," which aids in identifying and referencing the specific market segment covered.
12. How do I determine which pricing option suits my needs best?
The pricing options vary based on user requirements and access needs. Individual users may opt for single-user licenses, while businesses requiring broader access may choose multi-user or enterprise licenses for cost-effective access to the report.
13. Are there any additional resources or data provided in the Distributed Antenna Systems Industry report?
While the report offers comprehensive insights, it's advisable to review the specific contents or supplementary materials provided to ascertain if additional resources or data are available.
14. How can I stay updated on further developments or reports in the Distributed Antenna Systems Industry?
To stay informed about further developments, trends, and reports in the Distributed Antenna Systems Industry, consider subscribing to industry newsletters, following relevant companies and organizations, or regularly checking reputable industry news sources and publications.
Methodology
Step 1 - Identification of Relevant Samples Size from Population Database


Step 2 - Approaches for Defining Global Market Size (Value, Volume* & Price*)

Note*: In applicable scenarios
Step 3 - Data Sources
Primary Research
- Web Analytics
- Survey Reports
- Research Institute
- Latest Research Reports
- Opinion Leaders
Secondary Research
- Annual Reports
- White Paper
- Latest Press Release
- Industry Association
- Paid Database
- Investor Presentations

Step 4 - Data Triangulation
Involves using different sources of information in order to increase the validity of a study
These sources are likely to be stakeholders in a program - participants, other researchers, program staff, other community members, and so on.
Then we put all data in single framework & apply various statistical tools to find out the dynamic on the market.
During the analysis stage, feedback from the stakeholder groups would be compared to determine areas of agreement as well as areas of divergence
