

Key Insights
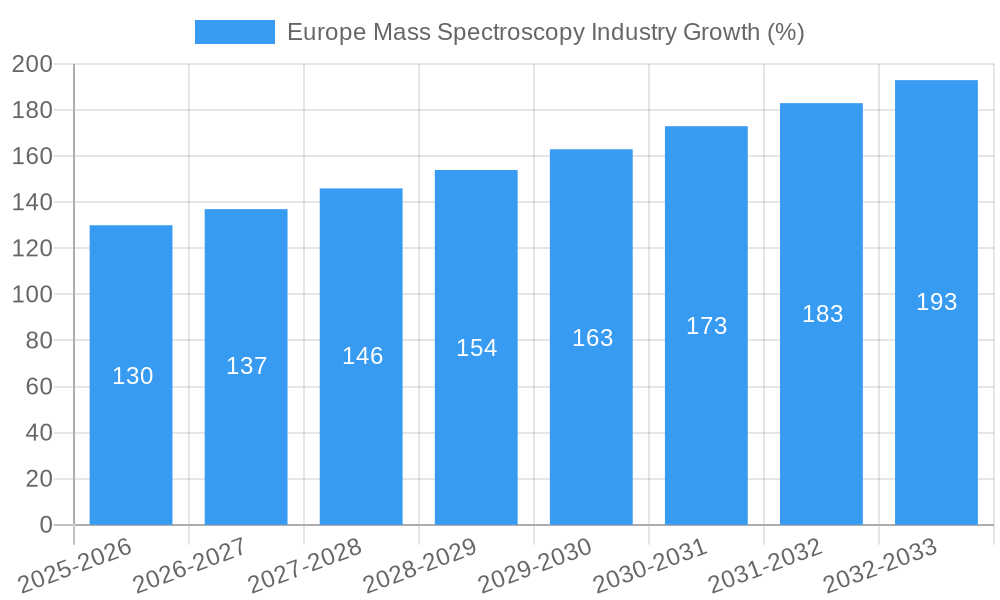
The European mass spectrometry market, valued at approximately €2 billion in 2025, is projected to experience robust growth, driven by a compound annual growth rate (CAGR) of 6.50% from 2025 to 2033. This expansion is fueled by several key factors. The pharmaceutical and biotechnology sectors are significant contributors, leveraging mass spectrometry for drug discovery, development, and quality control. Increasing research and development activities within these industries, coupled with the rising prevalence of chronic diseases demanding advanced diagnostic tools, are stimulating demand. Furthermore, advancements in mass spectrometry technologies, such as hybrid mass spectrometry and Fourier Transform Mass Spectrometry (FTMS), offering enhanced sensitivity and resolution, are driving market adoption. The growing adoption of time-of-flight (TOF) mass spectrometry, known for its speed and accuracy, further contributes to this positive growth trajectory. Germany, France, and the United Kingdom represent the largest national markets within Europe, reflecting their strong presence in the pharmaceutical and biotechnology sectors and established research infrastructure.
However, the market faces certain restraints. The high cost of advanced mass spectrometry instruments and the need for specialized expertise to operate and maintain them can limit accessibility for smaller research institutions and laboratories. Regulatory hurdles and stringent quality control standards also pose challenges. Despite these limitations, the overall market outlook remains positive, with the continued expansion of the pharmaceutical and biotechnology industries and ongoing technological advancements expected to fuel significant market growth throughout the forecast period. The diversification into other application areas, such as the chemical industry and environmental monitoring, presents further opportunities for market expansion. Competitive dynamics amongst major players like Waters Corporation, Thermo Fisher Scientific, and Agilent Technologies, are also expected to drive innovation and affordability in the long term.

Europe Mass Spectroscopy Industry Market Report: 2019-2033
This comprehensive report provides an in-depth analysis of the Europe Mass Spectroscopy industry, offering valuable insights for industry professionals, investors, and strategic decision-makers. Covering the period from 2019 to 2033, with a base year of 2025 and a forecast period of 2025-2033, this report dissects market dynamics, growth trends, and competitive landscapes to illuminate lucrative opportunities and potential challenges. The report segments the market by technology (Hybrid Mass Spectrometry, FTMS, Time-of-flight, Other Mass Spectrometry) and application (Pharmaceuticals, Biotechnology, Chemical, Other Applications), providing granular insights into each segment's performance and growth trajectory. Key players like Waters Corporation, PerkinElmer Inc., Thermo Fisher Scientific Inc., and others are profiled, revealing their market positions and strategic initiatives.
Europe Mass Spectroscopy Industry Market Dynamics & Structure
The European mass spectrometry market is characterized by a moderately concentrated landscape, with several key players holding significant market shares. Market size in 2024 is estimated at €xx Million. Technological innovation, driven by advancements in miniaturization, sensitivity, and data analysis, is a primary growth driver. Stringent regulatory frameworks, particularly concerning data privacy and environmental compliance, shape industry practices. The market experiences competitive pressure from alternative analytical techniques, but mass spectrometry’s versatility and accuracy maintain its dominant position. End-user demographics are diverse, spanning academic research institutions, pharmaceutical companies, and environmental testing laboratories. The historical period (2019-2024) witnessed several mergers and acquisitions (M&A), with an estimated xx M&A deals. This consolidation trend is expected to continue, further shaping the competitive landscape.
- Market Concentration: Moderately concentrated, with top 5 players holding approximately xx% market share in 2024.
- Technological Innovation Drivers: Miniaturization, increased sensitivity, improved data analysis software.
- Regulatory Frameworks: Stringent regulations impacting data privacy and environmental compliance.
- Competitive Product Substitutes: Chromatography, NMR spectroscopy, but mass spectrometry remains dominant due to versatility.
- End-User Demographics: Academic institutions, pharmaceutical companies, environmental testing labs, chemical industry.
- M&A Trends: Significant M&A activity observed in the historical period (2019-2024), expected to continue. The average deal size was approximately €xx Million. Innovation barriers include high R&D costs and skilled labor shortages.
Europe Mass Spectroscopy Industry Growth Trends & Insights
The European mass spectrometry market is poised for significant growth over the forecast period (2025-2033). Driven by increasing demand from pharmaceutical and biotechnology sectors, coupled with technological advancements in high-resolution mass spectrometry and improved data processing capabilities, the market is expected to expand at a Compound Annual Growth Rate (CAGR) of xx% from 2025 to 2033, reaching an estimated value of €xx Million by 2033. Adoption rates are highest in the pharmaceutical and biotechnology sectors, reflecting the critical role of mass spectrometry in drug discovery and development. Technological disruptions, such as the development of miniaturized and portable mass spectrometers, are expanding market applications into diverse fields. Consumer behavior shifts, including increasing emphasis on personalized medicine and environmental monitoring, are further fueling demand. Market penetration in niche applications like food safety and forensic science is also expected to grow.
Dominant Regions, Countries, or Segments in Europe Mass Spectroscopy Industry
Germany, the UK, and France remain the dominant forces in the European mass spectrometry market, collectively accounting for a significant portion (precise figures pending data update) of the overall market share in 2024. This strong presence is directly attributable to the high concentration of pharmaceutical and biotechnology companies within these regions, creating a robust demand for advanced analytical technologies. Within the technology landscape, Hybrid Mass Spectrometry continues to hold the largest market share, owing to its unmatched versatility and superior performance capabilities, particularly in complex analytical workflows. The pharmaceutical industry remains the leading application segment, fueled by the increasing reliance on mass spectrometry for critical drug discovery, development, and quality control processes. This is further bolstered by stringent regulatory requirements for drug purity and efficacy.
- Key Regional Drivers: Concentrated clusters of pharmaceutical and biotechnology companies in Germany, the UK, and France, coupled with substantial R&D investments and government support for innovation.
- Technological Segment Dominance: Hybrid Mass Spectrometry maintains its leading position due to its enhanced sensitivity, resolution, and ability to handle diverse sample types.
- Application Segment Dominance: The pharmaceutical industry's unwavering dependence on accurate and reliable mass spectrometry for drug development, quality control, and regulatory compliance solidifies its dominant role.
- Growth Potential: Eastern European countries present substantial untapped potential, driven by growing investments in healthcare infrastructure, rising research activities, and a growing awareness of advanced analytical techniques.
Europe Mass Spectroscopy Industry Product Landscape
The European mass spectrometry market is characterized by a dynamic product landscape marked by continuous innovation. Manufacturers are relentlessly pursuing improvements in sensitivity, resolution, speed, and ease of use. Recent innovations include the development of miniaturized mass spectrometers for portable and point-of-care applications, sophisticated software solutions for streamlined data processing and interpretation, and the integration of hyphenated techniques—combining mass spectrometry with other analytical methods like chromatography—to provide even more comprehensive analytical capabilities. These advancements contribute to significantly enhanced analytical capabilities, boosting both the efficiency and accuracy of diverse applications across various sectors. Competitive differentiation often hinges on superior sensitivity, speed, user-friendliness, and the availability of specialized, application-specific software packages that simplify complex data analysis.
Key Drivers, Barriers & Challenges in Europe Mass Spectroscopy Industry
Key Drivers:
- Increasing demand from pharmaceutical and biotechnology sectors.
- Technological advancements in mass spectrometry.
- Growing awareness of the importance of environmental monitoring.
- Increasing investments in healthcare infrastructure and research.
Key Challenges:
- High capital investment costs for advanced mass spectrometers.
- Skilled labor shortages hinder operations and limit market growth.
- Stringent regulatory requirements for data privacy and environmental compliance.
- Intense competition from other analytical techniques. The impact of these factors is estimated to negatively impact market growth by xx% in the next 5 years.
Emerging Opportunities in Europe Mass Spectroscopy Industry
- Expanding applications in proteomics and metabolomics.
- Growing demand for portable and miniaturized mass spectrometers.
- Increasing use of mass spectrometry in food safety and environmental testing.
- Development of innovative applications in personalized medicine.
Growth Accelerators in the Europe Mass Spectroscopy Industry
Several key factors are poised to accelerate growth within the European mass spectrometry industry. Groundbreaking technological advancements, such as improvements in ion sources and detectors, will play a crucial role in driving long-term expansion. Strategic collaborations between mass spectrometry manufacturers and end-users, particularly within the thriving pharmaceutical sector, are vital for fostering product development tailored to specific market needs and facilitating smoother market penetration. Furthermore, expanding into emerging markets within Europe will unlock significant new growth avenues, particularly in countries with developing healthcare infrastructure and increasing R&D investment.
Key Players Shaping the Europe Mass Spectroscopy Industry Market
- Waters Corporation
- PerkinElmer Inc.
- Thermo Fisher Scientific Inc.
- Leco Corporation
- Danaher Corporation
- Agilent Technologies Inc.
- Dani Instruments SpA
- Bruker Corporation
- Shimadzu Corporation
Notable Milestones in Europe Mass Spectroscopy Industry Sector
- June 2022: Waters Corporation unveiled new instruments, software, and product enhancements to drive drug discovery and development. This significantly enhanced their product offerings and competitive advantage.
- April 2022: Bruker acquired IonSense, expanding its capabilities in ambient ionization and broadening its application range. This acquisition strengthened Bruker's market position and product portfolio.
In-Depth Europe Mass Spectroscopy Industry Market Outlook
The European mass spectrometry market exhibits substantial long-term growth potential. A confluence of factors, including continuous technological innovation, strategic partnerships to ensure effective market penetration, and the expansion into new application areas, will collectively propel market expansion. The widespread adoption of mass spectrometry across a diverse range of sectors, combined with a supportive regulatory environment that emphasizes accurate and reliable analytical results, will create numerous lucrative opportunities for established players and new entrants. The market is projected to experience robust growth, exceeding €xx Million (precise figures pending data update) by 2033, driven by the key factors and trends detailed within this report. This positive outlook underscores the enduring importance of mass spectrometry as a cornerstone technology for scientific advancement and industrial innovation.
Europe Mass Spectroscopy Industry Segmentation
-
1. Technology
-
1.1. Hybrid Mass Spectrometry
- 1.1.1. Triple Quadrupole (Tandem)
- 1.1.2. Quadrupole TOF (Q-TOF)
- 1.1.3. FTMS (Fourier Transform Mass Spectrometry)
-
1.2. Single Mass Spectrometry
- 1.2.1. ION Trap
- 1.2.2. Time-of-flight (TOF)
- 1.3. Other Mass Spectrometry
-
1.1. Hybrid Mass Spectrometry
-
2. Application
- 2.1. Pharmaceuticals Industry
- 2.2. Biotechnology Industry
- 2.3. Chemical Industry
- 2.4. Other Applications
Europe Mass Spectroscopy Industry Segmentation By Geography
- 1. Germany
- 2. United Kingdom
- 3. France
- 4. Italy
- 5. Spain
- 6. Rest of Europe

Europe Mass Spectroscopy Industry REPORT HIGHLIGHTS
| Aspects | Details |
|---|---|
| Study Period | 2019-2033 |
| Base Year | 2024 |
| Estimated Year | 2025 |
| Forecast Period | 2025-2033 |
| Historical Period | 2019-2024 |
| Growth Rate | CAGR of 6.50% from 2019-2033 |
| Segmentation |
|
Table of Contents
- 1. Introduction
- 1.1. Research Scope
- 1.2. Market Segmentation
- 1.3. Research Methodology
- 1.4. Definitions and Assumptions
- 2. Executive Summary
- 2.1. Introduction
- 3. Market Dynamics
- 3.1. Introduction
- 3.2. Market Drivers
- 3.2.1. Increasing Technological Advancement; Increased Pharmaceutical and Biotechnological Compounds in Pipeline
- 3.3. Market Restrains
- 3.3.1. High Cost of Instrument; Shortage of Skilled Technicians
- 3.4. Market Trends
- 3.4.1. Triple Quadrupole (Tandem Mass Spectrometry Devices) Segment is Expected to Dominate the Market over the Forecast Period
- 4. Market Factor Analysis
- 4.1. Porters Five Forces
- 4.2. Supply/Value Chain
- 4.3. PESTEL analysis
- 4.4. Market Entropy
- 4.5. Patent/Trademark Analysis
- 5. Europe Mass Spectroscopy Industry Analysis, Insights and Forecast, 2019-2031
- 5.1. Market Analysis, Insights and Forecast - by Technology
- 5.1.1. Hybrid Mass Spectrometry
- 5.1.1.1. Triple Quadrupole (Tandem)
- 5.1.1.2. Quadrupole TOF (Q-TOF)
- 5.1.1.3. FTMS (Fourier Transform Mass Spectrometry)
- 5.1.2. Single Mass Spectrometry
- 5.1.2.1. ION Trap
- 5.1.2.2. Time-of-flight (TOF)
- 5.1.3. Other Mass Spectrometry
- 5.1.1. Hybrid Mass Spectrometry
- 5.2. Market Analysis, Insights and Forecast - by Application
- 5.2.1. Pharmaceuticals Industry
- 5.2.2. Biotechnology Industry
- 5.2.3. Chemical Industry
- 5.2.4. Other Applications
- 5.3. Market Analysis, Insights and Forecast - by Region
- 5.3.1. Germany
- 5.3.2. United Kingdom
- 5.3.3. France
- 5.3.4. Italy
- 5.3.5. Spain
- 5.3.6. Rest of Europe
- 5.1. Market Analysis, Insights and Forecast - by Technology
- 6. Germany Europe Mass Spectroscopy Industry Analysis, Insights and Forecast, 2019-2031
- 6.1. Market Analysis, Insights and Forecast - by Technology
- 6.1.1. Hybrid Mass Spectrometry
- 6.1.1.1. Triple Quadrupole (Tandem)
- 6.1.1.2. Quadrupole TOF (Q-TOF)
- 6.1.1.3. FTMS (Fourier Transform Mass Spectrometry)
- 6.1.2. Single Mass Spectrometry
- 6.1.2.1. ION Trap
- 6.1.2.2. Time-of-flight (TOF)
- 6.1.3. Other Mass Spectrometry
- 6.1.1. Hybrid Mass Spectrometry
- 6.2. Market Analysis, Insights and Forecast - by Application
- 6.2.1. Pharmaceuticals Industry
- 6.2.2. Biotechnology Industry
- 6.2.3. Chemical Industry
- 6.2.4. Other Applications
- 6.1. Market Analysis, Insights and Forecast - by Technology
- 7. United Kingdom Europe Mass Spectroscopy Industry Analysis, Insights and Forecast, 2019-2031
- 7.1. Market Analysis, Insights and Forecast - by Technology
- 7.1.1. Hybrid Mass Spectrometry
- 7.1.1.1. Triple Quadrupole (Tandem)
- 7.1.1.2. Quadrupole TOF (Q-TOF)
- 7.1.1.3. FTMS (Fourier Transform Mass Spectrometry)
- 7.1.2. Single Mass Spectrometry
- 7.1.2.1. ION Trap
- 7.1.2.2. Time-of-flight (TOF)
- 7.1.3. Other Mass Spectrometry
- 7.1.1. Hybrid Mass Spectrometry
- 7.2. Market Analysis, Insights and Forecast - by Application
- 7.2.1. Pharmaceuticals Industry
- 7.2.2. Biotechnology Industry
- 7.2.3. Chemical Industry
- 7.2.4. Other Applications
- 7.1. Market Analysis, Insights and Forecast - by Technology
- 8. France Europe Mass Spectroscopy Industry Analysis, Insights and Forecast, 2019-2031
- 8.1. Market Analysis, Insights and Forecast - by Technology
- 8.1.1. Hybrid Mass Spectrometry
- 8.1.1.1. Triple Quadrupole (Tandem)
- 8.1.1.2. Quadrupole TOF (Q-TOF)
- 8.1.1.3. FTMS (Fourier Transform Mass Spectrometry)
- 8.1.2. Single Mass Spectrometry
- 8.1.2.1. ION Trap
- 8.1.2.2. Time-of-flight (TOF)
- 8.1.3. Other Mass Spectrometry
- 8.1.1. Hybrid Mass Spectrometry
- 8.2. Market Analysis, Insights and Forecast - by Application
- 8.2.1. Pharmaceuticals Industry
- 8.2.2. Biotechnology Industry
- 8.2.3. Chemical Industry
- 8.2.4. Other Applications
- 8.1. Market Analysis, Insights and Forecast - by Technology
- 9. Italy Europe Mass Spectroscopy Industry Analysis, Insights and Forecast, 2019-2031
- 9.1. Market Analysis, Insights and Forecast - by Technology
- 9.1.1. Hybrid Mass Spectrometry
- 9.1.1.1. Triple Quadrupole (Tandem)
- 9.1.1.2. Quadrupole TOF (Q-TOF)
- 9.1.1.3. FTMS (Fourier Transform Mass Spectrometry)
- 9.1.2. Single Mass Spectrometry
- 9.1.2.1. ION Trap
- 9.1.2.2. Time-of-flight (TOF)
- 9.1.3. Other Mass Spectrometry
- 9.1.1. Hybrid Mass Spectrometry
- 9.2. Market Analysis, Insights and Forecast - by Application
- 9.2.1. Pharmaceuticals Industry
- 9.2.2. Biotechnology Industry
- 9.2.3. Chemical Industry
- 9.2.4. Other Applications
- 9.1. Market Analysis, Insights and Forecast - by Technology
- 10. Spain Europe Mass Spectroscopy Industry Analysis, Insights and Forecast, 2019-2031
- 10.1. Market Analysis, Insights and Forecast - by Technology
- 10.1.1. Hybrid Mass Spectrometry
- 10.1.1.1. Triple Quadrupole (Tandem)
- 10.1.1.2. Quadrupole TOF (Q-TOF)
- 10.1.1.3. FTMS (Fourier Transform Mass Spectrometry)
- 10.1.2. Single Mass Spectrometry
- 10.1.2.1. ION Trap
- 10.1.2.2. Time-of-flight (TOF)
- 10.1.3. Other Mass Spectrometry
- 10.1.1. Hybrid Mass Spectrometry
- 10.2. Market Analysis, Insights and Forecast - by Application
- 10.2.1. Pharmaceuticals Industry
- 10.2.2. Biotechnology Industry
- 10.2.3. Chemical Industry
- 10.2.4. Other Applications
- 10.1. Market Analysis, Insights and Forecast - by Technology
- 11. Rest of Europe Europe Mass Spectroscopy Industry Analysis, Insights and Forecast, 2019-2031
- 11.1. Market Analysis, Insights and Forecast - by Technology
- 11.1.1. Hybrid Mass Spectrometry
- 11.1.1.1. Triple Quadrupole (Tandem)
- 11.1.1.2. Quadrupole TOF (Q-TOF)
- 11.1.1.3. FTMS (Fourier Transform Mass Spectrometry)
- 11.1.2. Single Mass Spectrometry
- 11.1.2.1. ION Trap
- 11.1.2.2. Time-of-flight (TOF)
- 11.1.3. Other Mass Spectrometry
- 11.1.1. Hybrid Mass Spectrometry
- 11.2. Market Analysis, Insights and Forecast - by Application
- 11.2.1. Pharmaceuticals Industry
- 11.2.2. Biotechnology Industry
- 11.2.3. Chemical Industry
- 11.2.4. Other Applications
- 11.1. Market Analysis, Insights and Forecast - by Technology
- 12. Germany Europe Mass Spectroscopy Industry Analysis, Insights and Forecast, 2019-2031
- 13. France Europe Mass Spectroscopy Industry Analysis, Insights and Forecast, 2019-2031
- 14. Italy Europe Mass Spectroscopy Industry Analysis, Insights and Forecast, 2019-2031
- 15. United Kingdom Europe Mass Spectroscopy Industry Analysis, Insights and Forecast, 2019-2031
- 16. Netherlands Europe Mass Spectroscopy Industry Analysis, Insights and Forecast, 2019-2031
- 17. Sweden Europe Mass Spectroscopy Industry Analysis, Insights and Forecast, 2019-2031
- 18. Rest of Europe Europe Mass Spectroscopy Industry Analysis, Insights and Forecast, 2019-2031
- 19. Competitive Analysis
- 19.1. Market Share Analysis 2024
- 19.2. Company Profiles
- 19.2.1 Waters Corporation
- 19.2.1.1. Overview
- 19.2.1.2. Products
- 19.2.1.3. SWOT Analysis
- 19.2.1.4. Recent Developments
- 19.2.1.5. Financials (Based on Availability)
- 19.2.2 Perkinelmer Inc
- 19.2.2.1. Overview
- 19.2.2.2. Products
- 19.2.2.3. SWOT Analysis
- 19.2.2.4. Recent Developments
- 19.2.2.5. Financials (Based on Availability)
- 19.2.3 Thermo Fisher Scientific Inc
- 19.2.3.1. Overview
- 19.2.3.2. Products
- 19.2.3.3. SWOT Analysis
- 19.2.3.4. Recent Developments
- 19.2.3.5. Financials (Based on Availability)
- 19.2.4 Leco Corporation
- 19.2.4.1. Overview
- 19.2.4.2. Products
- 19.2.4.3. SWOT Analysis
- 19.2.4.4. Recent Developments
- 19.2.4.5. Financials (Based on Availability)
- 19.2.5 Danaher Corporation
- 19.2.5.1. Overview
- 19.2.5.2. Products
- 19.2.5.3. SWOT Analysis
- 19.2.5.4. Recent Developments
- 19.2.5.5. Financials (Based on Availability)
- 19.2.6 Agilent Technologies Inc
- 19.2.6.1. Overview
- 19.2.6.2. Products
- 19.2.6.3. SWOT Analysis
- 19.2.6.4. Recent Developments
- 19.2.6.5. Financials (Based on Availability)
- 19.2.7 Dani Instruments SpA
- 19.2.7.1. Overview
- 19.2.7.2. Products
- 19.2.7.3. SWOT Analysis
- 19.2.7.4. Recent Developments
- 19.2.7.5. Financials (Based on Availability)
- 19.2.8 Bruker Corporation
- 19.2.8.1. Overview
- 19.2.8.2. Products
- 19.2.8.3. SWOT Analysis
- 19.2.8.4. Recent Developments
- 19.2.8.5. Financials (Based on Availability)
- 19.2.9 Shimadzu Corporation
- 19.2.9.1. Overview
- 19.2.9.2. Products
- 19.2.9.3. SWOT Analysis
- 19.2.9.4. Recent Developments
- 19.2.9.5. Financials (Based on Availability)
- 19.2.1 Waters Corporation
List of Figures
- Figure 1: Europe Mass Spectroscopy Industry Revenue Breakdown (Million, %) by Product 2024 & 2032
- Figure 2: Europe Mass Spectroscopy Industry Share (%) by Company 2024
List of Tables
- Table 1: Europe Mass Spectroscopy Industry Revenue Million Forecast, by Region 2019 & 2032
- Table 2: Europe Mass Spectroscopy Industry Volume K Unit Forecast, by Region 2019 & 2032
- Table 3: Europe Mass Spectroscopy Industry Revenue Million Forecast, by Technology 2019 & 2032
- Table 4: Europe Mass Spectroscopy Industry Volume K Unit Forecast, by Technology 2019 & 2032
- Table 5: Europe Mass Spectroscopy Industry Revenue Million Forecast, by Application 2019 & 2032
- Table 6: Europe Mass Spectroscopy Industry Volume K Unit Forecast, by Application 2019 & 2032
- Table 7: Europe Mass Spectroscopy Industry Revenue Million Forecast, by Region 2019 & 2032
- Table 8: Europe Mass Spectroscopy Industry Volume K Unit Forecast, by Region 2019 & 2032
- Table 9: Europe Mass Spectroscopy Industry Revenue Million Forecast, by Country 2019 & 2032
- Table 10: Europe Mass Spectroscopy Industry Volume K Unit Forecast, by Country 2019 & 2032
- Table 11: Germany Europe Mass Spectroscopy Industry Revenue (Million) Forecast, by Application 2019 & 2032
- Table 12: Germany Europe Mass Spectroscopy Industry Volume (K Unit) Forecast, by Application 2019 & 2032
- Table 13: France Europe Mass Spectroscopy Industry Revenue (Million) Forecast, by Application 2019 & 2032
- Table 14: France Europe Mass Spectroscopy Industry Volume (K Unit) Forecast, by Application 2019 & 2032
- Table 15: Italy Europe Mass Spectroscopy Industry Revenue (Million) Forecast, by Application 2019 & 2032
- Table 16: Italy Europe Mass Spectroscopy Industry Volume (K Unit) Forecast, by Application 2019 & 2032
- Table 17: United Kingdom Europe Mass Spectroscopy Industry Revenue (Million) Forecast, by Application 2019 & 2032
- Table 18: United Kingdom Europe Mass Spectroscopy Industry Volume (K Unit) Forecast, by Application 2019 & 2032
- Table 19: Netherlands Europe Mass Spectroscopy Industry Revenue (Million) Forecast, by Application 2019 & 2032
- Table 20: Netherlands Europe Mass Spectroscopy Industry Volume (K Unit) Forecast, by Application 2019 & 2032
- Table 21: Sweden Europe Mass Spectroscopy Industry Revenue (Million) Forecast, by Application 2019 & 2032
- Table 22: Sweden Europe Mass Spectroscopy Industry Volume (K Unit) Forecast, by Application 2019 & 2032
- Table 23: Rest of Europe Europe Mass Spectroscopy Industry Revenue (Million) Forecast, by Application 2019 & 2032
- Table 24: Rest of Europe Europe Mass Spectroscopy Industry Volume (K Unit) Forecast, by Application 2019 & 2032
- Table 25: Europe Mass Spectroscopy Industry Revenue Million Forecast, by Technology 2019 & 2032
- Table 26: Europe Mass Spectroscopy Industry Volume K Unit Forecast, by Technology 2019 & 2032
- Table 27: Europe Mass Spectroscopy Industry Revenue Million Forecast, by Application 2019 & 2032
- Table 28: Europe Mass Spectroscopy Industry Volume K Unit Forecast, by Application 2019 & 2032
- Table 29: Europe Mass Spectroscopy Industry Revenue Million Forecast, by Country 2019 & 2032
- Table 30: Europe Mass Spectroscopy Industry Volume K Unit Forecast, by Country 2019 & 2032
- Table 31: Europe Mass Spectroscopy Industry Revenue Million Forecast, by Technology 2019 & 2032
- Table 32: Europe Mass Spectroscopy Industry Volume K Unit Forecast, by Technology 2019 & 2032
- Table 33: Europe Mass Spectroscopy Industry Revenue Million Forecast, by Application 2019 & 2032
- Table 34: Europe Mass Spectroscopy Industry Volume K Unit Forecast, by Application 2019 & 2032
- Table 35: Europe Mass Spectroscopy Industry Revenue Million Forecast, by Country 2019 & 2032
- Table 36: Europe Mass Spectroscopy Industry Volume K Unit Forecast, by Country 2019 & 2032
- Table 37: Europe Mass Spectroscopy Industry Revenue Million Forecast, by Technology 2019 & 2032
- Table 38: Europe Mass Spectroscopy Industry Volume K Unit Forecast, by Technology 2019 & 2032
- Table 39: Europe Mass Spectroscopy Industry Revenue Million Forecast, by Application 2019 & 2032
- Table 40: Europe Mass Spectroscopy Industry Volume K Unit Forecast, by Application 2019 & 2032
- Table 41: Europe Mass Spectroscopy Industry Revenue Million Forecast, by Country 2019 & 2032
- Table 42: Europe Mass Spectroscopy Industry Volume K Unit Forecast, by Country 2019 & 2032
- Table 43: Europe Mass Spectroscopy Industry Revenue Million Forecast, by Technology 2019 & 2032
- Table 44: Europe Mass Spectroscopy Industry Volume K Unit Forecast, by Technology 2019 & 2032
- Table 45: Europe Mass Spectroscopy Industry Revenue Million Forecast, by Application 2019 & 2032
- Table 46: Europe Mass Spectroscopy Industry Volume K Unit Forecast, by Application 2019 & 2032
- Table 47: Europe Mass Spectroscopy Industry Revenue Million Forecast, by Country 2019 & 2032
- Table 48: Europe Mass Spectroscopy Industry Volume K Unit Forecast, by Country 2019 & 2032
- Table 49: Europe Mass Spectroscopy Industry Revenue Million Forecast, by Technology 2019 & 2032
- Table 50: Europe Mass Spectroscopy Industry Volume K Unit Forecast, by Technology 2019 & 2032
- Table 51: Europe Mass Spectroscopy Industry Revenue Million Forecast, by Application 2019 & 2032
- Table 52: Europe Mass Spectroscopy Industry Volume K Unit Forecast, by Application 2019 & 2032
- Table 53: Europe Mass Spectroscopy Industry Revenue Million Forecast, by Country 2019 & 2032
- Table 54: Europe Mass Spectroscopy Industry Volume K Unit Forecast, by Country 2019 & 2032
- Table 55: Europe Mass Spectroscopy Industry Revenue Million Forecast, by Technology 2019 & 2032
- Table 56: Europe Mass Spectroscopy Industry Volume K Unit Forecast, by Technology 2019 & 2032
- Table 57: Europe Mass Spectroscopy Industry Revenue Million Forecast, by Application 2019 & 2032
- Table 58: Europe Mass Spectroscopy Industry Volume K Unit Forecast, by Application 2019 & 2032
- Table 59: Europe Mass Spectroscopy Industry Revenue Million Forecast, by Country 2019 & 2032
- Table 60: Europe Mass Spectroscopy Industry Volume K Unit Forecast, by Country 2019 & 2032
Frequently Asked Questions
1. What is the projected Compound Annual Growth Rate (CAGR) of the Europe Mass Spectroscopy Industry?
The projected CAGR is approximately 6.50%.
2. Which companies are prominent players in the Europe Mass Spectroscopy Industry?
Key companies in the market include Waters Corporation, Perkinelmer Inc, Thermo Fisher Scientific Inc, Leco Corporation, Danaher Corporation, Agilent Technologies Inc, Dani Instruments SpA, Bruker Corporation, Shimadzu Corporation.
3. What are the main segments of the Europe Mass Spectroscopy Industry?
The market segments include Technology, Application.
4. Can you provide details about the market size?
The market size is estimated to be USD XX Million as of 2022.
5. What are some drivers contributing to market growth?
Increasing Technological Advancement; Increased Pharmaceutical and Biotechnological Compounds in Pipeline.
6. What are the notable trends driving market growth?
Triple Quadrupole (Tandem Mass Spectrometry Devices) Segment is Expected to Dominate the Market over the Forecast Period.
7. Are there any restraints impacting market growth?
High Cost of Instrument; Shortage of Skilled Technicians.
8. Can you provide examples of recent developments in the market?
June 2022: Waters Corporation unveiled new instruments, software, and product enhancements to drive drug discovery and development.
9. What pricing options are available for accessing the report?
Pricing options include single-user, multi-user, and enterprise licenses priced at USD 4750, USD 5250, and USD 8750 respectively.
10. Is the market size provided in terms of value or volume?
The market size is provided in terms of value, measured in Million and volume, measured in K Unit.
11. Are there any specific market keywords associated with the report?
Yes, the market keyword associated with the report is "Europe Mass Spectroscopy Industry," which aids in identifying and referencing the specific market segment covered.
12. How do I determine which pricing option suits my needs best?
The pricing options vary based on user requirements and access needs. Individual users may opt for single-user licenses, while businesses requiring broader access may choose multi-user or enterprise licenses for cost-effective access to the report.
13. Are there any additional resources or data provided in the Europe Mass Spectroscopy Industry report?
While the report offers comprehensive insights, it's advisable to review the specific contents or supplementary materials provided to ascertain if additional resources or data are available.
14. How can I stay updated on further developments or reports in the Europe Mass Spectroscopy Industry?
To stay informed about further developments, trends, and reports in the Europe Mass Spectroscopy Industry, consider subscribing to industry newsletters, following relevant companies and organizations, or regularly checking reputable industry news sources and publications.
Methodology
Step 1 - Identification of Relevant Samples Size from Population Database


Step 2 - Approaches for Defining Global Market Size (Value, Volume* & Price*)

Note*: In applicable scenarios
Step 3 - Data Sources
Primary Research
- Web Analytics
- Survey Reports
- Research Institute
- Latest Research Reports
- Opinion Leaders
Secondary Research
- Annual Reports
- White Paper
- Latest Press Release
- Industry Association
- Paid Database
- Investor Presentations

Step 4 - Data Triangulation
Involves using different sources of information in order to increase the validity of a study
These sources are likely to be stakeholders in a program - participants, other researchers, program staff, other community members, and so on.
Then we put all data in single framework & apply various statistical tools to find out the dynamic on the market.
During the analysis stage, feedback from the stakeholder groups would be compared to determine areas of agreement as well as areas of divergence
